John Pasalis in Toronto Real Estate News
Many of our readers have been a bit concerned about the rise in inventory (homes available for sale) in Toronto’s real estate market. The principal question on most people’s minds is; with supply on the rise and demand on the decline, is Toronto’s real estate market on shaky ground?
A couple of weeks ago I wrote a post that cautioned readers against comparing current inventory levels to the levels we saw in 2007. Inventory levels in 2007 were significantly lower than levels we’ve seen in recent years making it a bad year to use as a benchmark. (See Toronto's Real Estate Market - Are Things as Bad as They Seem?)
Total inventory alone is an important measure, but if we are to gain any insight into the overall health of our market we need to consider the total inventory (or supply) in the market relative to the existing demand for houses. Is demand keeping up with the changes in supply? Does the demand still outweigh the supply in the market? At what point is demand and supply balanced?
These are all important questions and ones that we can address by looking at something called the sales-to-inventory ratio. To calculate the sales-to-inventory ratio we take the total number of sales in a given time frame and divide that by the total inventory for that same period. For example, in July the Toronto Real Estate Board recorded 7,806 sales in July and 26,543 active listings. The sales to inventory ratio for July would simply be 7,806/26,543 = 29%.
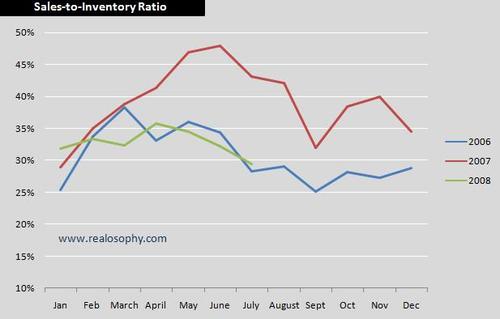
The following chart gives us a snapshot of the sales-to-inventory ratio for every month since 2006.
Note that the sales-to-inventory ratio for 2007 (red line) is significantly higher than the ratios in both 2006 and 2008. This was caused by a significant imbalance between supply and demand in 2007. Sales jumped by 12% in 2007 indicating a significant rise in demand and the supply of homes (number of new listings) declined by 2%. The increase in sales and decline in supply of houses resulted in a high sales-to-inventory ratio last year. What does a high sales-to-inventory ratio mean to the average person? It means that there were not enough houses available for sale to accommodate the demand in the market. This imbalance in the market explains the high incidence of bidding wars last year with buyers regularly offering more than a home’s list price.
The above chart also shows us that the sales-to-inventory levels for 2008 are not that far off from 2006 levels.
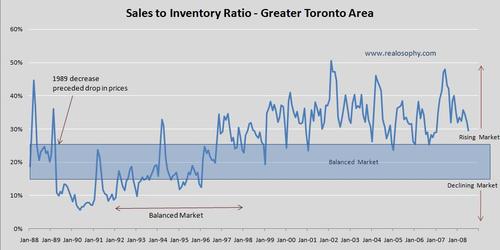
In order to gain a little more insight into what these ratios really mean we need to look beyond the past few years to see how the sales-to-inventory level changes during declining, stable and rising markets. Below is a chart with the monthly sales-to-inventory levels since 1988. Data supplied by Prudential Properties Plus.
The general consensus among most industry watchers is that a balanced market occurs when sales-to-inventory levels are between the 15% and 25% range. The sales-to-inventory ratio doesn't follow a straight line because real estate sales are very seasonal which causes the ratio to fluctuate.
Declining Market
The decline in the sales-to-inventory ratio in 1989 preceded the drop in average prices the following year. During this period supply outweighed demand which lead to a decline in prices. Average prices peaked at $273,698 in 1989 and by 1992 had dropped by 22%. The sales-to-inventory ratio fell to as low as 6% in 1990.
Balanced Market
Between 1992 and 1997 prices remained relatively stable showing very little appreciation or depreciation in value. The sales-to-inventory ratio hovered in and around the 15% to 25% during that period. The average sale price for a home in 1992 was $214,971 and by 1997 the average price was $211,307.
Rising Market
Since 1997 the sales-to-inventory ratio has for the most part been above the 25% threshold indicating that demand is outweighing supply. This resulted in a period of continuous price appreciation which we continue to experience to this day.
So how alarming is the current real estate inventory level in Toronto? As you can see, it’s not too alarming yet. Demand still outweighs supply which explains the continued price appreciation in the GTA. Having said that, I don’t expect the sales-to-inventory levels to continue at this level for too long. We should see a decline over the next year which will result in a more balanced market.
John Pasalis is a sales associate at Prudential Properties Plus in Toronto and a founder of Realosophy. Email John
Subscribe to the Move Smartly blog by email
Related Posts
Toronto's Real Estate Market - Are Things as Bad as They Seem?


