John in Toronto Real Estate News
As a follow up to my previous post which looked more closely at the market for houses in 2014, this week I’m going to look at Toronto’s condo market in 2014. I’m going to look at some of the bigger metrics (sales, new construction completions etc) to see how the market performed overall. I’m also going to dig a bit deeper into some interesting trends that we’ve been tracking over the past couple of years. There are a lot of rumours, fears and assumptions about what’s really going on in Toronto’s condo market which is why looking at the data is critical. The numbers don’t lie and by looking at data the right way we can get a better sense of what is really happening.
Record Completions
2014 was a big year for Toronto's condo market. The Greater Toronto Area saw the highest number of condo completions ever in 2014 with Realnet reporting 19,722 new condo completions in the first 9 months alone (fourth quarter numbers are not available). This surpassed the previous annual record of 16,668 completions set last year.
While it’s important to track the number of condo completions each year, it’s arguably more important to track how the market reacts to this new inventory. By that I mean, what happened to these 20,000 newly completed condos in 2014? Were they all flipped on closing for a profit? Were they all bought by end users who just moved into their units when they took possession? Were they bought by investors who listed them for rent as soon as they were completed? These questions matter because the answers to them can tell us whether the market is performing well or whether we are starting to see troubling signs.
As an example, one of the biggest arguments made by people predicting a crash in the condo market is that our market will be unable to absorb the “unprecedented supply of new condos in the pipeline”.
This on the surface is a pretty reasonable concern and even one that I myself have had over the years. If I told you that in any given year we can expect to see just over 40,000 resale condos listed for sale in the GTA most people would be concerned about the impact that an additional 20,000 newly completed condos might have on the market, in particular if many of those owners decide to list their condos for sale.
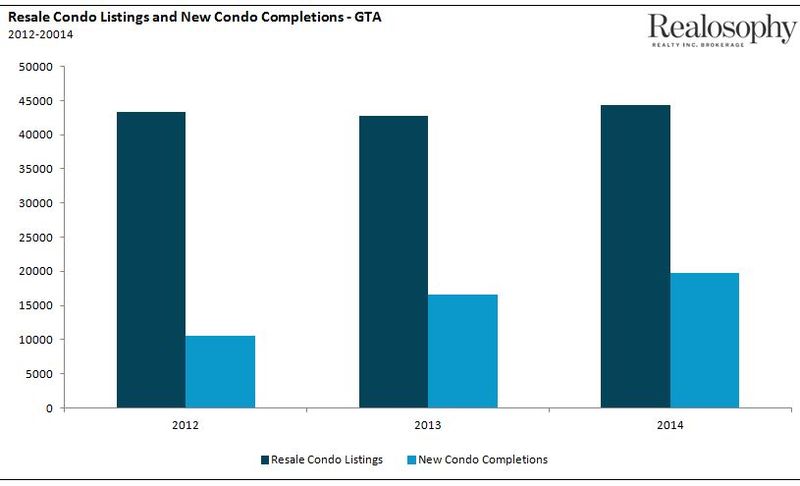
The chart below shows the total number of new condo completions per year (2014 shows Q1-Q3 only) along with the total number of resale condos listed for sale on the MLS (2014 includes an estimate of new listings for December based on the past 2 years data)
This chart reveals some very interesting facts about Toronto’s condo market. Firstly, in 2012 Toronto had 10,575 new condo completions followed by 16,668 in 2013 and 19,722 during the first 3 quarters of 2014 (all numbers from Realnet). Even though we saw nearly twice as many condo completions in 2014 as we saw in 2012, the number of resale condo listings increased by just over 2% during that same time. This suggests that the majority of the owners of these newly completed condos in 2014 did not try to flip them as soon as they took possession. If they did we would have seen a steeper increase in the number of new listings coming on the resale market.
The Rise of the Rental Condo
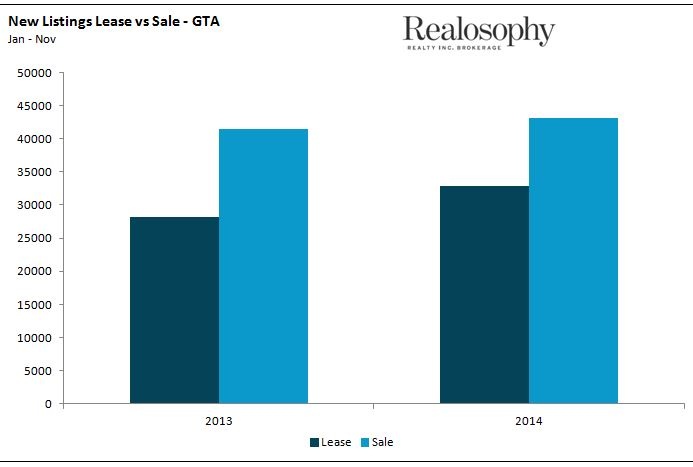
If we compare the year over year change in the number of condos listed for sale vs listed for lease we see another picture of how this new inventory was absorbed.
In the above chart, the number condos listed for sale from 2013 to 2014 increased by 4% year over year compared to a 17% increase in the number of condos that were listed for lease. In 2013 we saw 28,169 condos listed for lease compared to 32,906 in 2014, an increase of 4,737.
This steep increase in the volume of rental listings reflects the fact that the bulk of the condos that were completed in 2014 were likely owned by investors who decided to rent them out when they took possession. CHMC estimates that 50% of the condos completed this year were rented. This trend towards condos owned and rented out by investors vs owned and occupied by homeowners is one we’ve been seeing for many years in Toronto and perhaps nowhere has this shift been as pronounced as in the downtown west market of Toronto.
I’m defining the downtown west market as the C1 MLS district which is west of Yonge, south of Bloor and east of Dufferin.
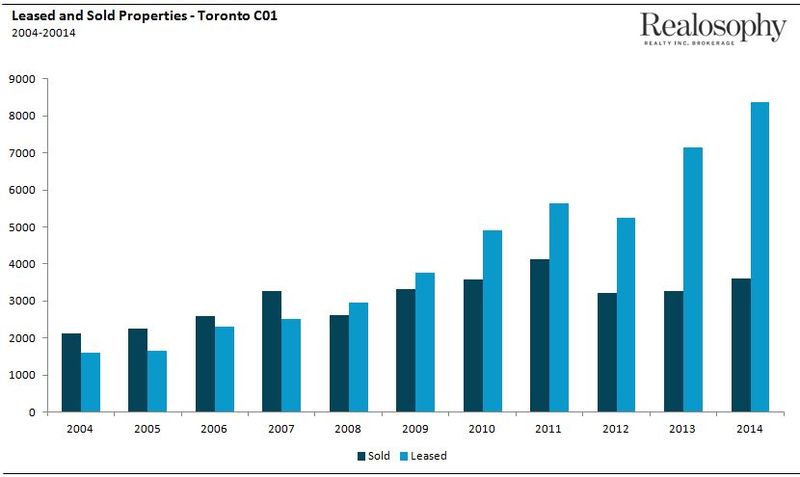
The chart below shows the number of condos that were leased and sold each year between 2004 and 2014.
Between 2004 to 2007 the number of condos sold each year surpassed the number of condos that were leased. In 2008 leased condos surpassed sold condos, a trend that has not only continued every year since but the spread between sold and leased condos has continued to widen every year.
When comparing the change in volume between leased and sold condos from 2004 to 2014, we saw a 76% increase in the number of condos that sold between 2004 and 2014 compared to a 420% increase in the number of condos that were leased.
Now it’s worth noting that this does not mean there are twice as many rental condos as there are owner occupied condos in downtown west. It’s important to remember that a particular condo unit might only get listed for sale every five years but a rental condo might get listed for rent every year or at least every other year. The chart above is simply showing us how the rental market for condos has changed in downtown west over the past ten years.
This trend is a very important one. It shapes how we analyze and think about Toronto’s condo market and it shapes how the market overall adjusts to future changes in our economy, to interest rates and even to changes within each individual condo building. While most people (real estate agents and developers in particular) are quick to praise this trend there are several downsides to the fact that nearly 100% of all new rental supply in Toronto is coming from condominium rentals vs purpose built apartment buildings. I’ll expand on this in a future post.
Strong Demand from Buyers
Strong demand from investors and a high number of rental condos is not the entire story when we’re looking at the condo market. Toronto’s condo market has seen strong demand from end users as well.
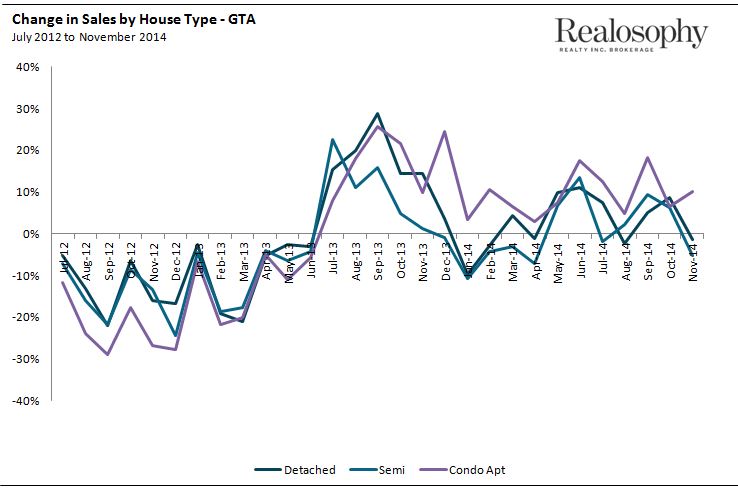
The flipside to the fear that Toronto’s condo market will be flooded with new inventory that cannot be absorbed is that demand for condos will dry up. Not only has demand not dried up in the past year, sales actually increased by roughly 10% in 2014 over 2013.
The chart below shows the year over year percentage change in sales by house type (detached, semi and condos).
You’ll see that resale condo sales performed very well in 2014 and actually surpassed the growth in sales in detached and semi-detached houses. What’s driving this strong demand for condos?
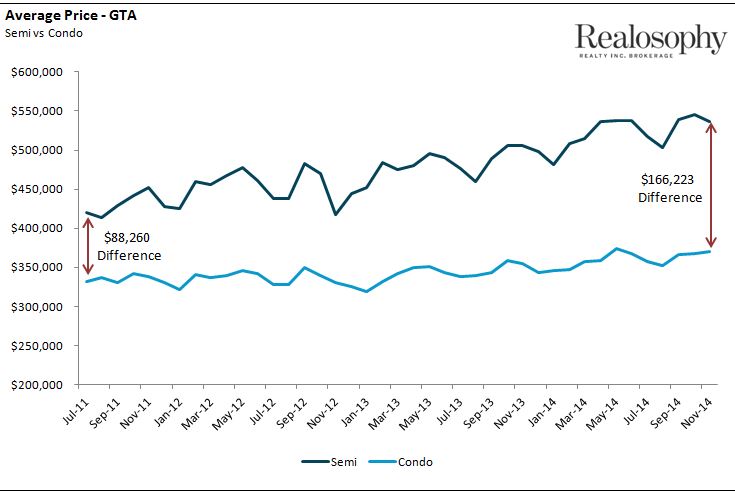
I believe that the main factor is that the spread between the cost of buying an average home and an average condo is widening, making condos a more attractive option. House prices have been appreciating at a much faster rate (5%-8% per year) compared to condos (2%-3% per year) and it’s this difference in appreciation rates that has caused the difference in average price to widen. The chart below shows the difference in average price for a condominium and a semi-detached home. Both house types are typical options for first time buyers.
In July 2011 the difference in the average price between a condo and a semi-detached house was $88,260. In November 2014 the difference nearly doubled to $166,223.
To illustrate how the diverging prices for houses and condos have impacted an average home buyer I’ll walk through a real life example. Let’s roll back the clock to 2011 and imagine we’re a first time buyer who is trying to decide between buying a $650K 3 bedroom semi in Leslieville just north of Queen street and a 2 bedroom 2 bathroom 1,100 sq ft condo also in Leslieville for $550K. Most home buyers spend less on a condo compared to a house because banks add maintenance fees to their monthly cashflow calculations which means their mortgage approval ends up being lower.
At the time, many first time buyers were gravitating towards buying the semi because they felt they were getting a bit more value (both the house and the outdoor space were bigger).
Now suppose we decided to put our search on hold in 2011 and started searching again in 2014. The $550K condo that we were interested in back in 2011 is now worth $592K (2.5% appreciation per year) which is perfectly fine because we’re making a bit more money today than we were 3 years ago so it’s still within our budget. But when we look at the 3 bedroom semi we were interested in 3 years ago, the price for it has increased to $796K (7% appreciation per year) putting it out of our reach financially.
In just three years the difference in price between these two properties has doubled from $100K to $200K.
In our example above, our budget for a home today would be in the $690K range which would either put us in a smaller or inferior home (compared to the $650K semi three years ago) in the same part of Leslieville, or to get a house that was comparable in size and condition as the one from 2011 we would have to look in more affordable neighbourhoods.
As house prices continue to increase at a much faster rate than condos, many first time buyers will be turning their attention to buying a condo as a first option because condos will appear to offer a better value relative to houses.
Related Article
Toronto’s Real Estate Market in 2014 – A Year in Review
John Pasalis is the President and Broker of Realosophy Realty Inc. Brokerage in Toronto. A leader in real estate analytics and pro-consumer advice, Realosophy helps clients buy or sell a home the right way. Email John


