Why the widely reported drop in condo prices in last week's news was misleading.
In Week 10 of our weekly look at the market's numbers during the Coronavirus (COVID-19) crisis, I'm reviewing the latest real estate sales data for the week ending April 25th. (Here's a reminder of why I'm tracking numbers weekly right now.)
Click on the video below for this week's update - a brief written summary follows below it.
You can also access the same video via YouTube, Facebook and Instagram. And if you are into stats, check out my Twitter for more charts on this week's numbers.
Send me your questions or comments via any of the above channels or email me at askjohn@movesmartly.com
And as always, if you find this info helpful, please "like" or "follow" what you see, it's much appreciated!
Home sales in the GTA continue to show a steep 53% decline over last year which was matched by a 50% decline in new listings.
But we can get more insight into the balance between supply and demand through this next chart which measures the months of inventory. The MOI just takes the total number of homes on the market and divides that by the number of homes we expect to sell in a given month based on recent sales.
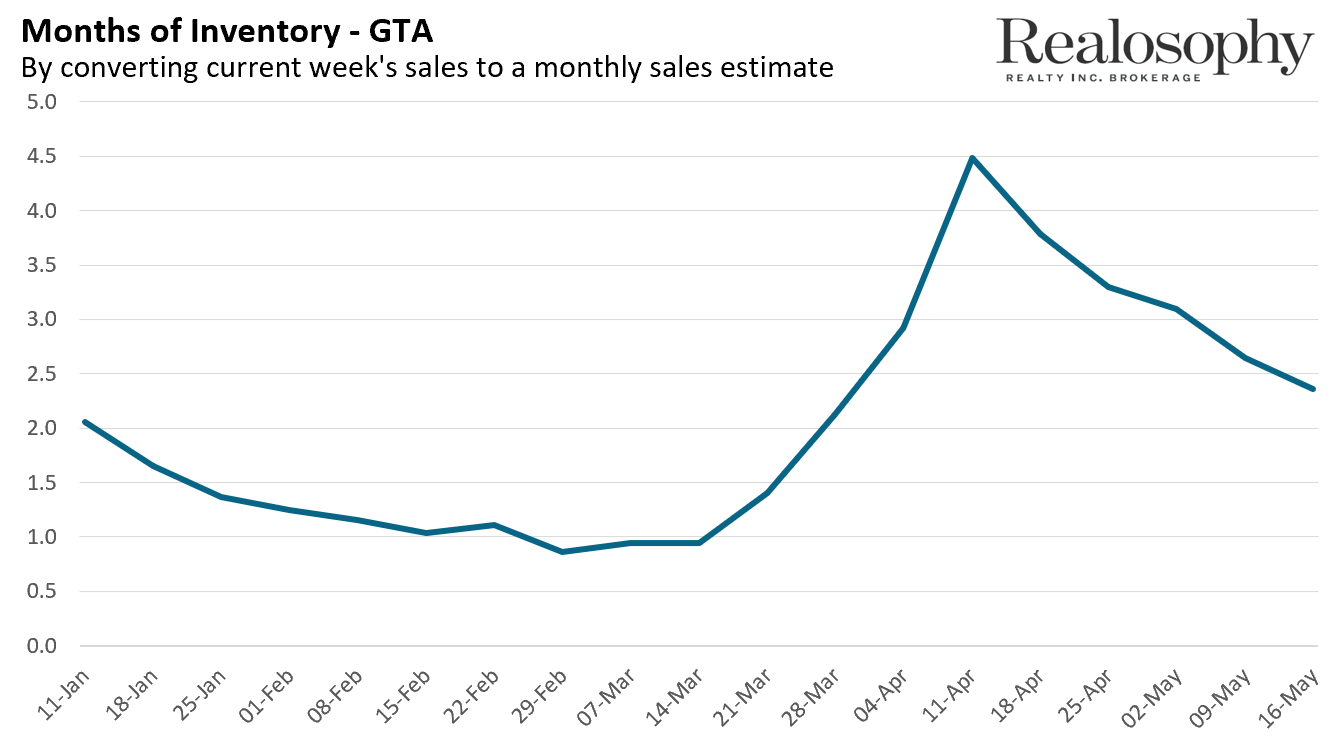
For the week ending April 11th, we had 4.5 months of inventory which means that if no more homes came on the market and sales levels remained at the same level - it would take 4.5 months for all the available homes to sell. Last week, we had 2.4 months of inventory which means over this short period inventory levels dropped drastically.
We have more buyers in the market competing for fewer homes available for sale.
This is happening because buyers have been re-entering the market at a faster rate than sellers.
Since starting these weekly videos, I've indicated that Toronto area home prices have remained relatively stable. Prices are down slightly from the peaks reached in early March, but overall they have been relatively balanced.
But last week there were a series of news articles that were saying condo prices have dropped between February and April by 10% - that’s about $65K. Some articles were saying that in some areas the decline in value was over $100K and as much as 18%.
So what is the truth? Are condo prices stable or falling off a cliff?
One way to answer this question is to consider the number of homes selling in each price range, or more accurately - the % of sales in each price category.
We can see that in February sales under $500K made up 18% of all the sales in that month, sales between $500-$600K accounted for 23% of sales and if we go all the way to over $1M we see that they made up 11% of all sales.
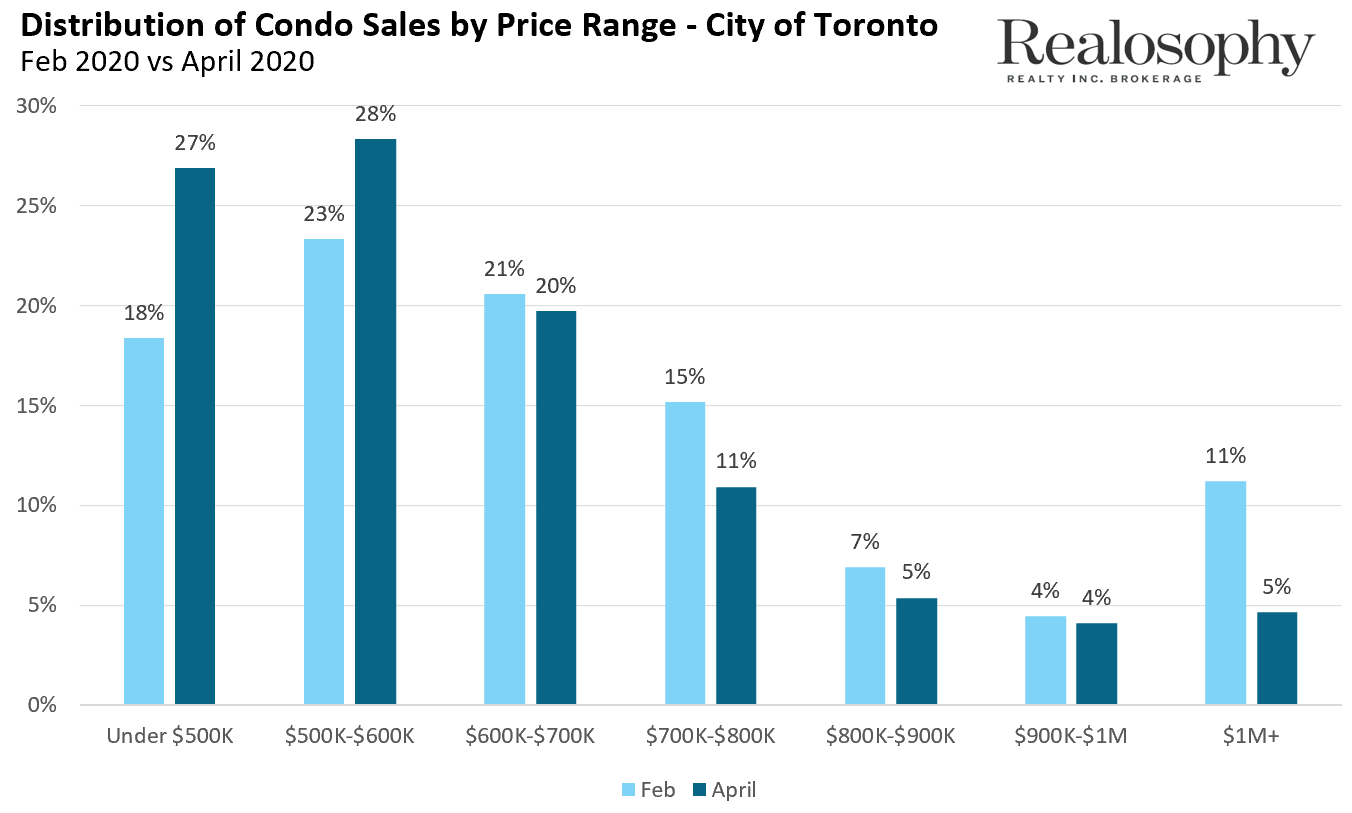
Now when we compare this to April, we see a big increase in the % of transactions under $600K and every price category over $600K saw a decline in their proportion of sales with sales over $1M falling to just 5%.
One of the main reasons median prices fell is because April saw a big increase in affordable units selling (as a % of all sales) and a big decline in the proportion of sales over $1M. The other big factor influencing these numbers is the relatively low number of sales in April. In February, over 1,500 condos sold compared to just over 500 in April. The fewer the sales the more noisy the data becomes.
This is one of the reasons I started these weekly videos, to bring some clarity to all of the different things we are reading about the real estate market, particularly in these unprecendented times, so that you can make decisions based on facts, not fiction.
Have more specific questions about buying and selling a home? Email me directly at AskJohn@MoveSmartly.com
Stay well and I'll be back with the latest numbers next week.
John Pasalis is President of Realosophy Realty, a Toronto real estate brokerage which uses data analysis to advise residential real estate buyers, sellers and investors.
A specialist in real estate data analysis, John’s research focuses on unlocking micro trends in the Greater Toronto Area real estate market. His research has been utilized by the Bank of Canada, the Canadian Mortgage and Housing Corporation (CMHC) and the International Monetary Fund (IMF).
Follow John on Twitter @johnpasalis
Published: May 22, 2020