Home sales numbers continue to be down across Toronto and the GTA, but an equal drop in new homes for sale appears to be keeping prices stable.
In Week 6 of our weekly look at the market's numbers during the Coronavirus (COVID-19) crisis, I'm reviewing the latest real estate sales data for the week ending April 18th. (Here's a reminder of why I'm tracking numbers weekly right now.)
Click on the video below for this week's update - a brief written summary follows below it.
You can also access the same video via YouTube, Facebook and Instagram. And if you are into stats, check out my Twitter for more charts on this week's numbers.
Send me your questions or comments via any of the above channels or email me at askjohn@movesmartly.com
And as always, if you find this info helpful, please "like" or "follow" what you see, it's much appreciated.
Toronto’s housing market continues to see big declines in both sales and new listings as the Coronavirus continues to impact the market, but this downward trend did show signs of stabilizing this past week.
Looking at the number of sales, they are down 71% over last year - very similar to the 73% decline we saw last week.
New listings are down 64% over last year which is the same rate of decline as last week.
But there are signs of stability when it comes to the relationship between demand and supply which we refer to as the Months of Inventory or MOI.
The MOI is calculated by taking the number of homes available for sale and dividing it by the number of homes sold over the past 30 days. So if there are 1,000 homes for sale and 500 have sold, the MOI is 2, or two months of inventory.
I find this to be an important metric to monitor because it captures both the demand and supply in one metric and it’s the relationship between supply and demand that ultimately tells us what might happen to home prices.
The GTA has roughly 4 months of inventory right now and typically when we have an MOI somewhere between 4 to 6, we usually see very little growth in house prices. This is what we call a balanced market, in the sense that it doesn’t favour buyers or sellers.
When we have an MOI of 1 like we had just over a month ago, this is typically a very competitive market favouring sellers with house prices rising rapidly. Prices rise rapidly because supply is tight. For every home that sells there is only 1 other home available for sale.
Conversely, when we have 8 to 10 months of inventory, there are a lot of homes on the market for buyers to choose from and this usually puts downward pressure on prices.
So the MOI on the market right now is a lot like the speedometer of the market which gives us clues into whether home prices are likely to rise, fall or stay flat in the future. When our “speedometer” is between 4 to 6 months prices, prices are usually flat, when it’s below 4, prices start to increase and above 6, it usually leads to a decline in prices.
But more important than knowing the MOI at any given point in time is understanding how it is changing over time. Are we speeding up, slowing down or on cruise control?
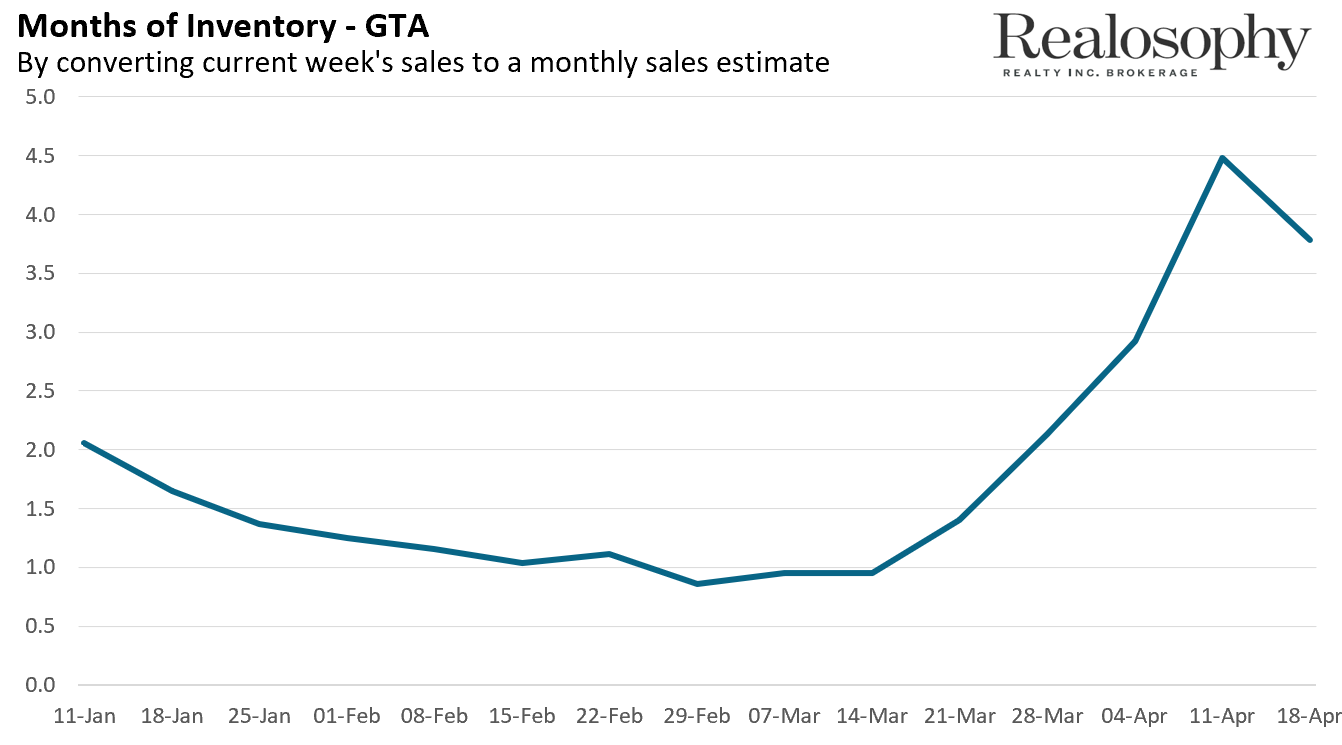
This chart shows the MOI for the GTA from the start of the year. For the first two months of the year the market was picking up steam. Then the MOI fell from 2 months to 1 month and by the end of Feb, home prices were rising by 17% per year. When this happens, it’s like the housing market is hitting on the gas pedal which pushes prices even higher.
Then in the 3rd week of March, when the government of Ontario declared a state of emergency due to the Coronavirus, the market started to hit the breaks and we can see that with the increase in inventory going from under 1 month to 4 months in a very short period.
One of our fears when housing markets are cooling down rapidly like this is that an MOI of 4 may become 6, 8 or 10 and that if this happens, we get a lot of downward pressure on home prices.
But as of last week, that didn’t happen. The MOI dipped slightly, but more importantly, stayed around 4 months.
Of course, we are only looking at 2 weeks worth of data and it’s anyone’s guess what next week will look like. But if we see roughly this same level of inventory next week then it’s a sign that the market may be evening out - at least in the short term.
This would mean that the housing market is not heating up or cooling down - it’s on cruise control in the 4 months of inventory range where home prices tend to stay stable, which is a good thing.
Now, while this is a positive sign this week, the market is still very fast-changing (hence the weekly tracking) - I would advise that it is still a time for caution for both home buyers and sellers, which means that buyers should look out for overpaying and sellers should look out for waiting too long to accept reasonable offers.
Have have more specific questions about your personal home buying and selling needs? Please send me an email at AskJohn@MoveSmartly.com
Stay well and I’ll see you next week.
John Pasalis is President of Realosophy Realty, a Toronto real estate brokerage which uses data analysis to advise residential real estate buyers, sellers and investors.
A specialist in real estate data analysis, John’s research focuses on unlocking micro trends in the Greater Toronto Area real estate market. His research has been utilized by the Bank of Canada, the Canadian Mortgage and Housing Corporation (CMHC) and the International Monetary Fund (IMF).
Follow John on Twitter @johnpasalis
Published: April 23, 2020