An increase in months of inventory suggests buyers as slowly re-entering the market - but not all regions across the Toronto area are picking up at the same speed.
In Week 7 of our weekly look at the market's numbers during the Coronavirus (COVID-19) crisis, I'm reviewing the latest real estate sales data for the week ending April 25th. (Here's a reminder of why I'm tracking numbers weekly right now.)
Click on the video below for this week's update - a brief written summary follows below it.
You can also access the same video via YouTube, Facebook and Instagram. And if you are into stats, check out my Twitter for more charts on this week's numbers.
Send me your questions or comments via any of the above channels or email me at askjohn@movesmartly.com
And as always, if you find this info helpful, please "like" or "follow" what you see, it's much appreciated!
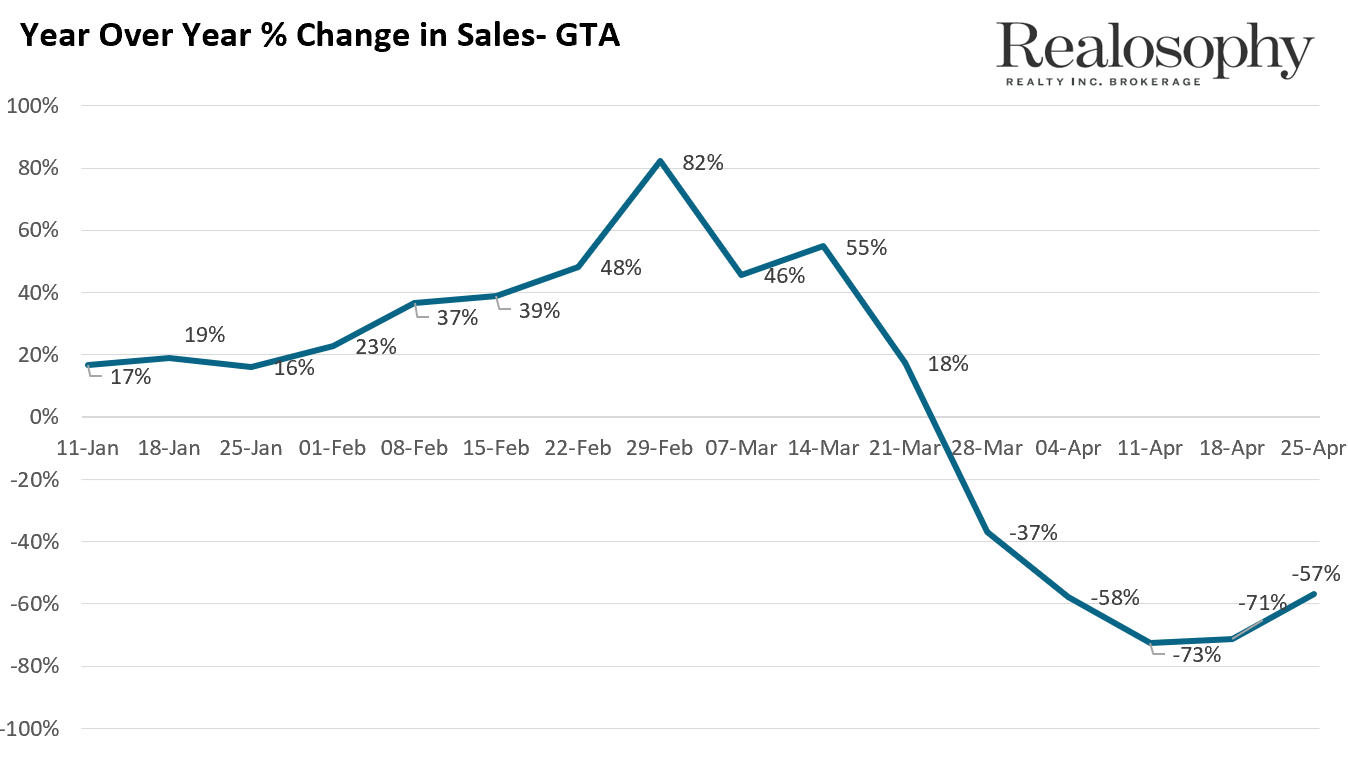
When we look at the year over year change in sales for the GTA’s real estate market for the week ending April 25th, we see that sales are down 57% year over year. This of course continues to be a big drop over last year, but when we compare it to the past couple of weeks, it’s a slight improvement.
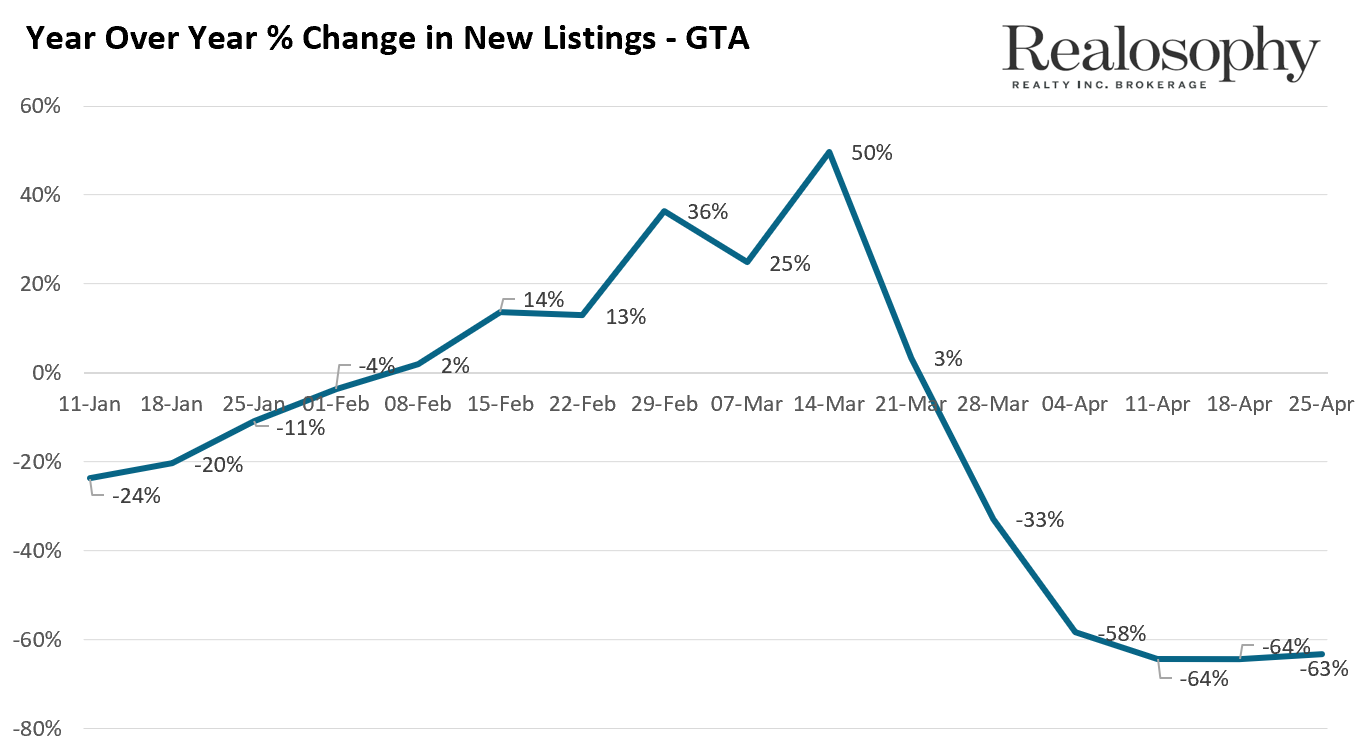
New listings on the other hand were down 63% over last year which is pretty much the same rate of decline we saw the previous two weeks.
Now when we look at this relationship between supply and demand, which we refer to as Months of Inventory (MOI), we see an interesting trend. As a reminder, the MOI uses the current inventory of homes for sale and the number of homes that sold in the past 30 days to estimate how long it would take for all the current homes on the market to sell if no more homes were put on the market.
The MOI for the GTA has actually declined over the past 2 weeks and now sits at 3.3 months. Now what exactly does that tell us?
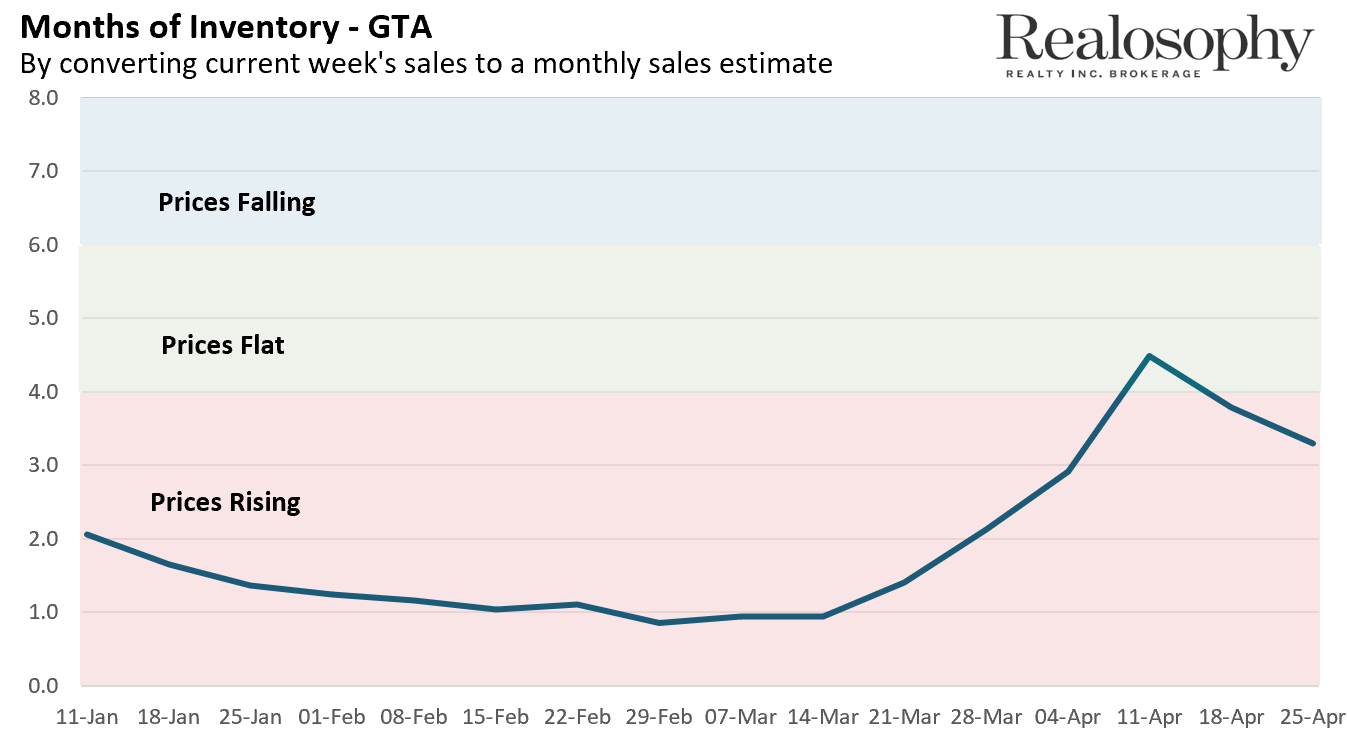
When the MOI sits in this range below 4 months, it usually means that prices are likely to rise. The lower the inventory, the faster prices will rise. When we are between 4-6 months we can usually expect home prices to remain relatively flat and anything above 6 months typically leads to a decline in home prices.
There are two key things we look for when looking at MOI. The first is where we are at today, and at 3.3 months, we are in a range where prices slightly tend to increase over time.
But more importantly, we like to see how inventory is changing over time - Is the market cooling down, speeding up or in cruise control? Right now, with inventory levels declining, the market is actually more competitive today than it was 2 weeks ago. In short, the market is gradually heating up, not cooling down.
Why is this happening?
Following the sharp drop-off we saw at the start of the COVID-19 emergency, it looks like buyers are very gradually jumping back into the market faster than sellers which is causing supply to tighten. Had sellers jumped back into the market faster than buyers, we would have seen the opposite trend - inventory rising instead of falling.
When comparing the MOI across the GTA we see that Durham is the most competitive regional market with 2 months of inventory and Halton, Peel and Toronto are all at around 3 months while York is the slowest market with 5.5 months of inventory. This suggests that Durham is the most competitive market today while York is the slowest market.
Now we of course need to take this data cautiously because this change from a market that was cooling down to gradually heating up has only been going on for a couple of weeks - but it is an important trend to keep an eye on.
I would still advise that it is still a time for caution for both home buyers and sellers. As I’ve mentioned before, this means that sellers should not wait too long to accept reasonable offers especially if you’re in slower markets like York Region. Buyers also need to be cautious if they’re buying in a neighbourhood with volatile price trends. You don’t want to find yourself overpaying in this market.
Have more specific questions about buying and selling a home? Email me directly at AskJohn@MoveSmartly.com
Stay well and I'll be back with the latest numbers next week.
John Pasalis is President of Realosophy Realty, a Toronto real estate brokerage which uses data analysis to advise residential real estate buyers, sellers and investors.
A specialist in real estate data analysis, John’s research focuses on unlocking micro trends in the Greater Toronto Area real estate market. His research has been utilized by the Bank of Canada, the Canadian Mortgage and Housing Corporation (CMHC) and the International Monetary Fund (IMF).
Follow John on Twitter @johnpasalis
Published: April 29, 2020