
The housing market in the Toronto area became far more competitive in January thanks to a rapid increase in the number of sales and moderate to no growth in the number of new listings.
WATCH: My weekly market update on this story and others - Click play on video above or watch directly on our Move Smartly YouTube channel here
READ: My full analysis on this issue below
The Market Now
In early December, when the housing market was still sluggish and the words “bidding war” were rarely heard, I highlighted some early signs that Toronto’s housing market might be turning a corner. At the time, it was too early to tell if the trends I was seeing were short-term dynamics or a real shift in the market, but two months later, it is looking a lot clearer that Toronto’s market did turn a corner.
A decline in fixed mortgage rates since the summer, coupled with expectations that the Bank of Canada is done raising interest rates, has pushed many buyers back into the housing market, hoping to get a head start before any change in the Bank of Canada’s policy rate.
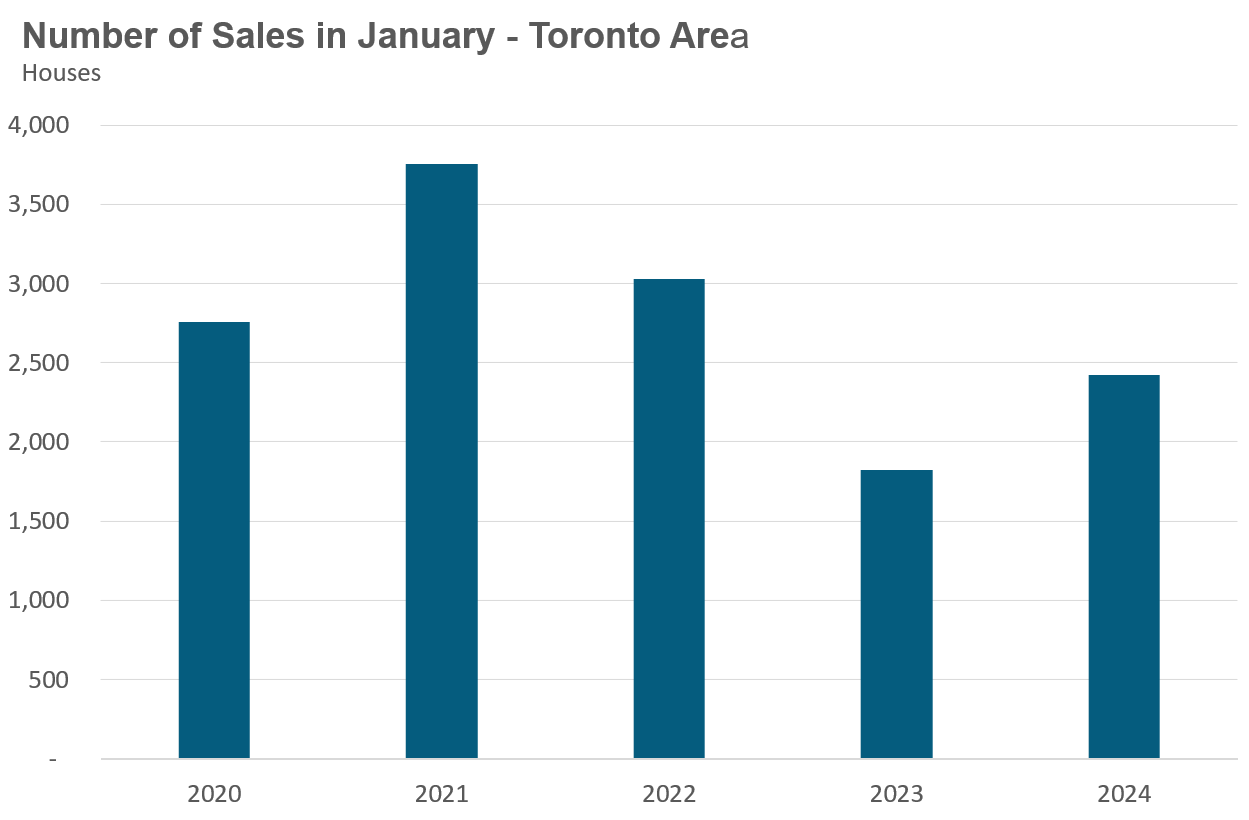
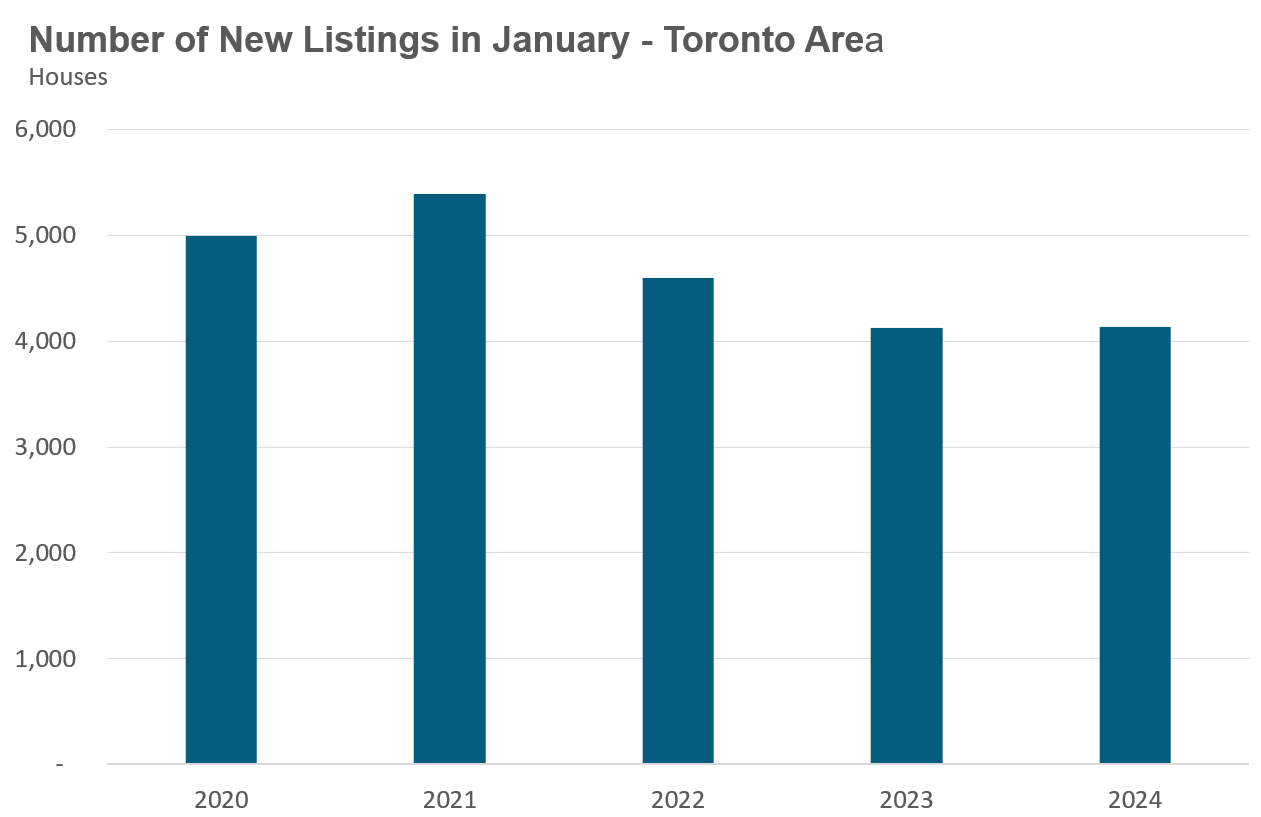
The housing market in the Toronto area became far more competitive in January thanks to a rapid increase in the number of sales (houses up 33% and condos up 40%) and moderate to no growth in the number of new listings (houses flat and condos up 17%).
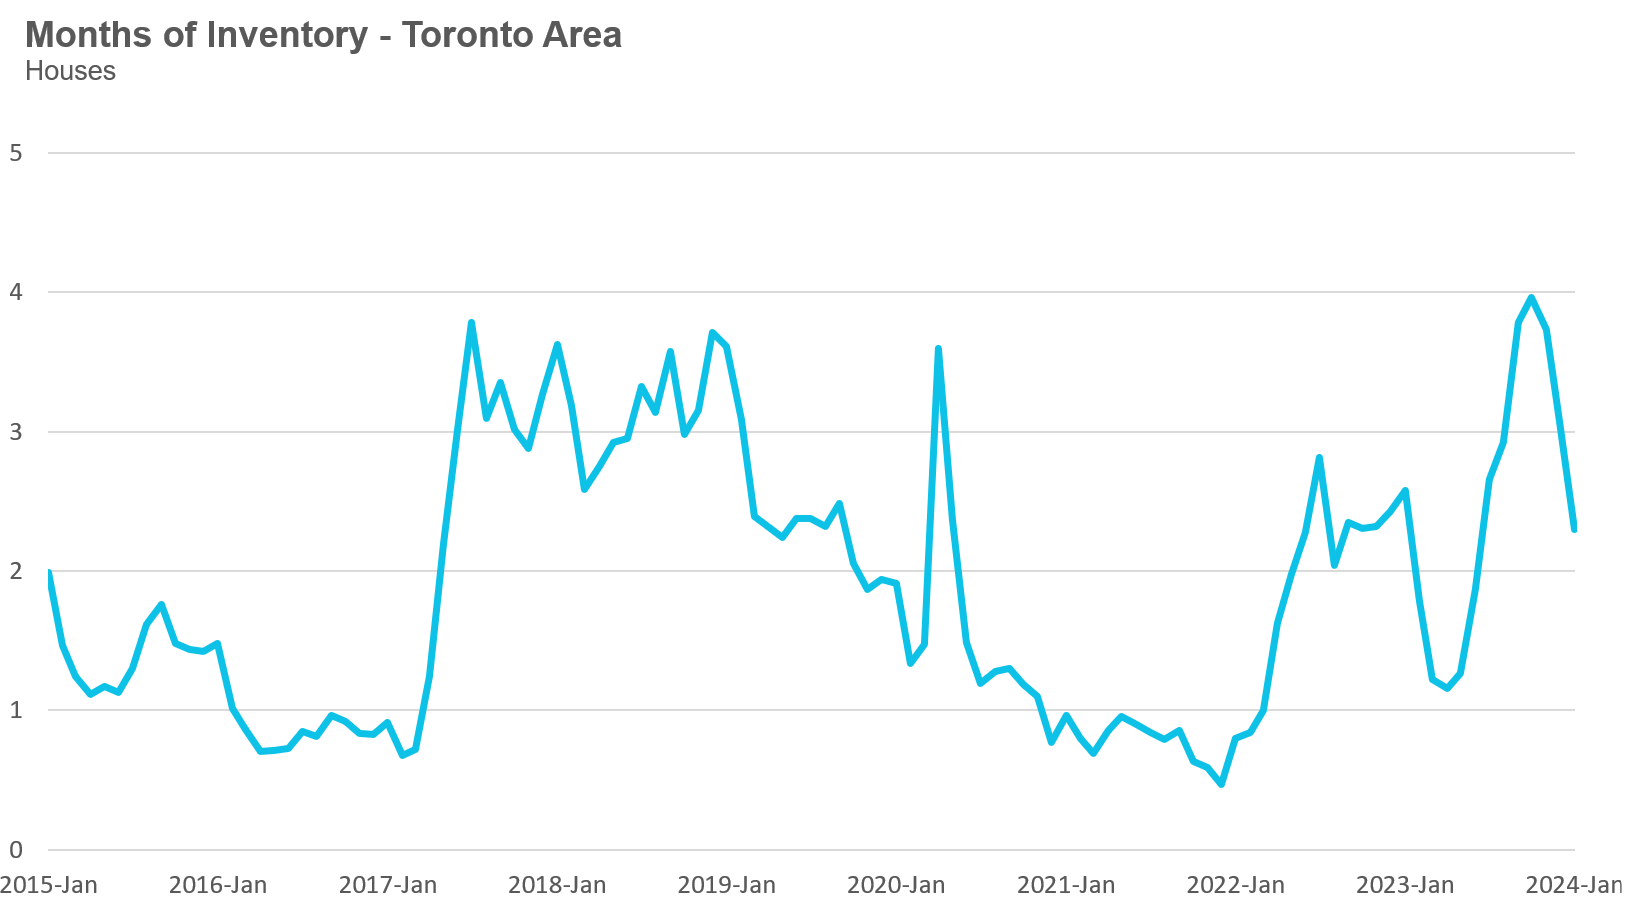
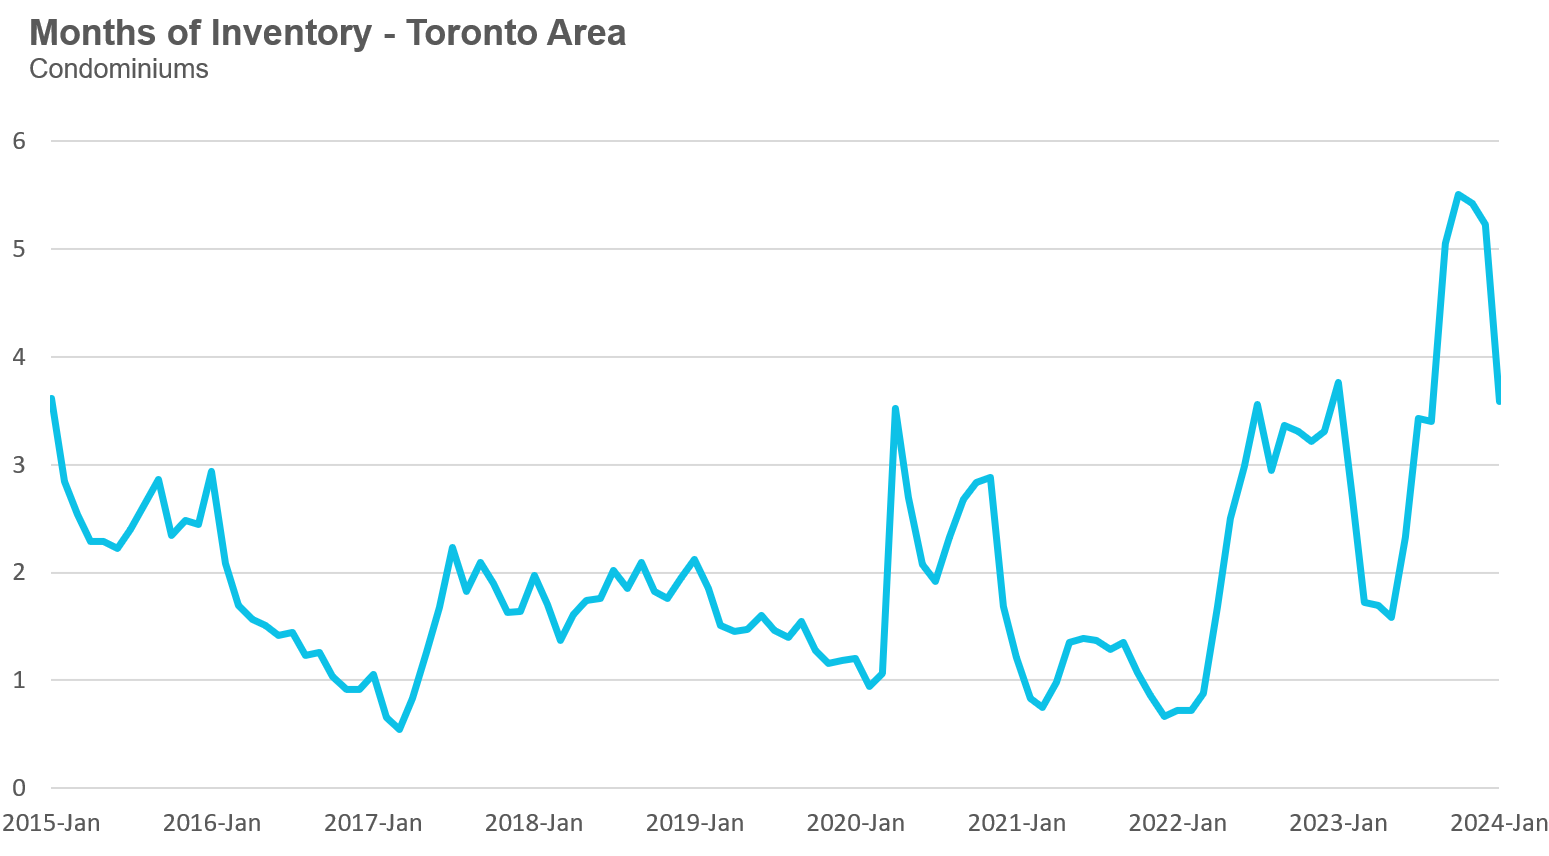
The Months of Inventory for houses has declined from a high of 4MOI in October to 2.3MOI in January. Between September and December, the condominium market had more than 5 months of inventory, but inventory levels declined to 3.6 in January.
So far, this increase in demand has not translated into higher prices (average or median), but if demand from home buyers continues to outpace new listings, we may see prices start to trend up.
-2.jpg?width=560&height=280&name=Public%20Webinar%20%E2%80%93%20August%202022_MoveSmartly_%20600x300%20(1)-2.jpg)
WATCH LIVE: The Market Now with John Pasalis - Thurs February 15th 2024 12PM ET
Join John Pasalis, report author, for key highlights of this month's report and responses to your questions. Sign Up Now >
By the Numbers: January 2024
Houses
The average price for a house in the Toronto area was $1,260,727 in January, down 1% over the same month last year. Last month's median house price was $1,100,000, also down 1% over last year.
House sales in January were up 33% over last year, while new house listings were unchanged.
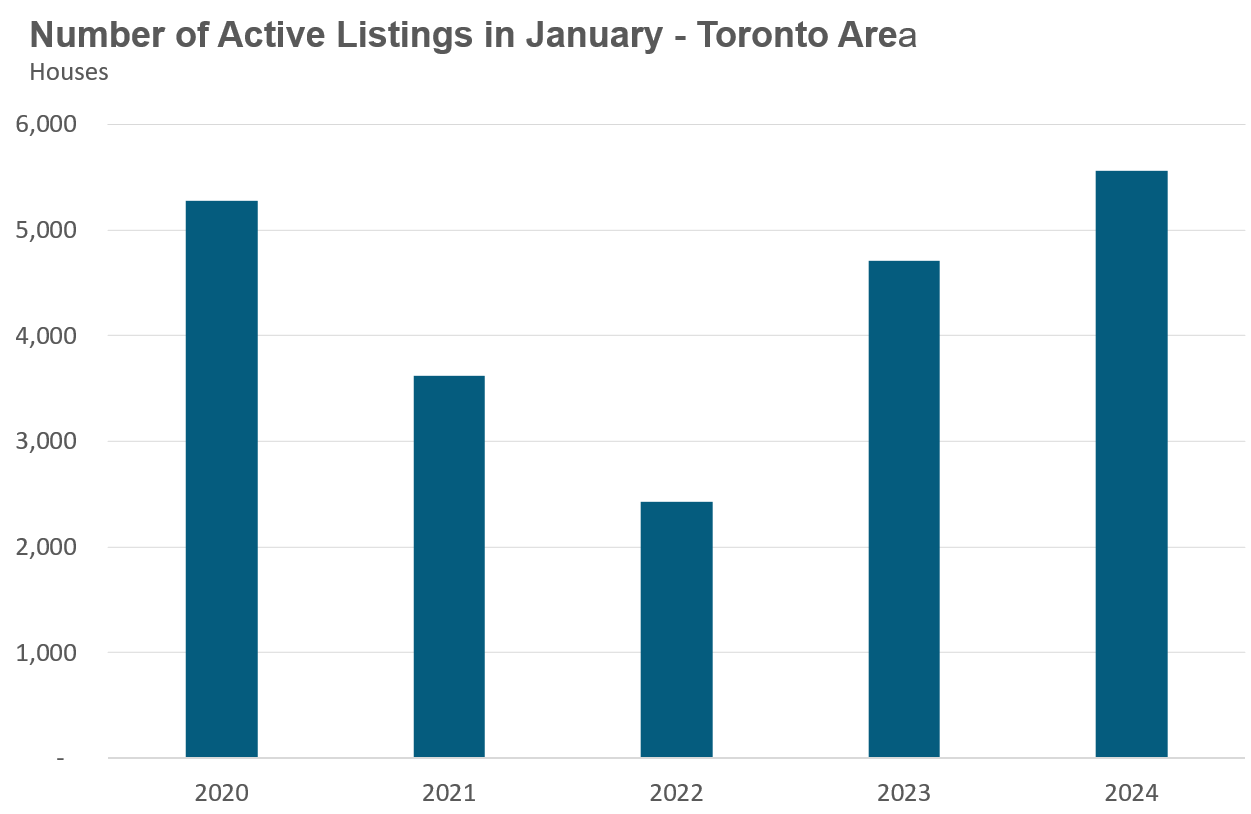
The number of houses available for sale at the end of the month, or active listings, was up 18% over last year.
The current balance between supply and demand is reflected in the MOI, which is a measure of inventory relative to the number of sales each month.
In January, the MOI for houses fell to 2.3.
Condos
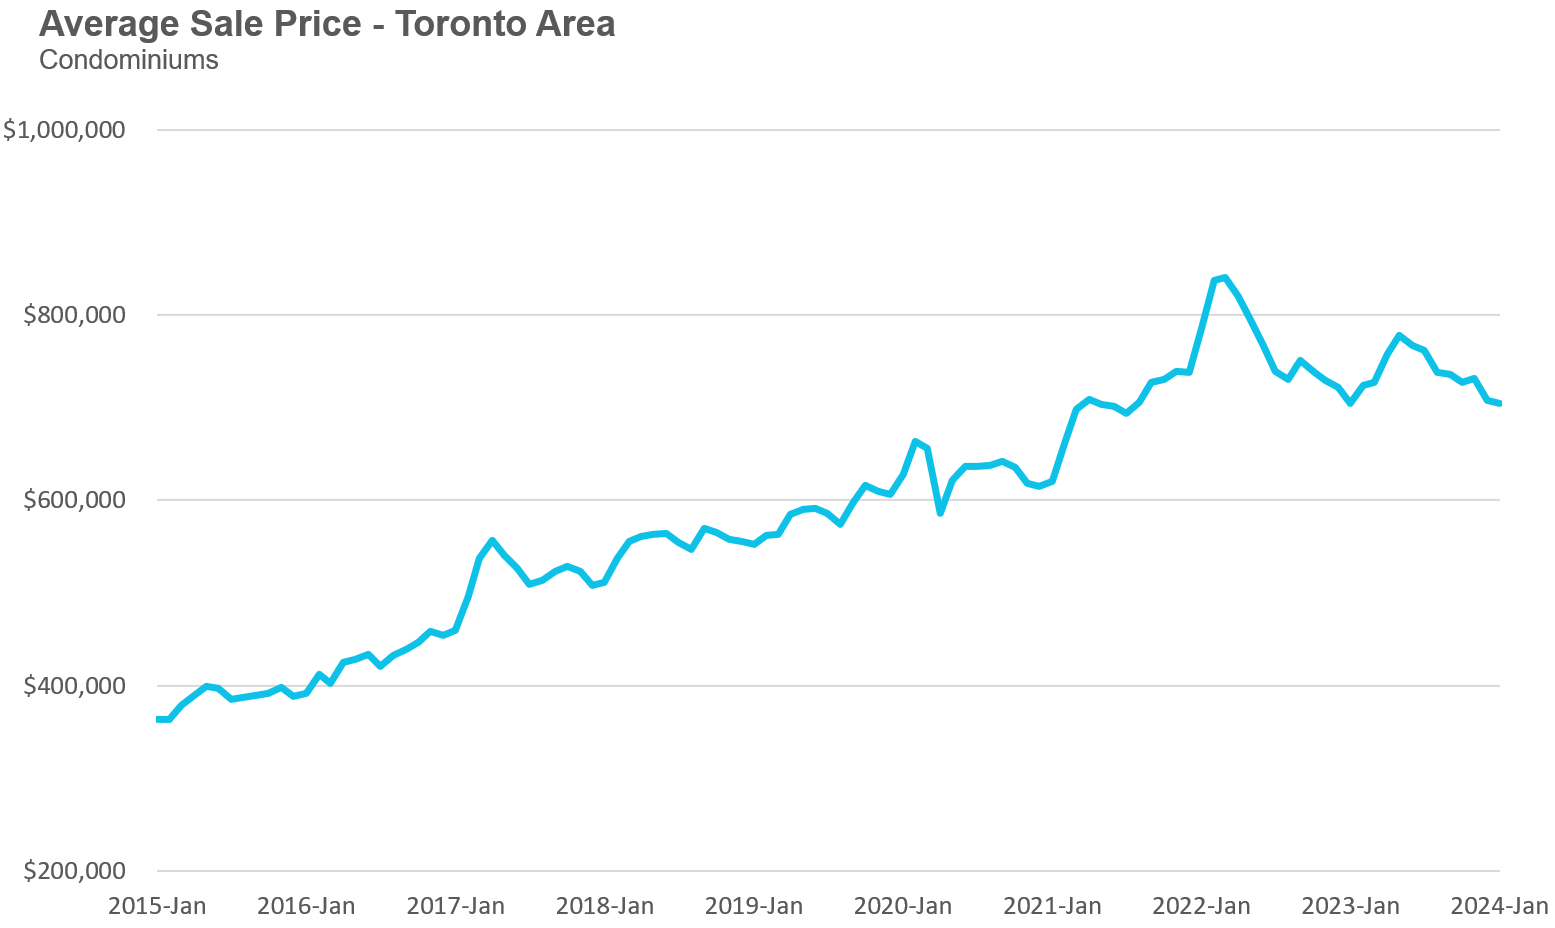
The average price for a condo in the Toronto Area was $704,982 in January, which is unchanged over last year. The median price for a condo in January was $633,000, also unchanged over last year.
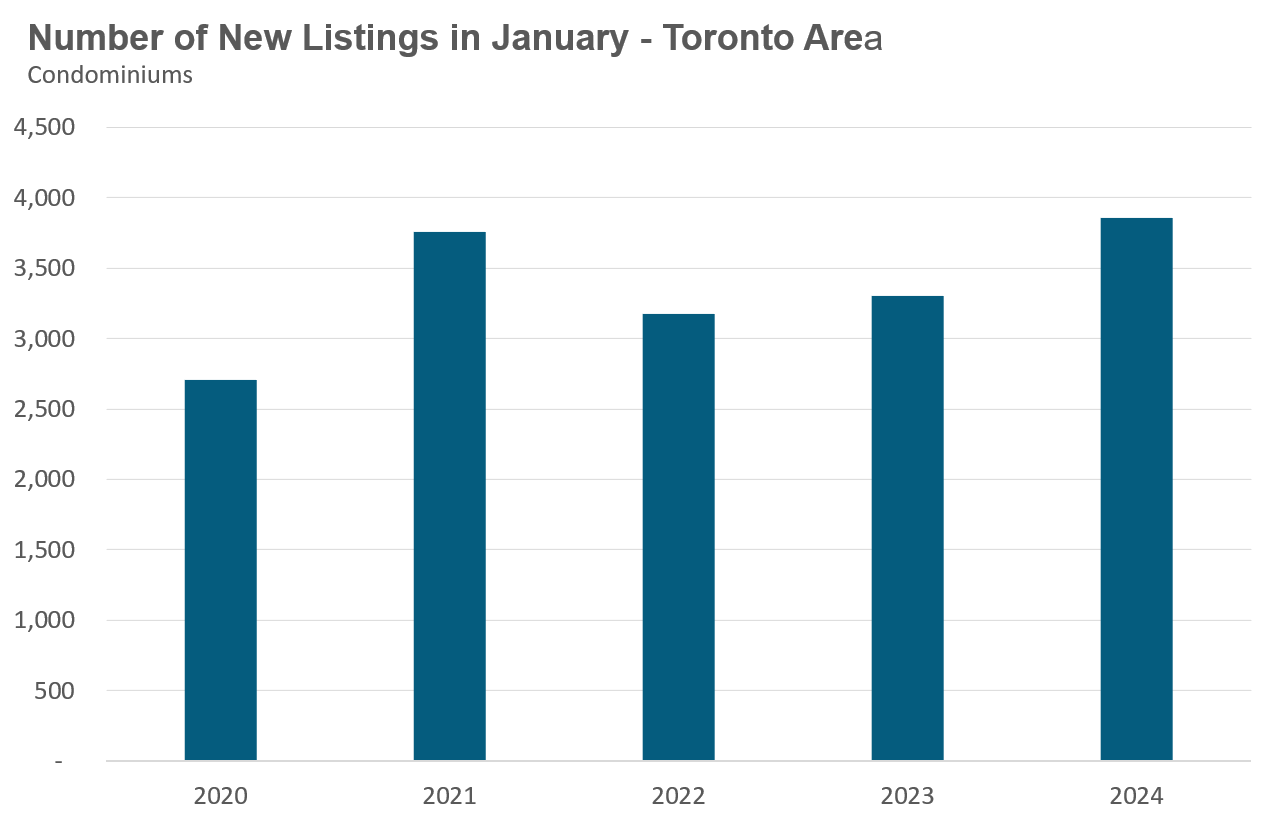
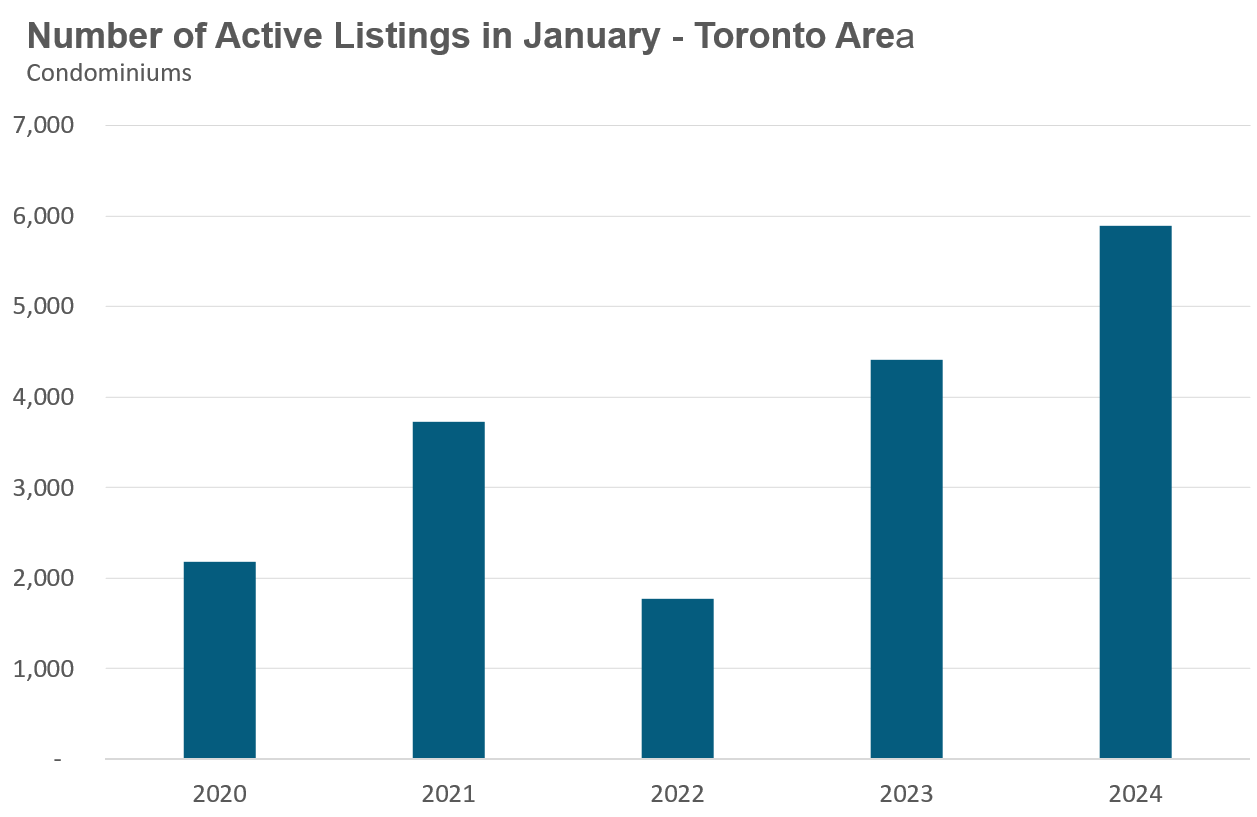
Condo sales in January were up 40% over last year, and new condo listings were up 17% over last year. The number of active condo listings was up 33% over last year. The MOI decreased slightly to 3.6.
Browse detailed monthly statistics for January 2023 for the entire Toronto area market, including house, condo and regional breakdowns below.
Monthly Statistics
House Statistics
House sales (low-rise freehold detached, semi-detached, townhouse, etc.) in the Greater Toronto Area (GTA) in January 2023 were up 33% compared to the same month last year.
New house listings in January were unchanged compared to last year.
The number of houses available for sale (“active listings”) was up 18% in January compared to the same month last year.
The Months of Inventory ratio (MOI) looks at the number of homes available for sale in a given month divided by the number of homes sold in that month. It answers the following question: If no more homes came on the market for sale, how long would it take for all the existing homes on the market to sell, given the current level of demand? The higher the MOI, the cooler the market is. A balanced market (a market where prices are neither rising nor falling) is one where MOI is between four to six months. The lower the MOI, the more rapidly we would expect prices to rise.
While the current level of MOI gives us clues into how competitive the market is on-the-ground today, the direction it is moving in also gives us some clues into where the market may be heading.
The MOI for houses dipped to 2.3 in January, down from 4 MOI in October.
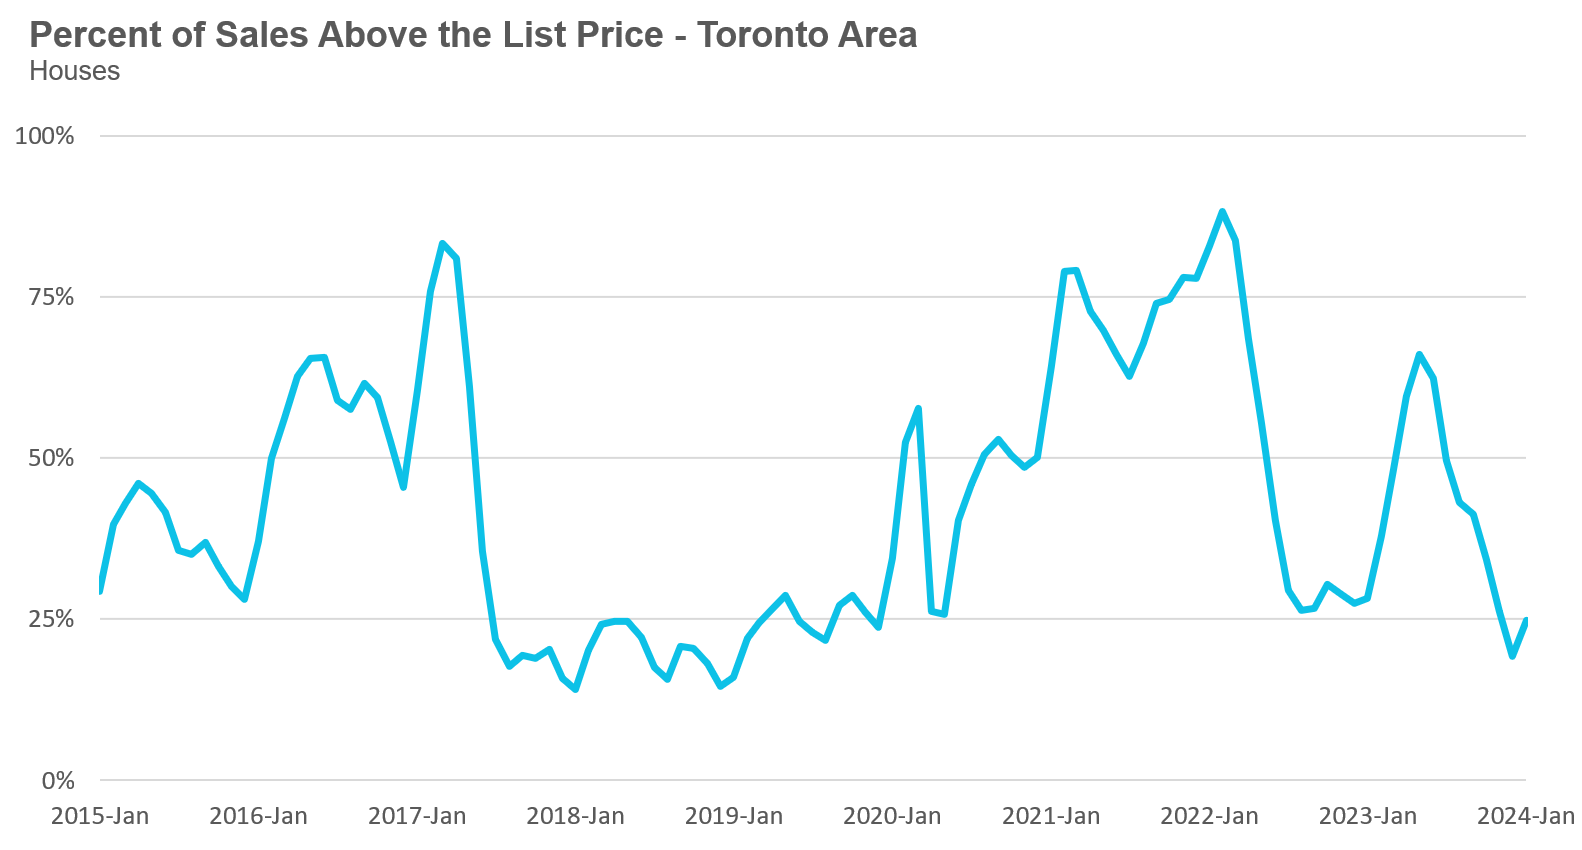
The share of houses selling for more than the owner’s list price increased to 25% in January.
The average price for a house in January was $1,260,727 in January 2024, down 1% compared to the same month last year.
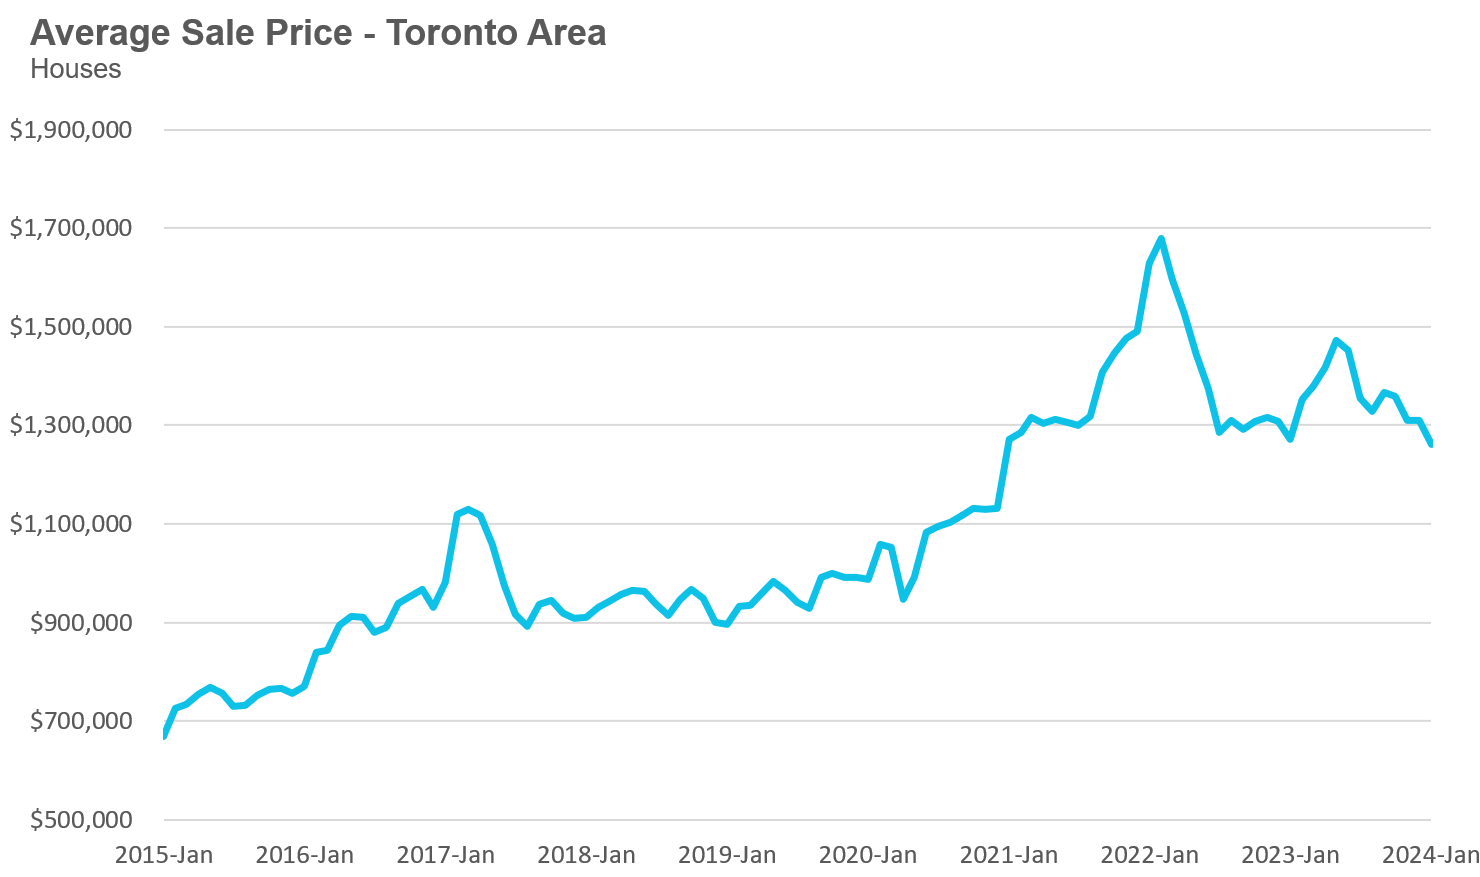
The median house price in January was $1,100,000, down 1% over last year.
The median is calculated by ordering all the sale prices in a given month and then selecting the price that is at the midpoint of that list such that half of all home sales are above that price and half are below that price. Economists often prefer the median price over the average because it is less sensitive to big increases in the sale of high-end or low-end homes in a given month, which can skew the average price.
Condo Statistics
Condo (condominiums, including condo apartments, condo townhouses, etc.) sales in the Toronto area in January 2023 were up 40% over the same month last year.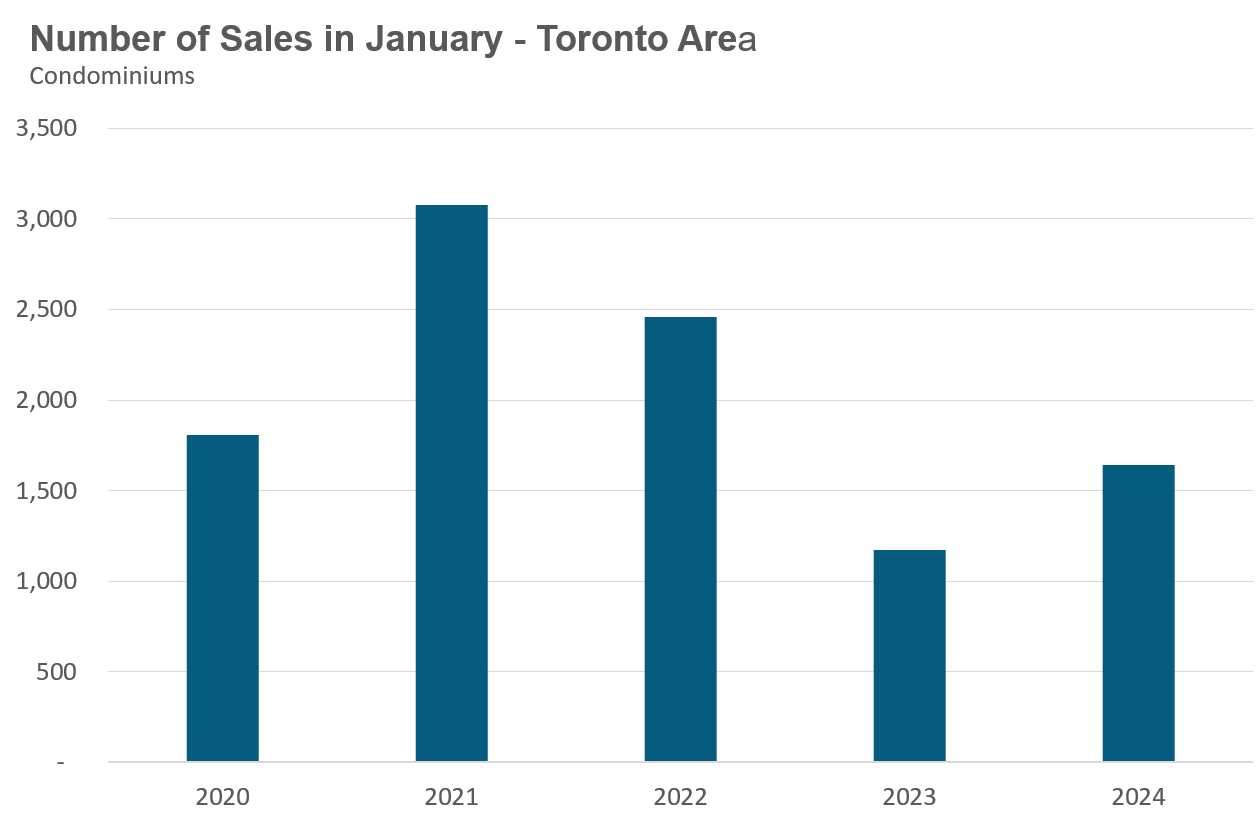
New condo listings were up 17% in January over last year.
The number of condos available for sale at the end of the month, or active listings, was up 33% over last year.
Condo months of inventory decreased slightly to 3.6 MOI in January.
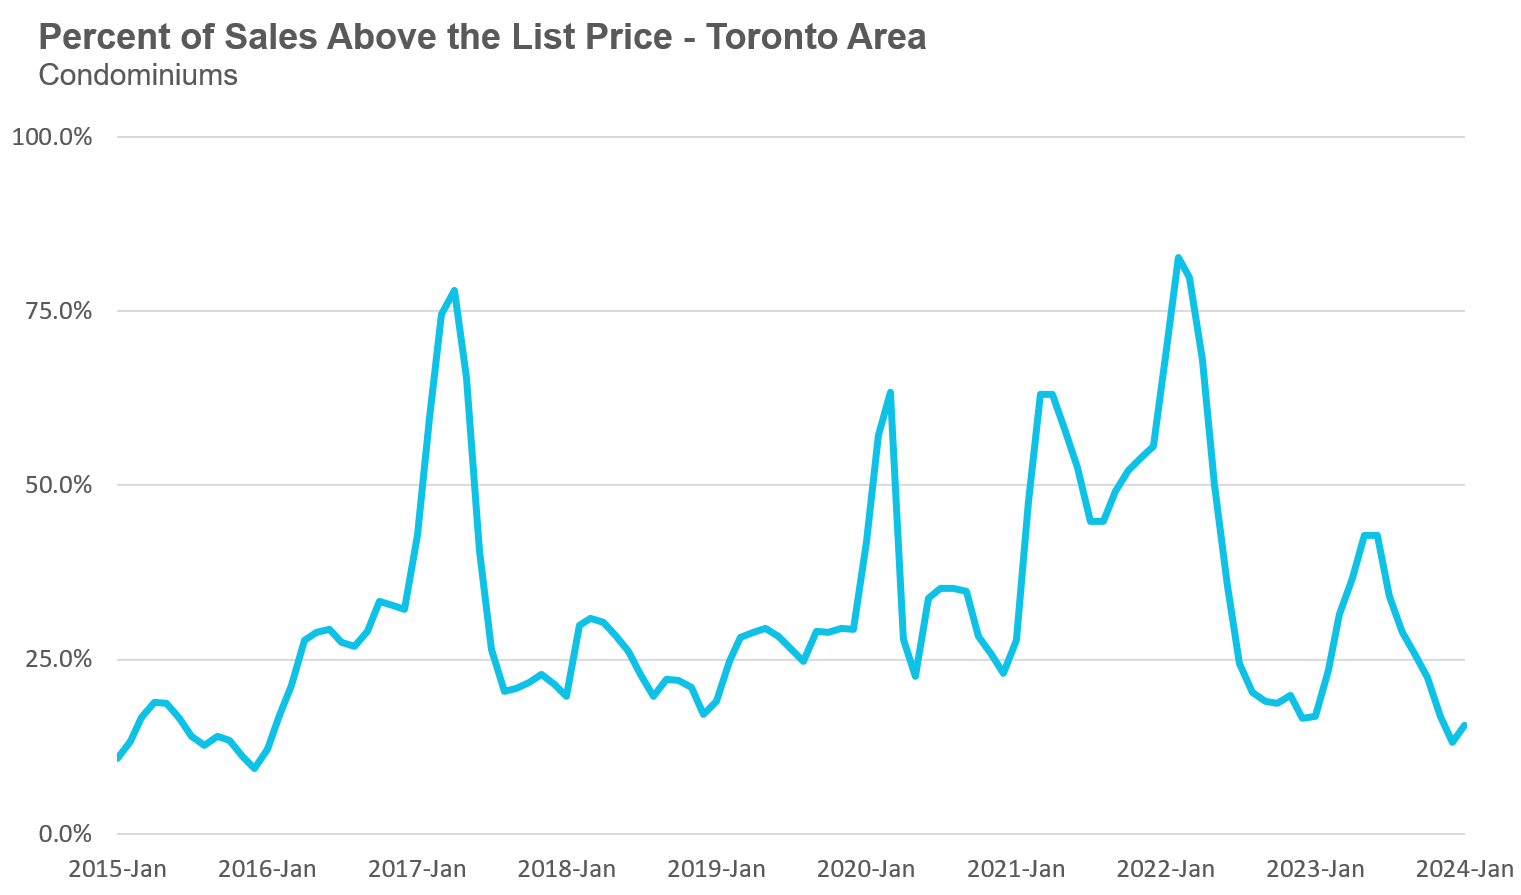
The share of condos selling for over the asking price increased to 16% in January.
The average price for a condo in January was $704,982, unchanged over last year. The median price for a condo in January was $633,000, down 1% over last year.
Regional Trends
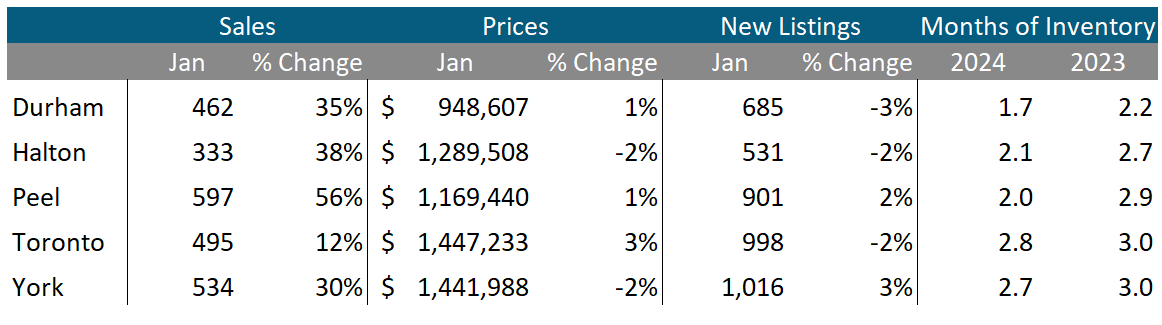
Houses
All five regions saw sales increases in January over last year. Peel saw the biggest increase in sales, up 56% over last year, while Toronto saw just a 12% increase. Three of the five regions saw new listings decline in January, while the MOI was down in all five regions over last year.
Average house prices were up in Durham, Peel and Toronto and down in York and Halton regions.
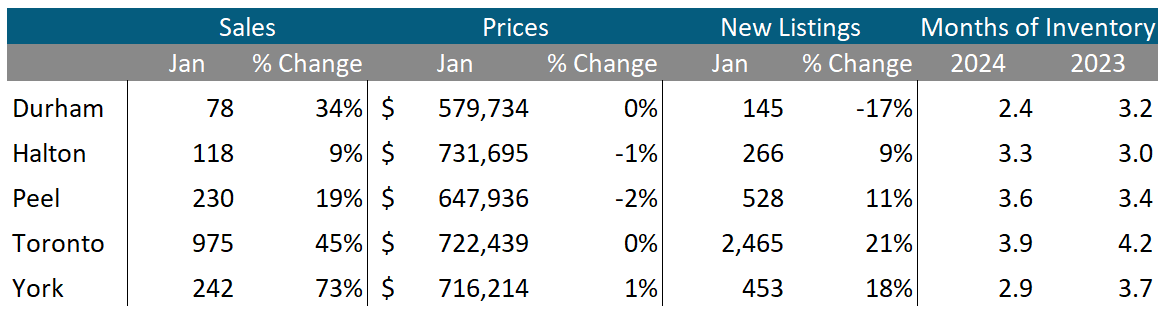
Condos
Condo sales were up in all five regions in January, with York seeing the biggest increase, up 73% over last year. Average prices were down in Halton and Pell, unchanged in Durham and Toronto and up slightly in York. The MOI is below last year’s level in Durham, Halton and York and up slightly in Halton and Peel.
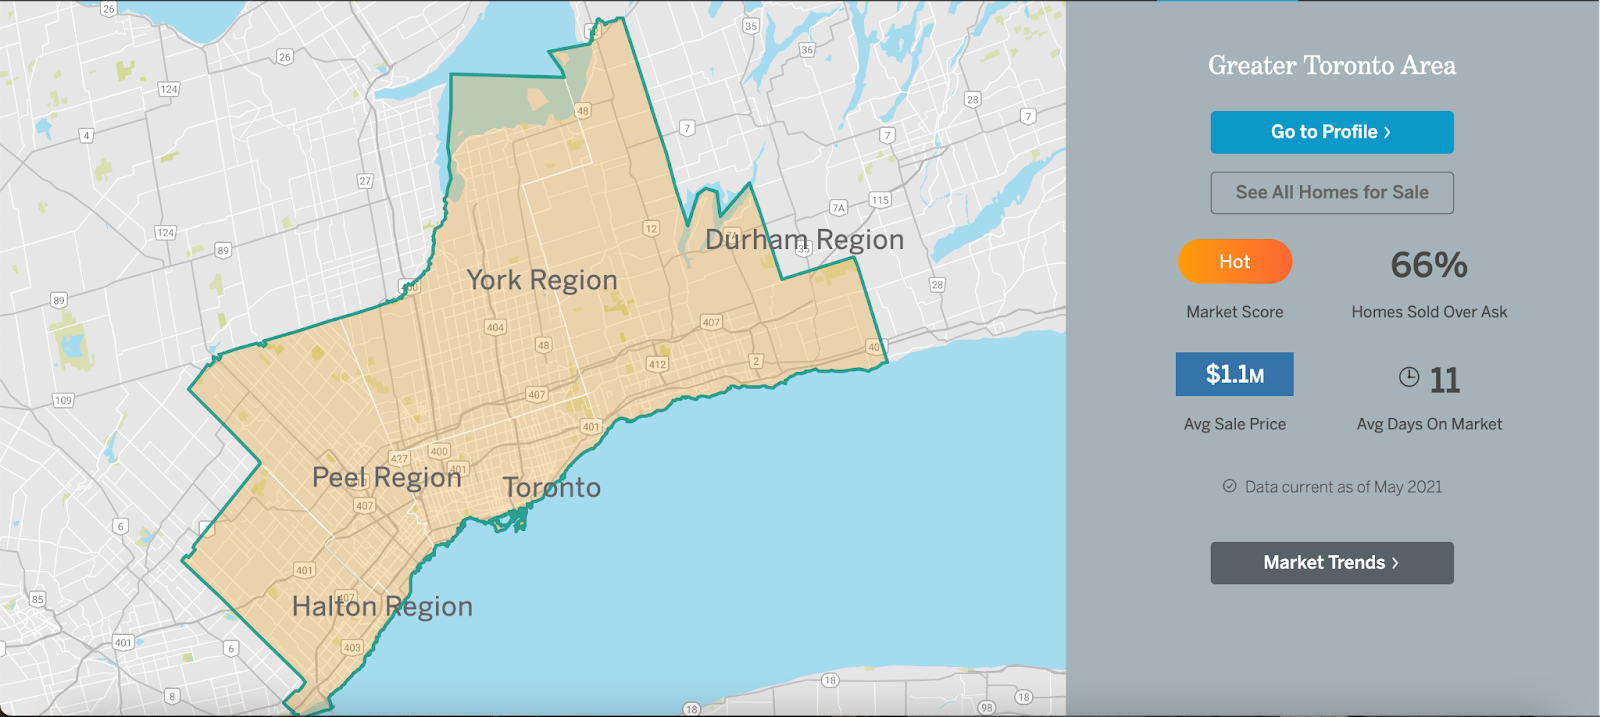
Browse Real-Time Market Trends on Movesmartly.com:
See Market Performance by Neighbourhood Map, All Toronto and the GTA
Greater Toronto Area Market Trends
Top Image Credit: Getty/iStock
John Pasalis is President of Realosophy Realty. A specialist in real estate data analysis, John’s research focuses on unlocking micro trends in the Greater Toronto Area real estate market. His research has been utilized by the Bank of Canada, the Canadian Mortgage and Housing Corporation (CMHC) and the International Monetary Fund (IMF).
Published: February 06, 2024


