Author John Pasalis is the President of Realosophy Realty, a Toronto real estate brokerage which uses data analysis to advise residential real estate buyers, sellers and investors. He is a top contributor at Move Smartly, a frequent commentator in the media and researcher cited by the Bank of Canada and others.

See John's Full Bio

Contact John 

Sections

1

The Market Now: New Listings On The Rise in Toronto Area Housing Market

2

Key Issue: Is Toronto in a Housing Bubble That's About to Burst?

3

Key Issue: Condo Rents Are Down - For How Long?

4

Monthly Statistics: February 2024

Get Our Monthly and Special Reports in Your Inbox.

LIVE MARKET UPDATE: WATCH REPORT HIGHLIGHTS & Q/A - THURSDAY MARCH 14th 12PM ET

Live Update - real 600 x 300 px

Join John Pasalis, report author, market analyst and President of Realosophy Realty, in a free monthly webinar as he discusses key highlights from this report, with added timely observations about new emerging issues, and answers your questions. A must see for well-informed Toronto area real estate consumers.

Sign Up Now >


WATCH NOW: John talks about the latest monthly numbers

The housing market in Toronto has showing mixed trends depending on the type of home one is considering buying or selling.

Low-rise houses around the $1M price range are seeing the most competition right now. The nicest and most renovated homes each week in this category are receiving multiple offers from buyers on their offer nights. Most sale prices are within a reasonable value range which is keeping a lid on any price growth for now.

Low-rise homes in the $2M+ price range are less competitive, but still moving. Some sellers in this category are pricing their properties below market value with the hope that they’ll receive multiple offers and land a price well above their list price, but in some cases, these offer night tactics are failing. When the seller fails to receive the price they want, they relist their property for a higher price that is inline with what they expect. 

The condominium (condo) market is the slowest segment of the housing market right now, in part due to the relatively high volume of active listings. But demand remains relatively strong, with four out of the five regions in the GTA seeing a double-digit increase in condo sales over last year.


By the Numbers: February 2024

The average price for a house in the Toronto area was $1,358,959 in February, unchanged over the same month last year. Last month's median house price was $1,200,000, up 2% over last year.

House sales in February were up 26% over last year, while new house listings were up 35%. 

The number of houses available for sale at the end of the month, or active listings, was up 36% over last year. 

The current balance between supply and demand is reflected in the MOI, which is a measure of inventory relative to the number of sales each month. 

In February, the MOI for houses fell to 1.9.

The average price for a condo in the Toronto Area was $726,379 in February, which is unchanged over last year. The median price for a condo in February was $660,000, up 2% over last year.

Condo sales in February were up 19% over last year, and new condo listings were up 36% over last year. The number of active condo listings was up 41% over last year. The MOI decreased slightly to 3.2. 

WATCH NOW: John talks about Toronto home price bubble concerns

Every year, I have the pleasure of meeting with a panel of economists from the IMF to discuss my research on Toronto's housing market, including potential vulnerabilities. While there is a lot to be concerned about when it comes to Toronto's housing market, the one risk that has not been on my radar for the past couple of years is the risk of a deep and sustained decline in house prices, like the one we saw when the US housing bubble collapsed in the early 2000s.

I mention this because this is often one of the biggest questions and concerns I hear about Toronto's housing market. While home prices are certainly high in Toronto, it's important to remember that high home prices alone do not define a housing bubble.

Let's consider how economist Robert Shiller defines a housing bubble.

"A situation in which news of price increases spurs investor enthusiasm which spreads by psychological contagion from person to person, in the process amplifying stories that might justify the price increase and bringing in a larger and larger class of investors, who, despite doubts about the real value of the investment, are drawn to it partly through envy of others' successes and partly through a gambler's excitement."

Housing bubbles are a behavioural phenomenon where home prices rise rapidly due to an irrational exuberance in the market and a fear of missing out. 

Toronto's housing market experienced two bubble periods in the recent past.
In 2016 and early 2017, the Toronto area saw a rapid acceleration in house prices, peaking in March 2017 when home prices rose by 33%/year. While many economists and real estate insiders blamed the rapid boom in home prices on a lack of supply due to "government-imposed barriers," I published a report showing that the boom in prices was driven by a surge in investors buying low-rise homes in the Toronto area's suburban markets, York Region in particular. 

Then, in April 2017, prices began to decline rapidly, eventually falling 20% from their peak. 

In my February 2021 report, I discussed the second housing bubble that occurred during COVID and eventually peaked in early 2022 before prices fell by just over 20% from the peak. 

What made those two periods different from today? Firstly, home prices were appreciating rapidly, and secondly, the rapid appreciation was driven by an irrational exuberance from investors and from home buyers who were driven by the fear of missing out. Home prices in the Toronto area are not rising rapidly, and there is no exuberance among buyers, which means today's market can't be defined as a bubble. 

But it's important to note that just because Toronto's housing market is not currently in a bubble doesn't mean home prices cannot fall in the future. It just means that if prices fall, the reasons and the factors driving the decline will be very different from what we might expect when a housing bubble bursts. 

Housing bubbles typically burst when the market sentiment shifts from overly optimistic to overly pessimistic - and the shift is often very sudden. When Toronto's housing bubbles burst in 2017 and 2022, the shift in the market sentiment was very rapid, and this contributed to the sudden and sharp decline in house prices that followed. 

When a market is not in the middle of a housing bubble, a decline in home prices is often driven by more traditional economic factors, like a recession that leads to job losses and possibly households needing to sell their home. The factors that might lead to a price decline in these scenarios typically unfold more gradually than a bubble bursting. 

Another concern among housing economists is how the housing market will adjust to high debt levels and high interest rates. If higher interest rates begin to weigh on household finances in a way that might negatively impact house prices, this shift is more likely to be a gradual one rather than a sudden shift in the market. 

In short, if you're worried about a future decline in Toronto's housing market, a sudden decline in home prices like what we saw in 2017 and 2022 when market sentiment shifted, causing those bubbles to burst, is less likely to happen today. In today's market, you want to be more mindful of the economic factors that might weigh on household finances and how those factors are changing over time since this is more likely to impact housing in the near future. 

WATCH NOW: John explains how GTA condo rents are down

The average rent for a condominium in the Greater Toronto Area has declined from a record high of $2,986/m in August 2023 to $2,780 in January 2024, a 7% drop in just 5 months.

While it is typical for rents to dip slightly during the winter months when demand is typically the lowest for new rentals, the decline we have seen this year is greater than what we would expect from seasonal factors. 

The biggest driver of the decline in condominium rentals is a surge in new rental listings, which was caused by an above-average number of condominiums being completed during the second half of 2023.

The chart below shows the number of condominium completions in the Toronto area during the third and fourth quarters of each year. The Toronto area typically has just over 8,000 new condo completions during the second half of the year. In 2023, the number of completions was double that at 16,242. 

2_CondoCompletions

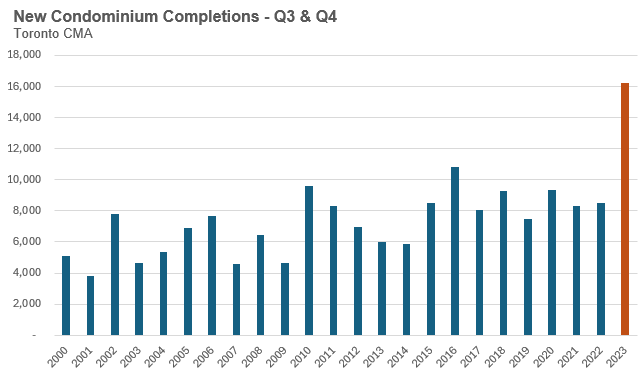
Since the majority of new condominium units are purchased by investors, this lead to a surge in the number of units listed for lease. The chart below compares the change in the number of new rental listings during the second half of 2023 against the second half of 2022. 

3_ChangeInRentalListings

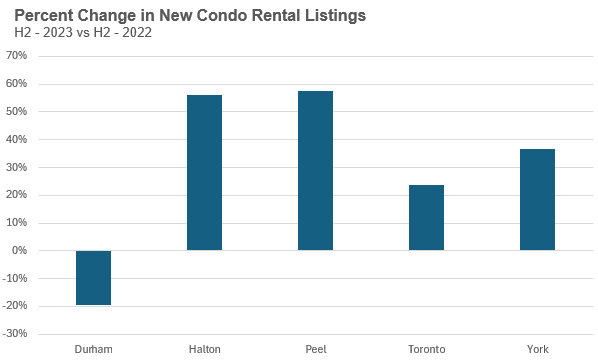
In all regions, the number of condominium units that were leased during the second half of 2023 was up compared to the same period in 2022. But even though the demand for rentals is up, the volume of rental listings exceeded it.

5_ChangeLeasedCondos

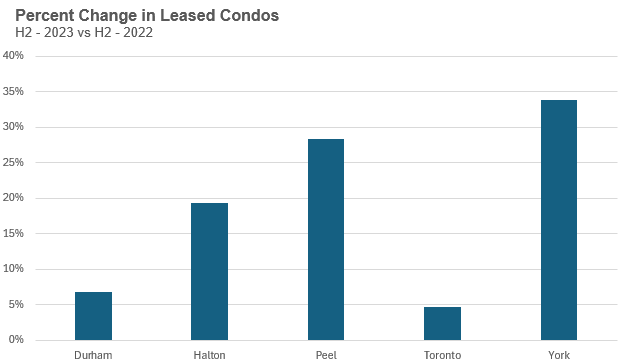
When we compare the number of active condo rental listings in January 2024 vs January 2023, we can see that the numbers have doubled in Halton and Peel and nearly doubled in Toronto.

6_ChangeInActiveListings

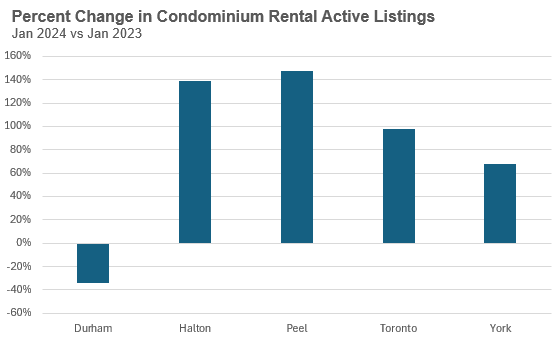
Not surprisingly, the regions with the biggest increase in active listings have also seen the biggest decline in average prices. The chart below compares the change in average price at the start of the third quarter of 2023 (July) against January 2024. 

7_ChangeinAvgCondoRent

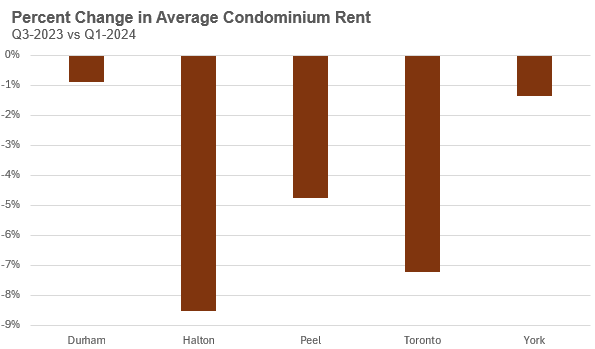
On a year-over-year basis, average rents are relatively similar to the same time last year, but a year-over-year comparison misses the fact that rents are down from their peak last summer. 

And the supply shock we are seeing in the condo rental market will likely get worse in 2024 since a record 17,918 units are scheduled to be completed during the first six months of the year according to condo research firm Urbanation.

Where prices will go with depend on how long it takes the market to absorb all of this additional supply.

House Statistics

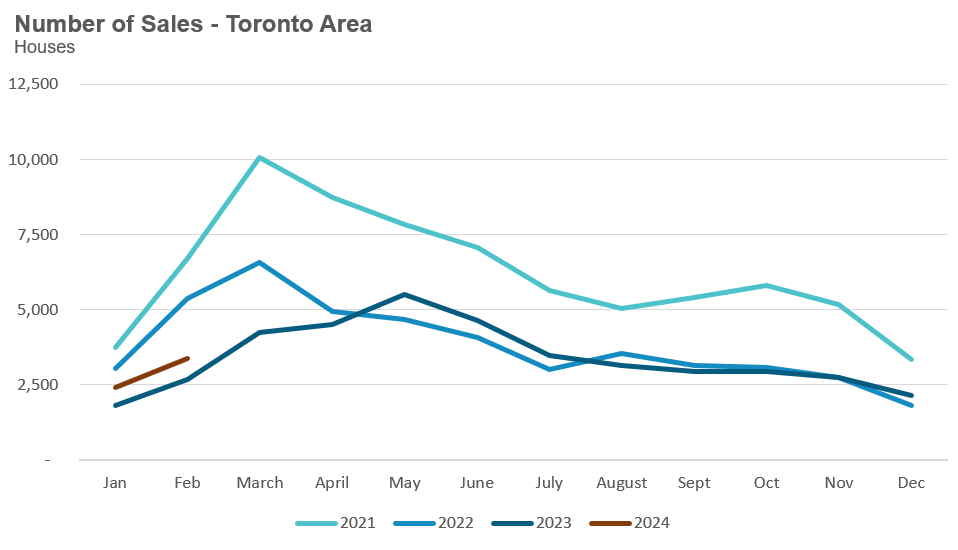
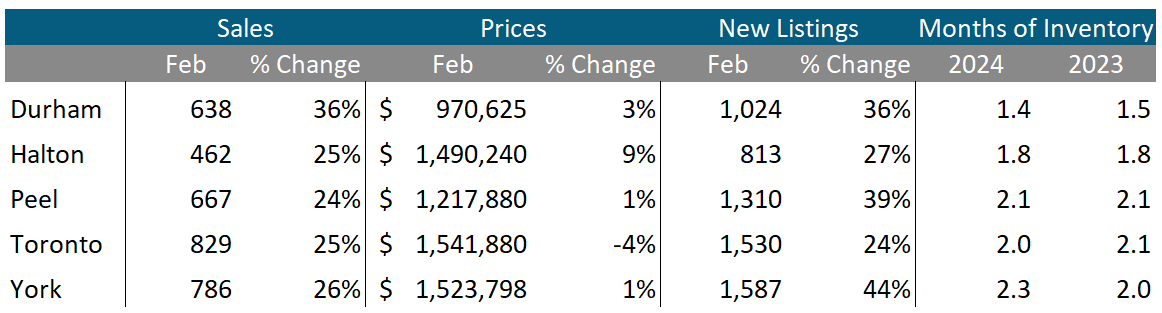
House sales (low-rise freehold detached, semi-detached, townhouse, etc.) in the Greater Toronto Area (GTA) in February 2024 were up 26% compared to the same month last year.


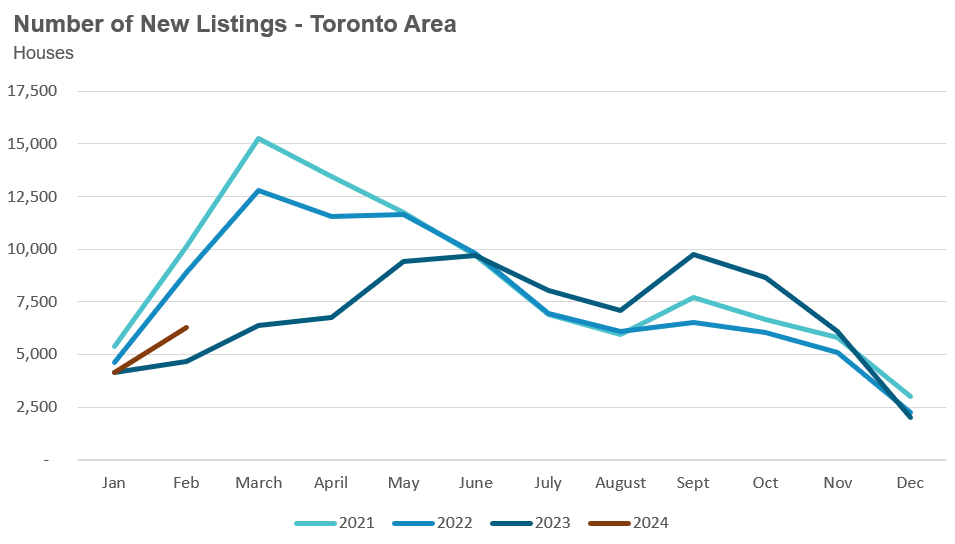
New house listings in February were 35% compared to last year.


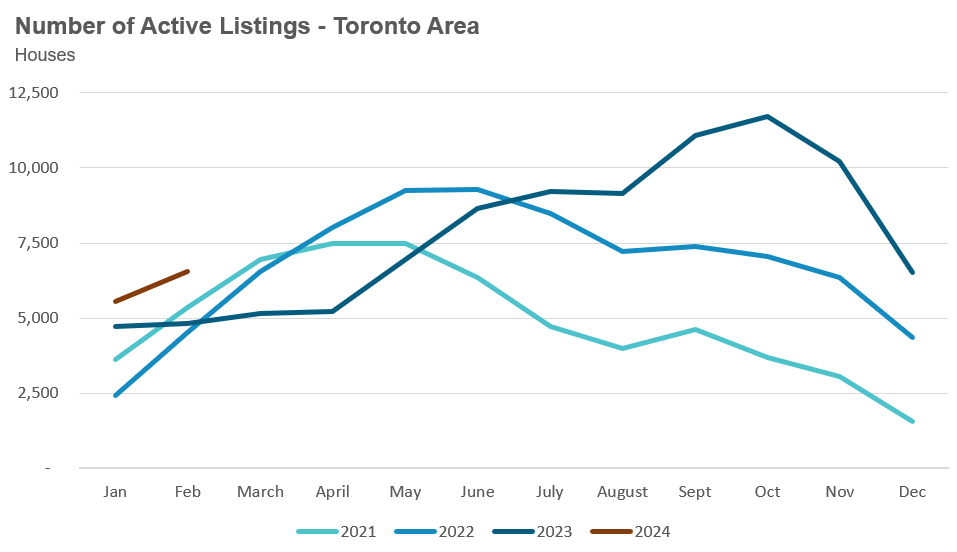
The number of houses available for sale (“active listings”) was up 36% in February compared to the same month last year.


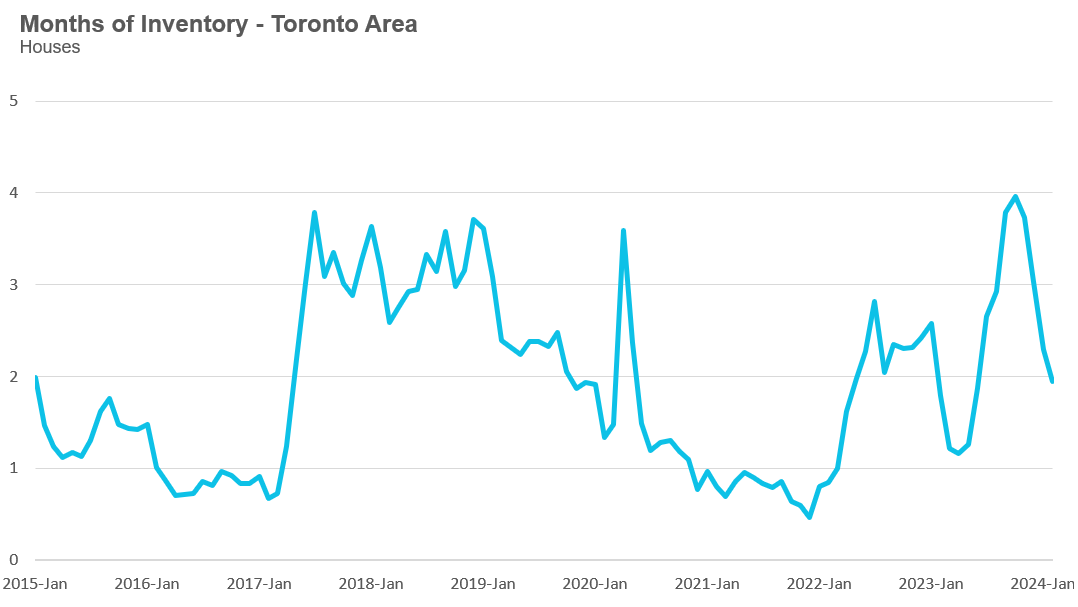
The Months of Inventory ratio (MOI) looks at the number of homes available for sale in a given month divided by the number of homes sold in that month. It answers the following question: If no more homes came on the market for sale, how long would it take for all the existing homes on the market to sell, given the current level of demand? The higher the MOI, the cooler the market is. A balanced market (a market where prices are neither rising nor falling) is one where MOI is between four to six months. The lower the MOI, the more rapidly we would expect prices to rise.  

While the current level of MOI gives us clues into how competitive the market is on-the-ground today, the direction it is moving in also gives us some clues into where the market may be heading. 

The MOI for houses dipped to 1.9 in February, down from 4 MOI in October. 


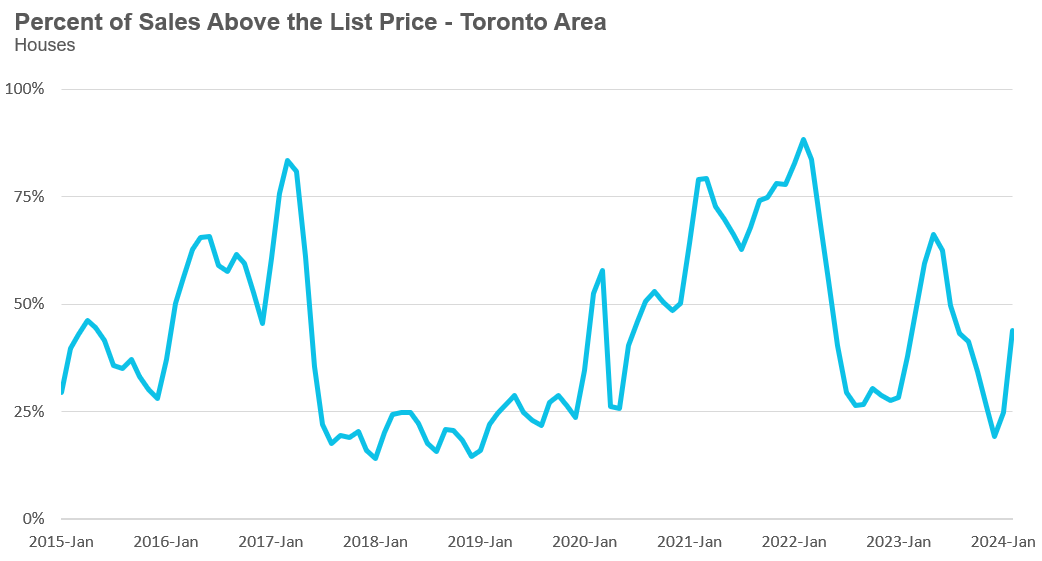
The share of houses selling for more than the owner’s list price increased to 44% in February.


The average price for a house in February was $1,358,959 in February 2024, unchanged compared to the same month last year.


The median house price in February was $1,200,000, up 2% over last year.

The median is calculated by ordering all the sale prices in a given month and then selecting the price at the midpoint of that list such that half of all home sales are above that price and half are below that price. Economists often prefer the median price over the average because it is less sensitive to big increases in the sale of high-end or low-end homes in a given month which can skew the average price. 


Condo Statistics

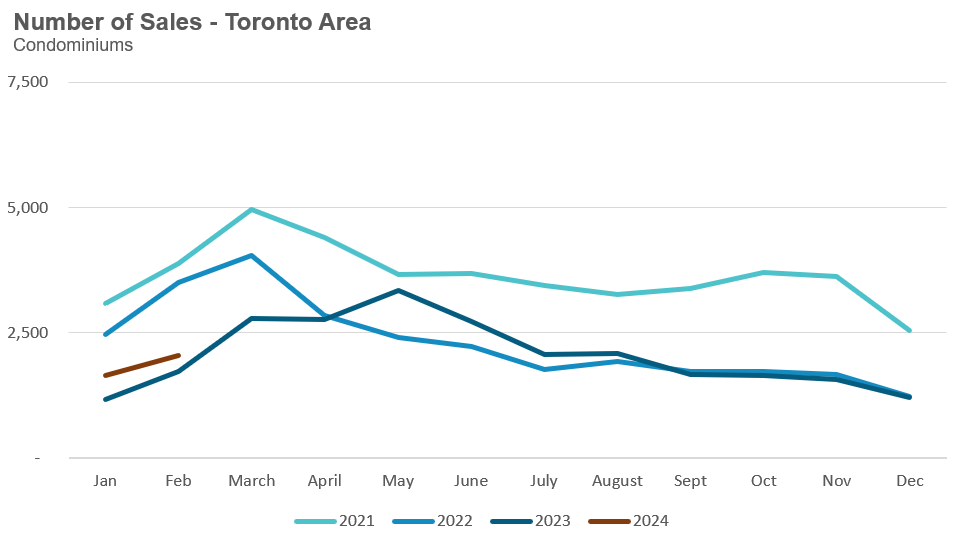
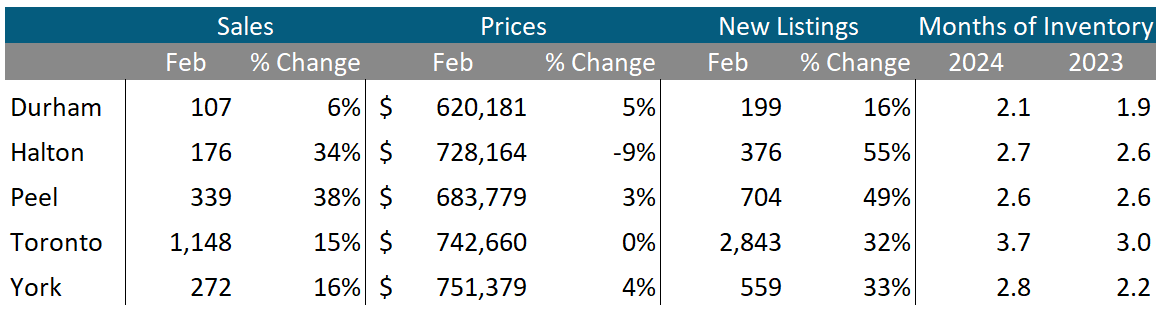
Condo (condominiums, including condo apartments, condo townhouses, etc.) sales in the Toronto area in February 2024 were up 19% over the same month last year.


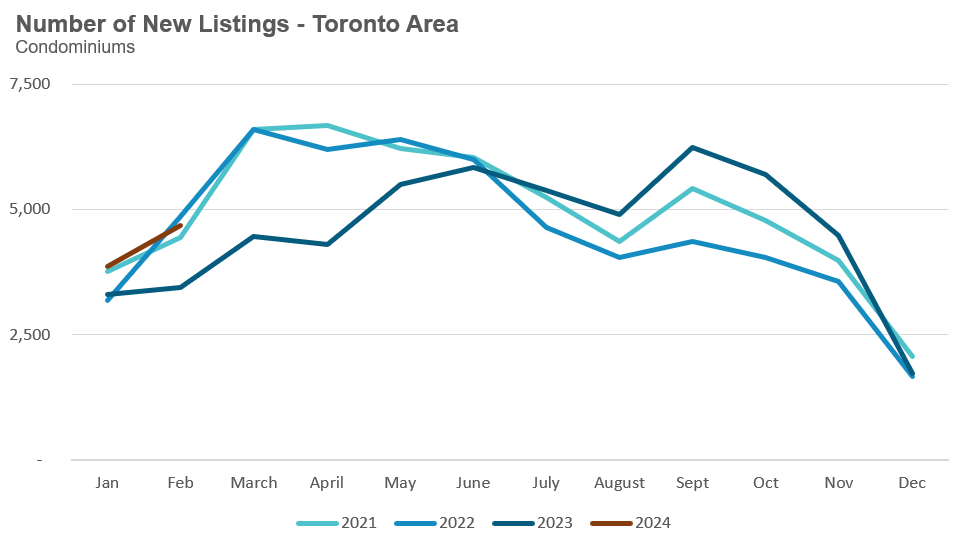
New condo listings were up 36% in February over last year.


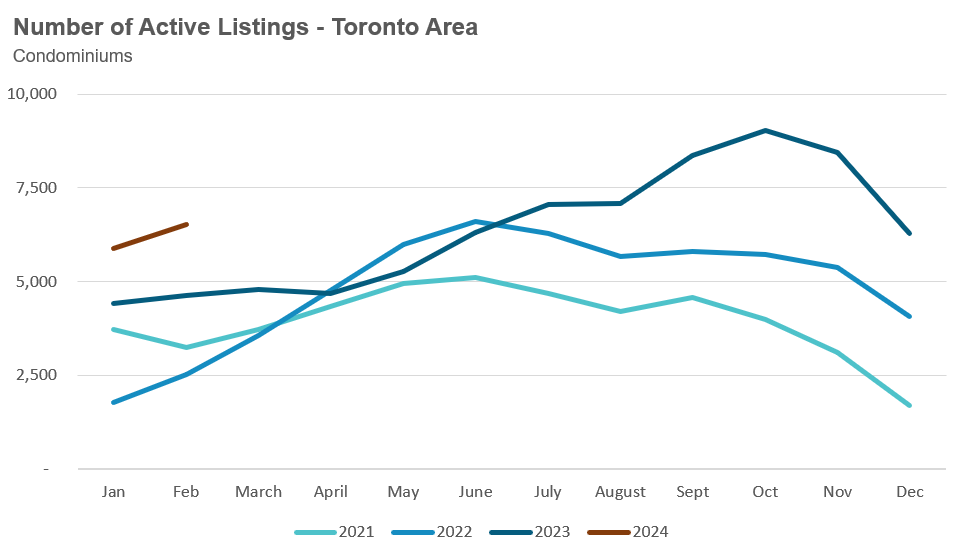
The number of condos available for sale at the end of the month, or active listings, was up 41% over last year.


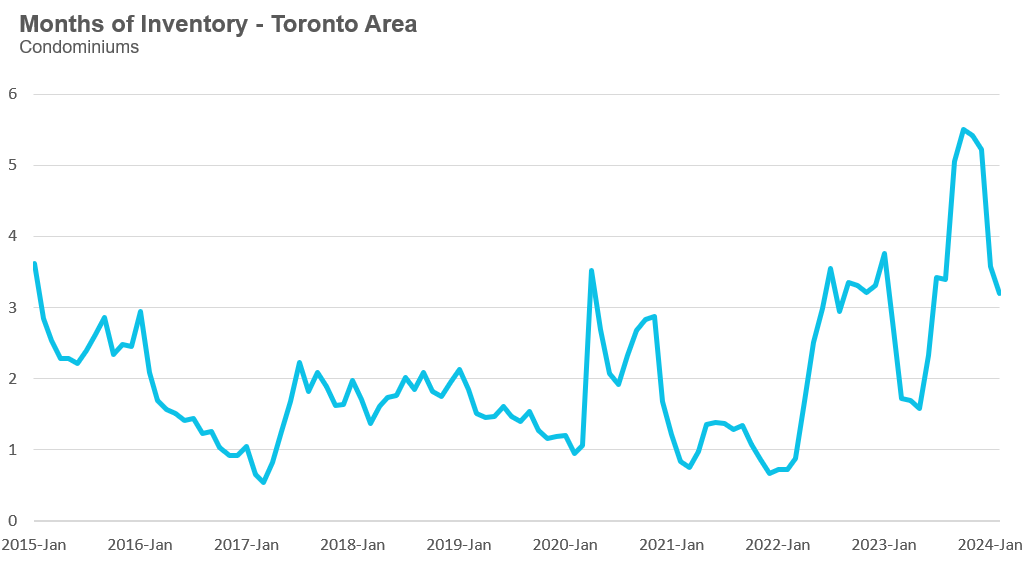
Condo months of inventory decreased slightly to 3.2 MOI in February. 


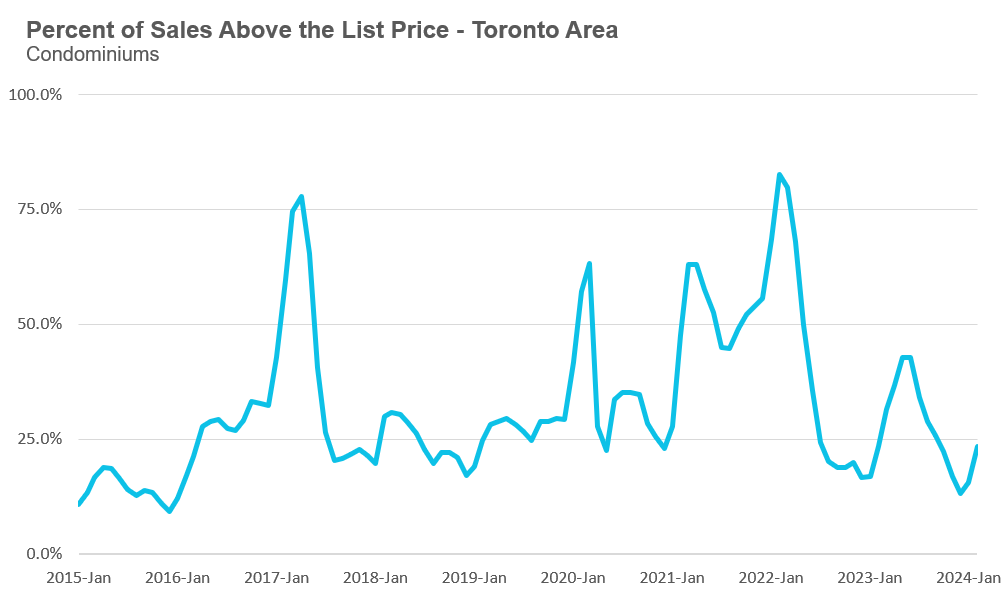
The share of condos selling for over the asking price increased to 23% in February.


The average price for a condo in February was $726,379, unchanged over last year. The median price for a condo in February was $660,000, up 2% over last year.


Regional Trends

Houses 

All five regions saw sales increases by over 20% in February over last year. Halton saw average prices increase by 9%, while Toronto saw prices dip by 4% in February. All five regions saw significant increases in new listings in February, while the MOI was similar to last year. 

Condos

Condo sales were up in all five regions in February, with Peel seeing the biggest increase, up 38% over last year. Average prices were down in Halton, unchanged in Toronto and up slightly in Durham, Peel and York. The MOI is above last year’s for most regions.


Book a Consult with John Pasalis & Realosophy Realty

Have more specific questions about your own real estate decisions? Book a no-obligation consultation

Learn more at https://www.movesmartly.com/meetjohn