

The big news in the housing market last month was surging interest rates.
We’ve been hearing over the past few months that the Bank of Canada planned to raise interest rates this year to fight Canada’s high inflation rate.
The Bank of Canada raised their policy rate in April from 0.5% to 1% with the expectation that the Bank’s policy rate would eventually reach 2.5% to 3% by next year.
While the Bank of Canada’s policy interest rate drives the interest rate for variable rate mortgages, the interest rate for five-year fixed mortgages is driven by the bond market.
In March, 5-year bond yields surged more than 100 basis points, or a full 1% in a single month which pushed 5-year mortgage rates to just under 4% in early April, a significant increase from the start of the year when buyers were paying roughly 2.5% for a five-year mortgage.
After years of low interest rates, how will higher interest rates impact Toronto’s housing market?
In response to a question on Twitter asking how much home prices will fall if the Bank of Canada’s policy rate reaches 3%, one economist’s response stood out for being significantly more optimistic than my outlook, and the outlook of most people in the real estate and mortgage industry who I speak with.
Many of the macroeconomic factors that Brett, who was up to recently, Deputy Chief Economist at Scotiabank, highlighted are important if one’s primary short-term concern is that we may see distressed homeowners rushing to sell their homes and/or defaulting on their mortgages.
I don’t see that as a material risk.
The bigger risk to home prices, at least from my perspective, is that tomorrow's home buyers are going to have a much harder time paying today’s prices if they’re paying 5% on their mortgage compared to the low 2% range just a few months ago, and the high 1% range a year ago.
I’ve seen some people argue that this isn’t a real concern because home buyers have been qualifying for a mortgage at the stress test rate of 5.25% which suggests that households can afford mortgage rates in the 5% range.
But I think this is an oversimplification of the problem tomorrow’s home buyers will be facing.
Firstly, rising interest rates will impact how much debt buyers will qualify to borrow. The stress test used to qualify a borrower is the greater of the buyer's actual mortgage rate plus 2% or the benchmark rate which is currently 5.25%. As these are dynamic measures that will change as rates do, the stress test will also increase which will reduce the amount of debt a buyer can take on.
And while the stress test impacts how much buyers qualify to borrow, it is the actual contract rate which determines the monthly mortgage payment amount that buyers are ultimately comfortable borrowing.
A buyer who qualifies for a $1M mortgage may be willing to take on that much debt when interest rates are 1.75% but less so when rates are 4% because under the higher rate their actual mortgage payment would be roughly $1,100 per month higher.
I believe the key issue here is two-fold: In addition to the size of the interest rate changes the housing market will need to absorb is the issue of how quickly these changes happen.
In general, real estate markets tend to prefer slow and steady changes vs. sudden shocks. Mortgage interest rates doubling in just months is a shock and time will tell how the market adjusts to this higher interest rate environment.
If interest rates continue to trend up, I would not be surprised if we see some downward pressure on home prices over the next 9 to 18 months due to home buyers being unwilling or unable to pay today’s prices at tomorrow’s higher interest rates.
That being said, if we do see a decline in prices I do agree with Brett that it would likely be a temporary one due to long-term fundamental factors that have been contributing to rising home prices in the Toronto area.
In last month's report, I discussed some on-the-ground signs that Toronto’s real estate market was starting to slow down ahead of what the numbers were showing.
This month, I’m going to put some numbers to these trends.
While we typically analyze housing data monthly, when the market is changing quickly a monthly analysis can mask some of the more real time trends in the market. For this reason, it can be helpful to analyze housing statistics on a weekly basis to better understand how the market is changing.
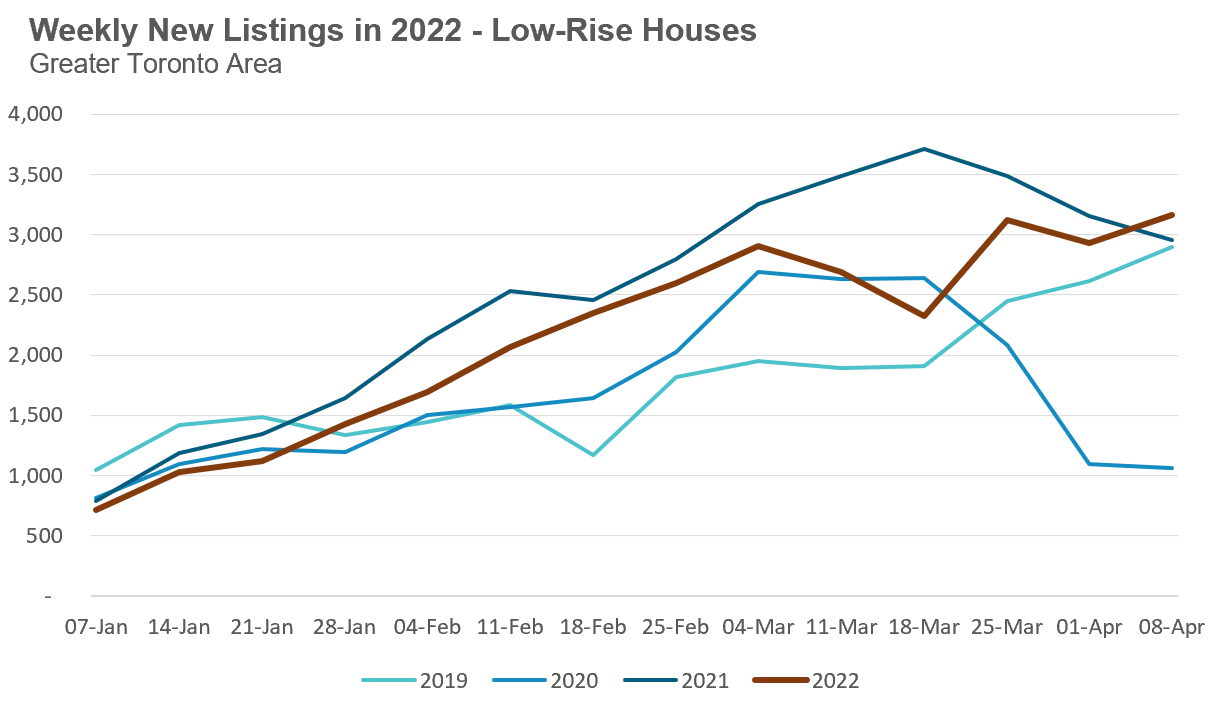
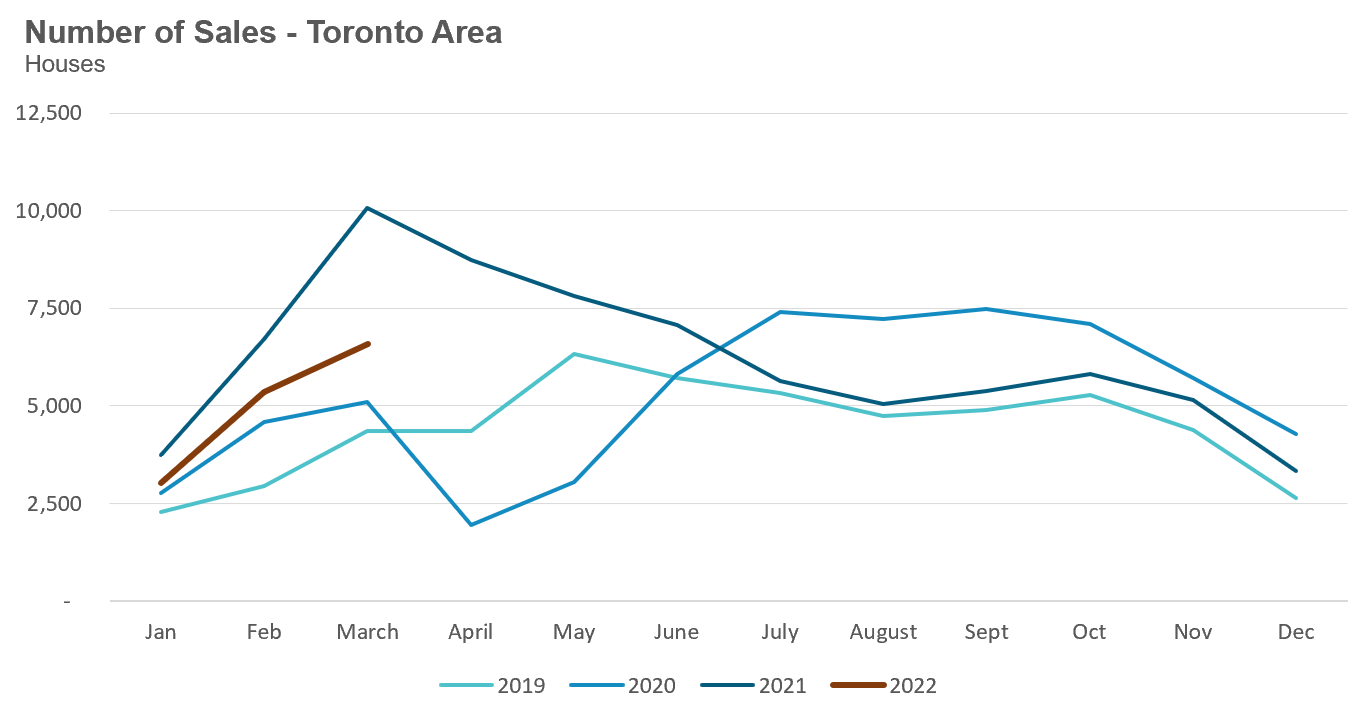
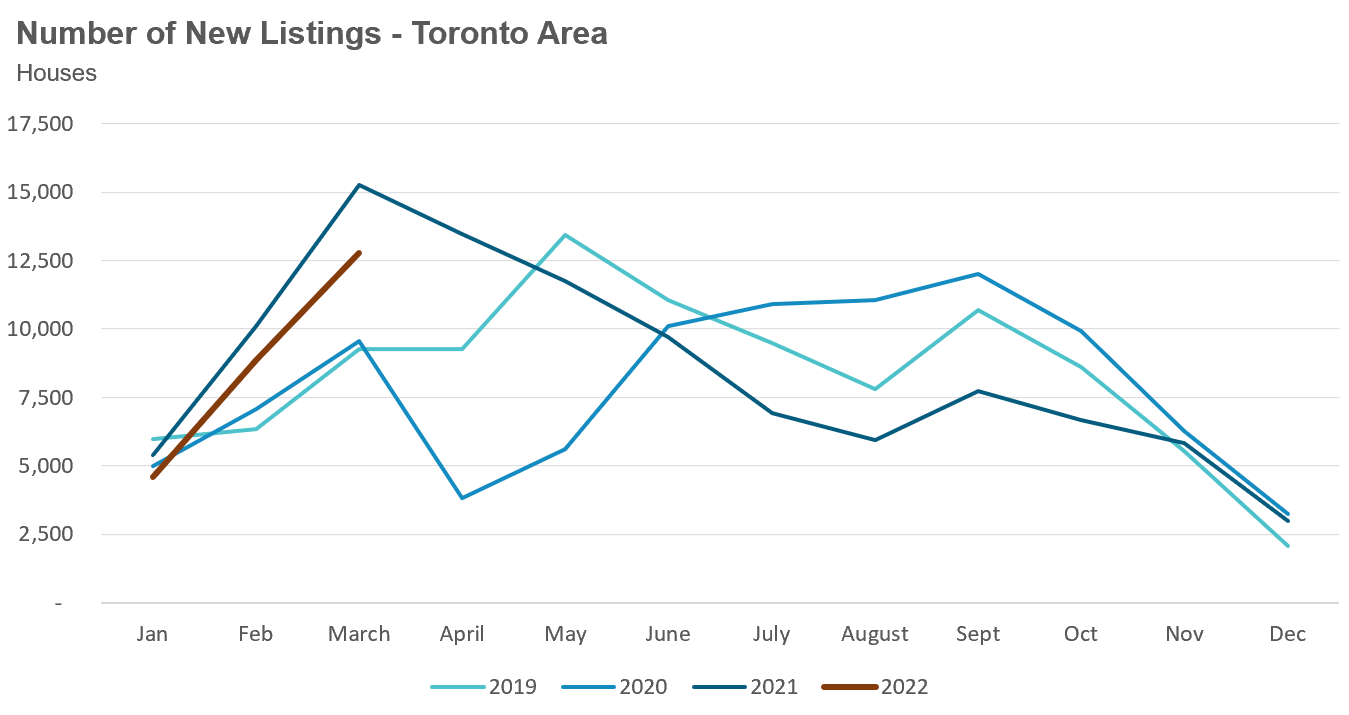
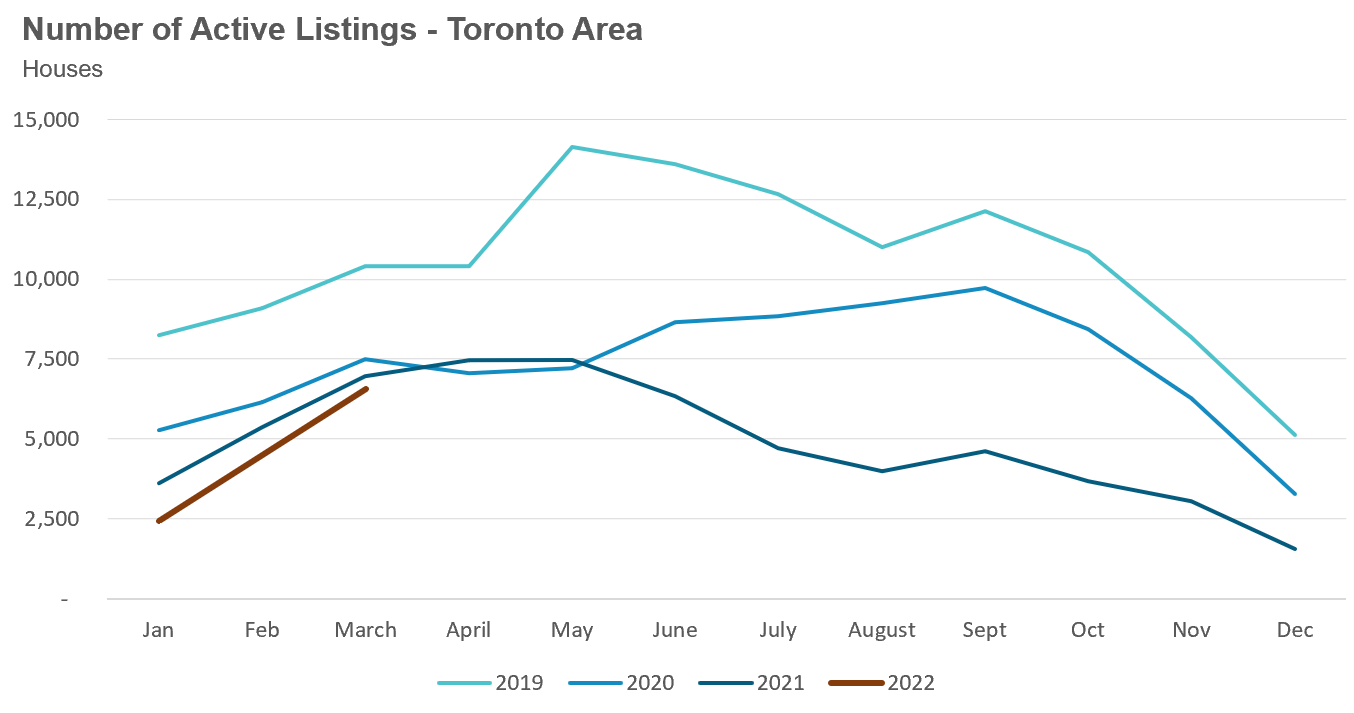
The charts below show weekly statistics for the Greater Toronto Area’s housing market for each of the past four years. It’s worth noting that year-over-year comparisons might be a little misleading, in particular when comparing this year against 2020 and 2021. In March 2020, the province of Ontario went into its first Covid-19 pandemic lockdown which caused home sales and new listings to fall dramatically. In March 2021, the housing market saw a sudden surge in demand and listings that was well above any previous period. Given these special circumstances, 2019 is a good comparison for a more typical pre-Covid housing market.
When looking at the number of sales of low-rise homes, we found that sales this year have actually been declining since the start of March. This is not a typical trend. As we can see in 2019, sales typically increase as we move toward the busy spring market.
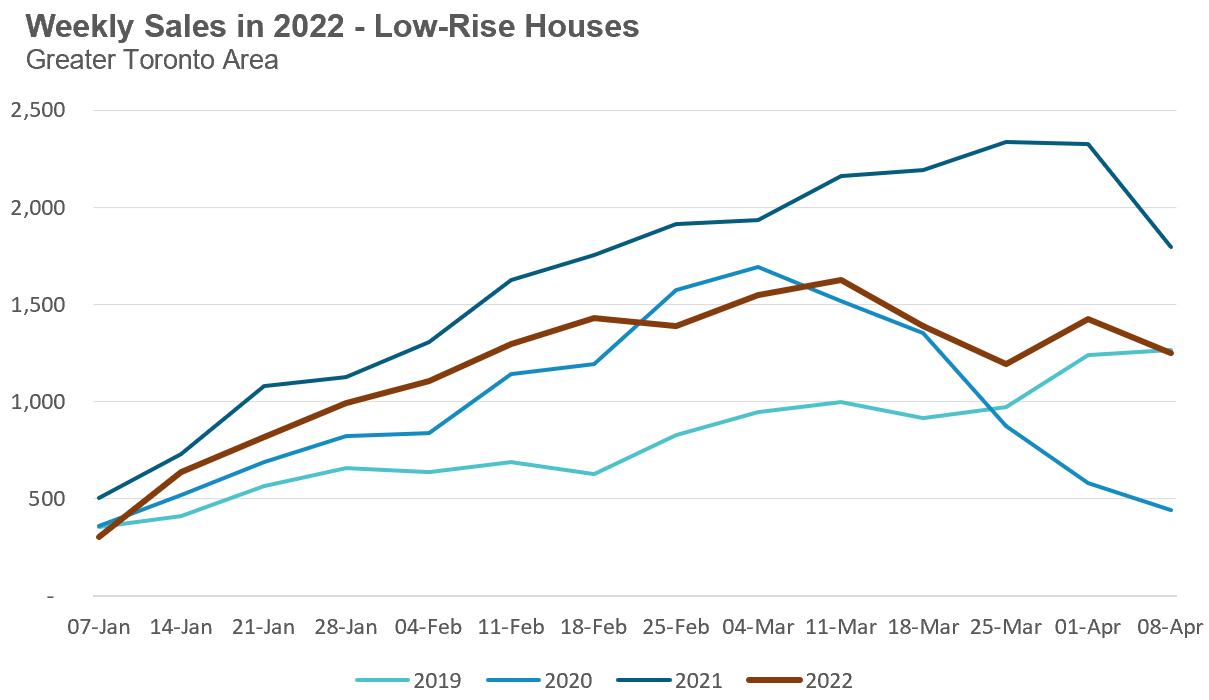
Even though sales in 2022 were well ahead of 2019 volumes, we can see that sales volumes during the first couple of weeks of April have returned to 2019 levels.
We can also see that the number of new listings coming on the market for sale is also very strong and well ahead of the typical volumes in 2019.
The most interesting trend in the low-rise market is the decline in average prices after peaking in mid February at just under $1.7M. Prices have plateaued the past four weeks around the $1.55M range.
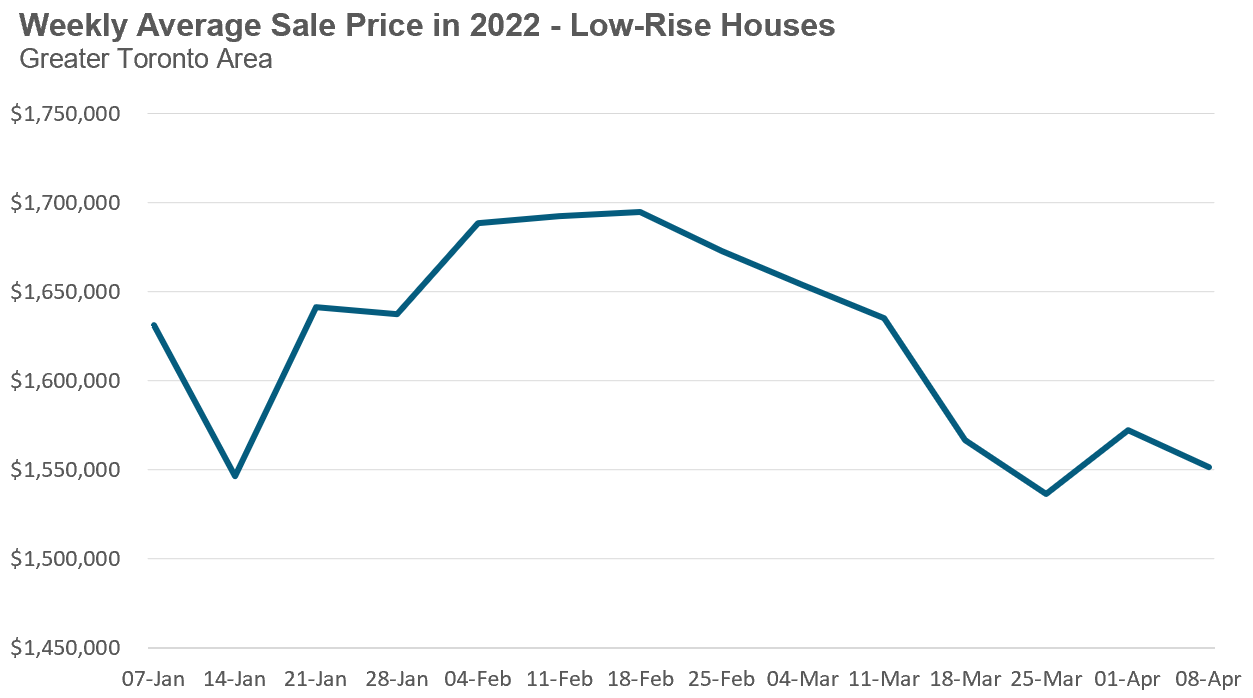
It’s difficult to explain this sudden decline in average prices. This decline is not due to proportionately more homes selling in more affordable regions like Durham Region and fewer homes selling in high priced Toronto.
On the ground, we are seeing some homes selling for less than what they would have sold for in February and this is likely contributing to the decline in average prices although cannot explain this entire decline.
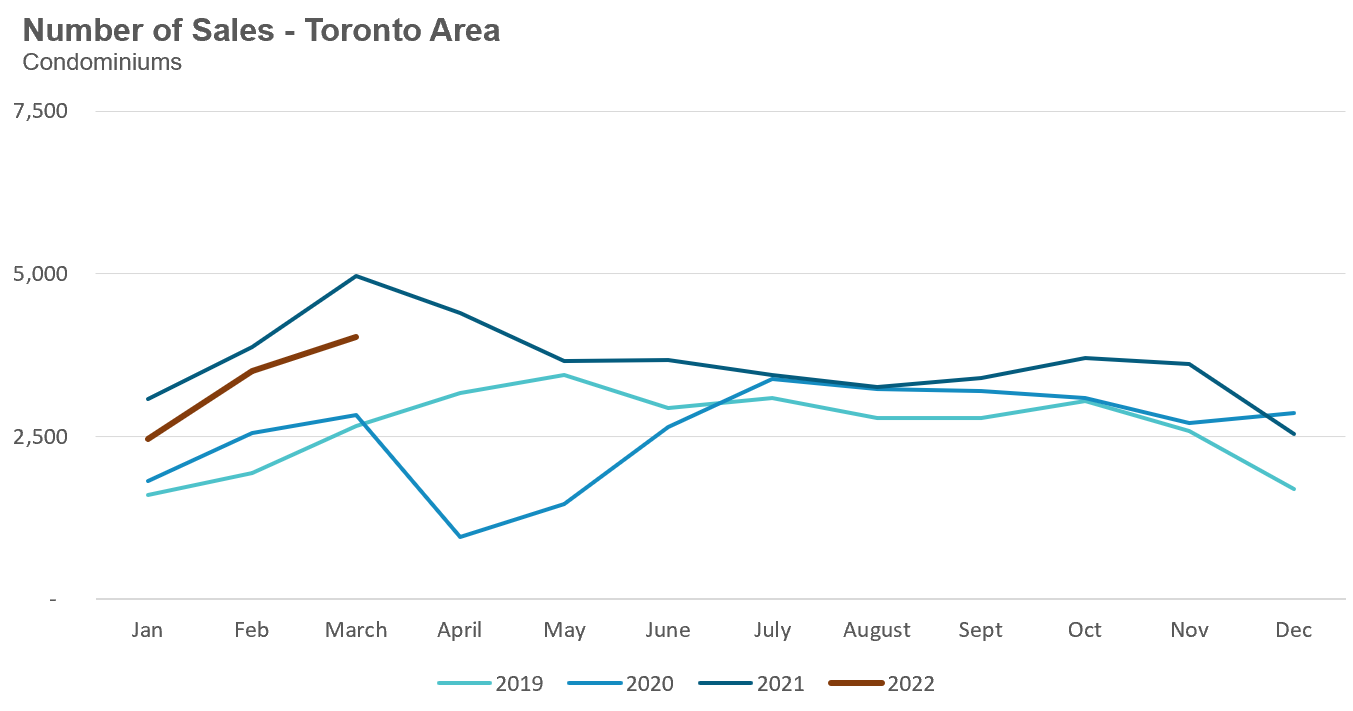
Turning to the condo market, we see that condo sales have also been declining since early March and are approaching 2019 levels.
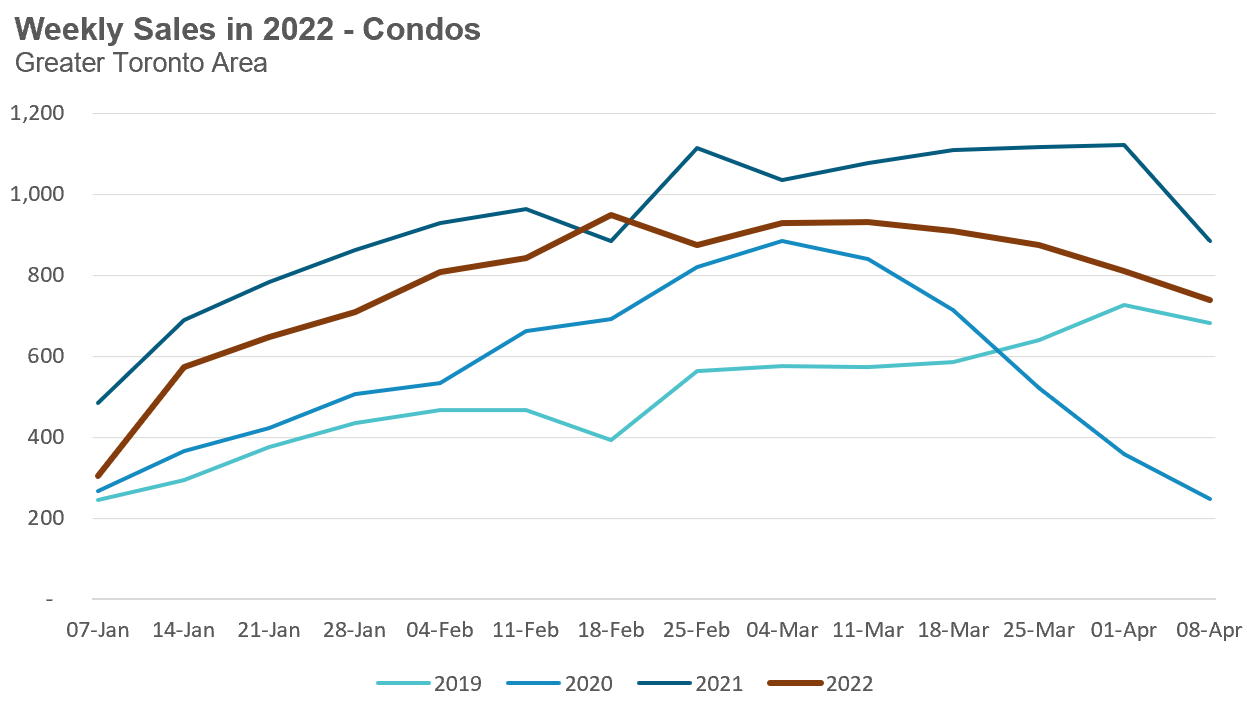
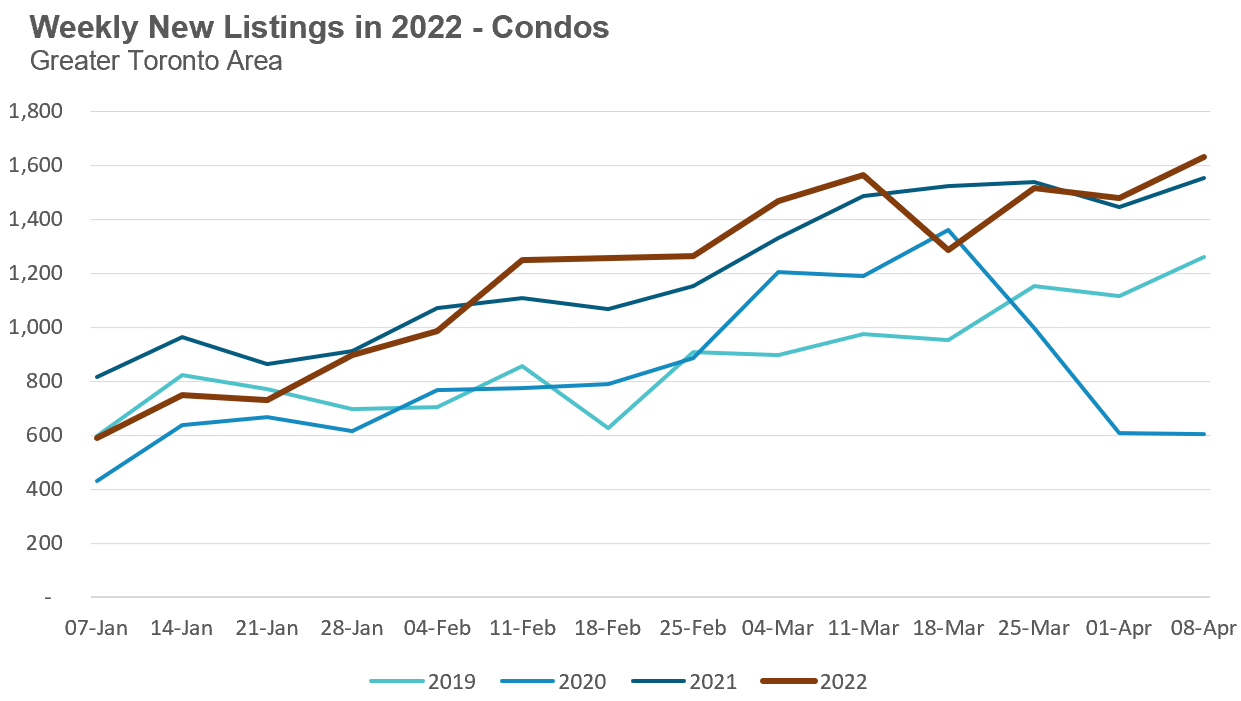
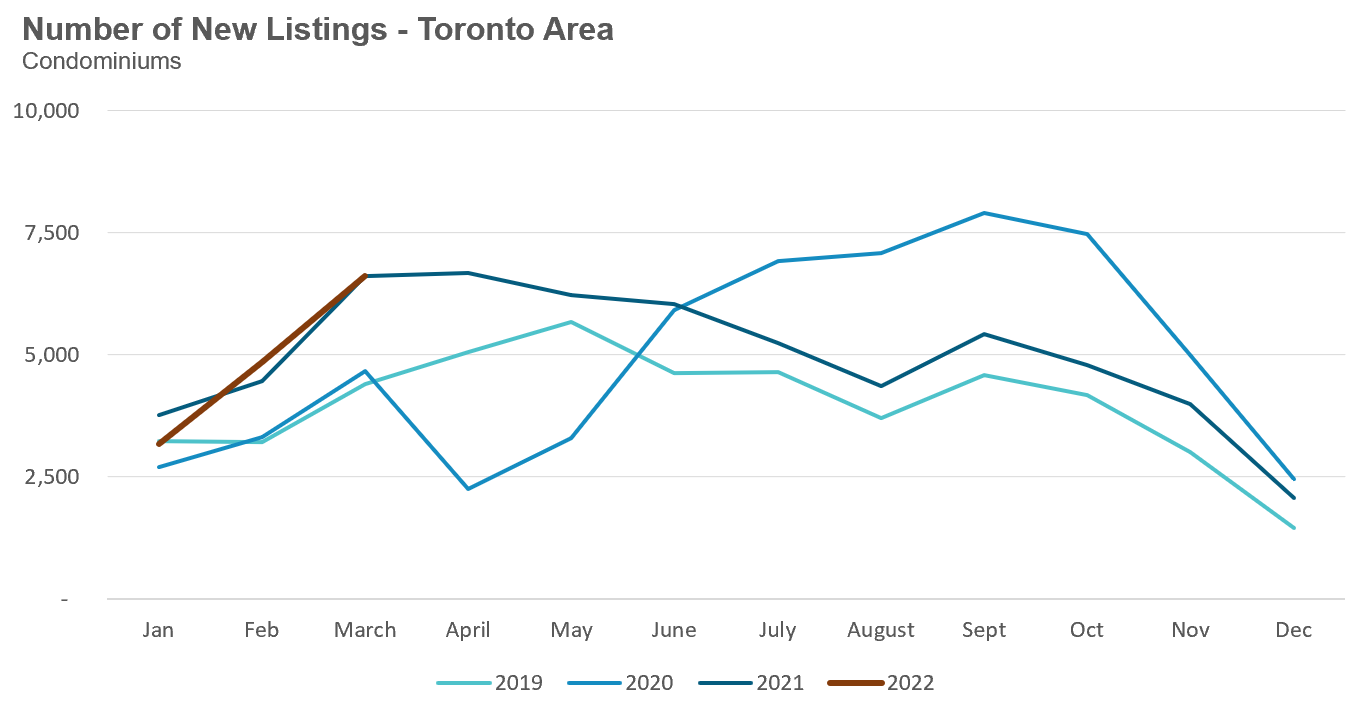
Much like the low-rise market, new listings are also strong and ahead of volumes over the previous three years.
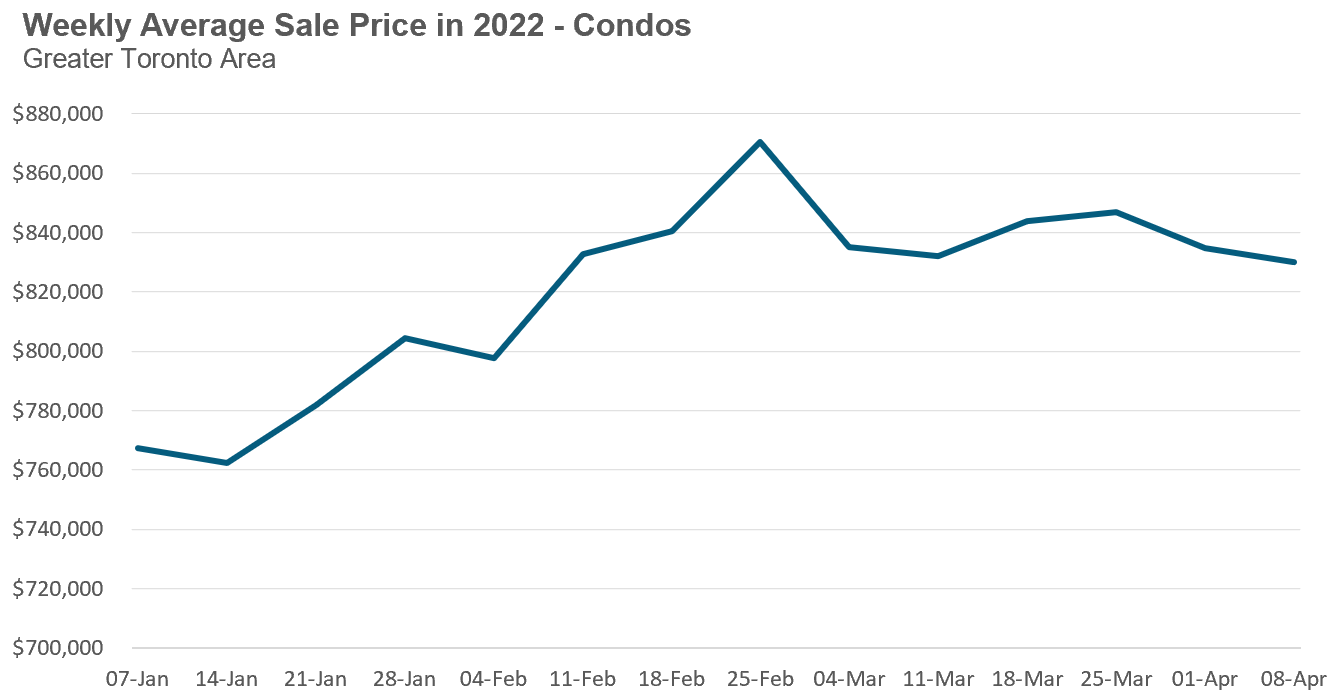
But condo prices are not seeing the same downward trend that low-rise homes are. We can’t put too much emphasis on the peak price reached in late February since it’s just one week’s worth of data and may have been influenced by an outlying sale.
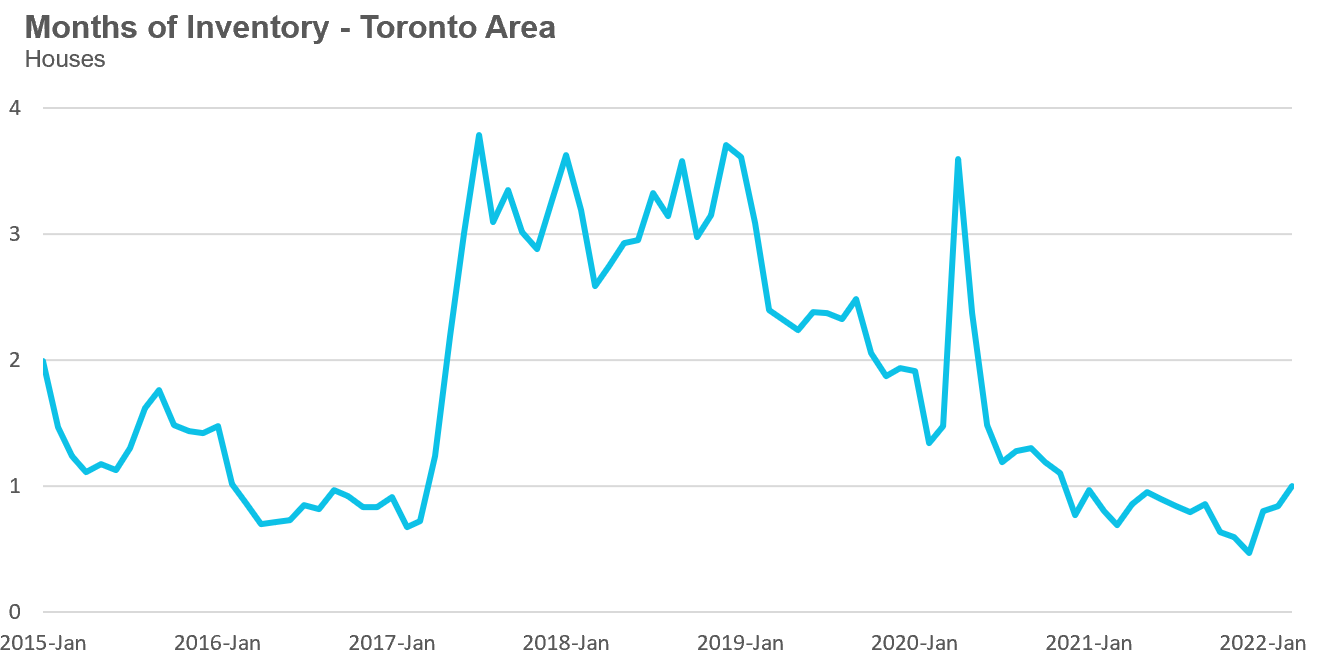
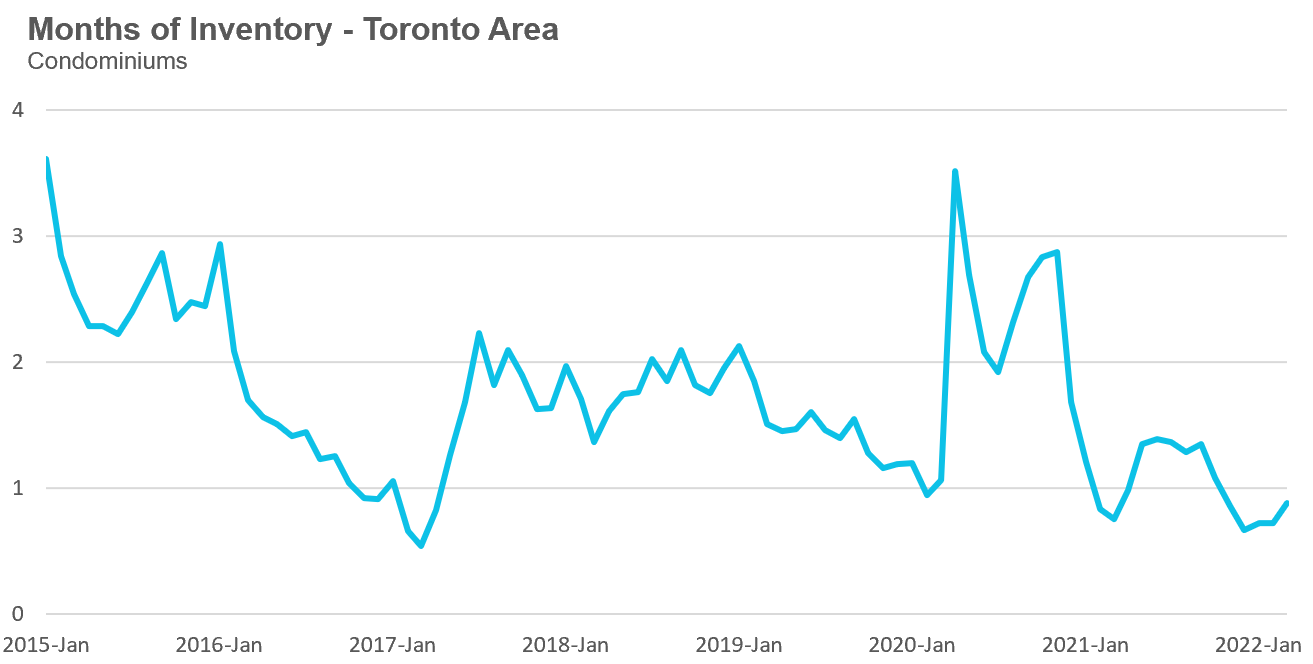
When we look at the Months of Inventory (MOI) for each housing type, we can see that inventory levels have been trending up for both low-rise houses and condos since mid February.
For this weekly analysis, the MOI is calculated by taking the number of active listings at the end of each reporting period and dividing that by the number of sales over the previous thirty days.
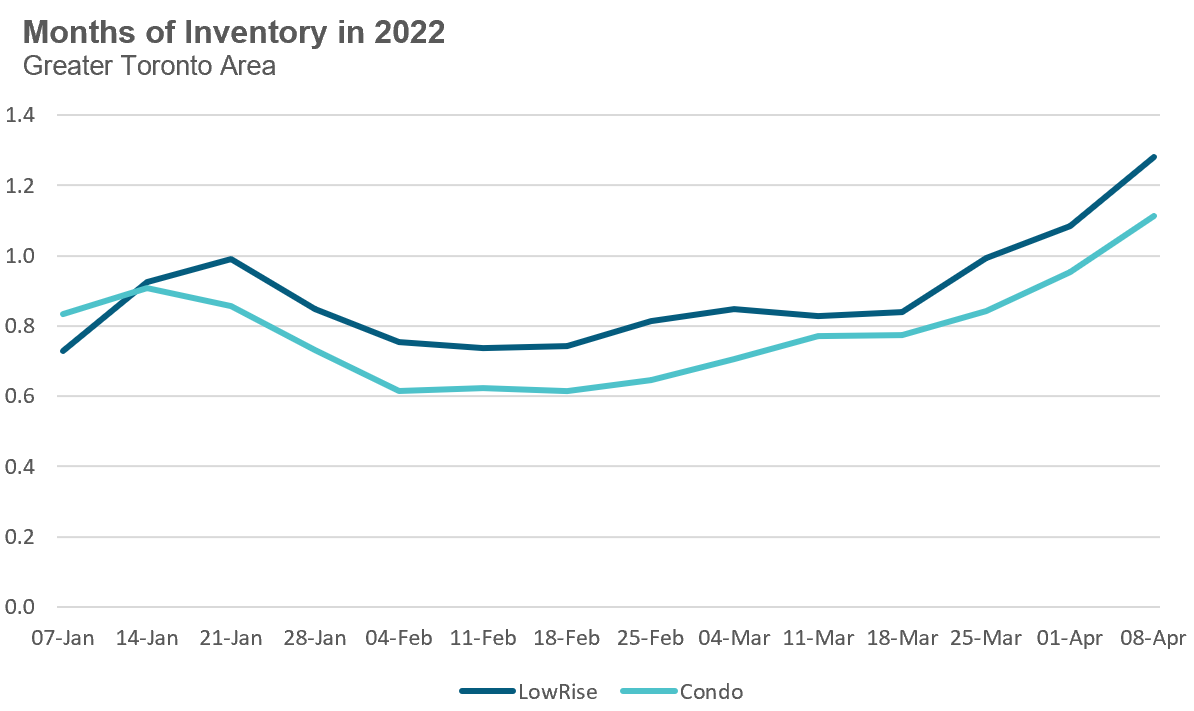
If this trend continues, we could see the spring market, usually the busiest season of the year, being a much quieter one than the first quarter of 2022.
House sales (detached, semi-detached, townhouse, etc.) in the Toronto area in March 2022 were down 35% over the same month last year, but above levels for the same month in pre-Covid 2019 and 2020. This trend masks the fact that sales began to decline during the second half of March, a trend that has continued into the first two weeks of April (see ‘Data Dive’ section above).
New listings in March were down 16% over last year, but well above the volume seen in 2019 and 2020.
The number of houses available for sale (“active listings”) was down 5% when compared to the same month last year and 37% below the inventory levels seen in 2019.
The Months of Inventory ratio (MOI) looks at the number of homes available for sale in a given month divided by the number of homes that sold in that month. It answers the following question: If no more homes came on the market for sale, how long would it take for all the existing homes on the market to sell given the current level of demand?
The higher the MOI, the cooler the market is. A balanced market (a market where prices are neither rising nor falling) is one where MOI is between four to six months. The lower the MOI, the more rapidly we would expect prices to rise.
While the current level of MOI gives us clues into how competitive the market is on-the-ground today, the direction it is moving in also gives us some clues into where the market may be heading.
The MOI has been below a very competitive 1 MOI since last year, but has been on the rise since December and ended the month at 1 MOI.
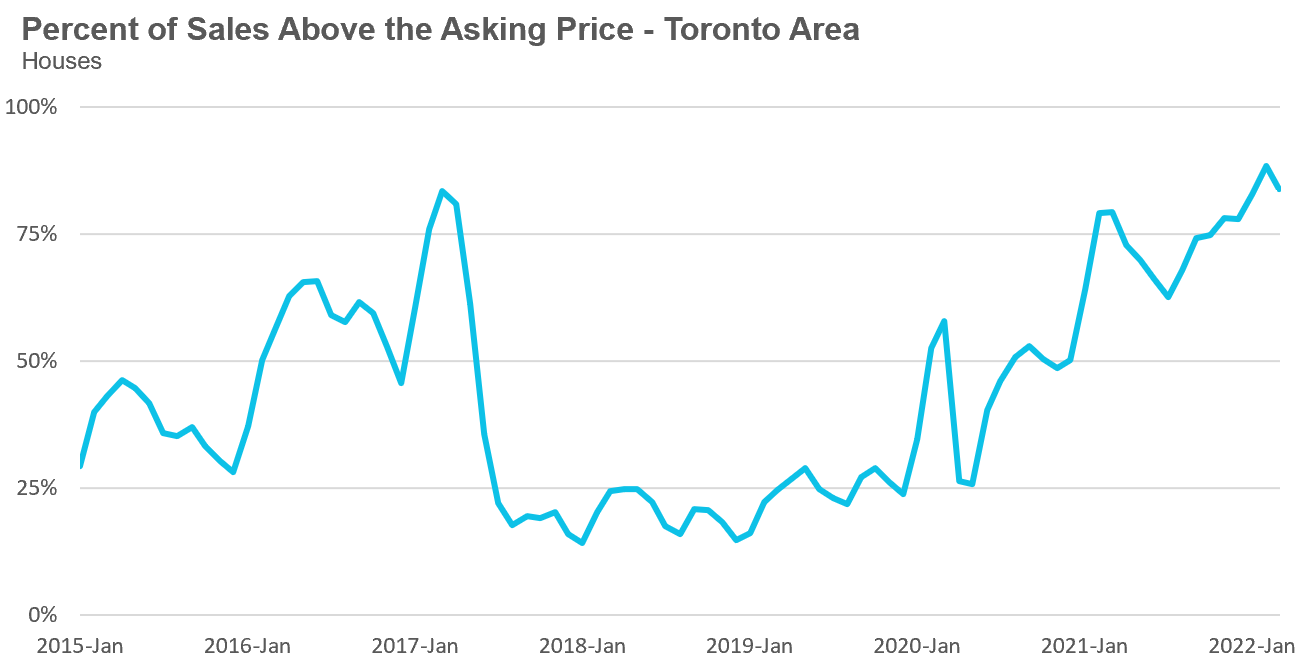
The share of houses selling for more than the owner’s asking price climbed to an unbelievable 84% in March.
The average price for a house declined to $1,596,091 in March 2022, but is up 21% over last year.
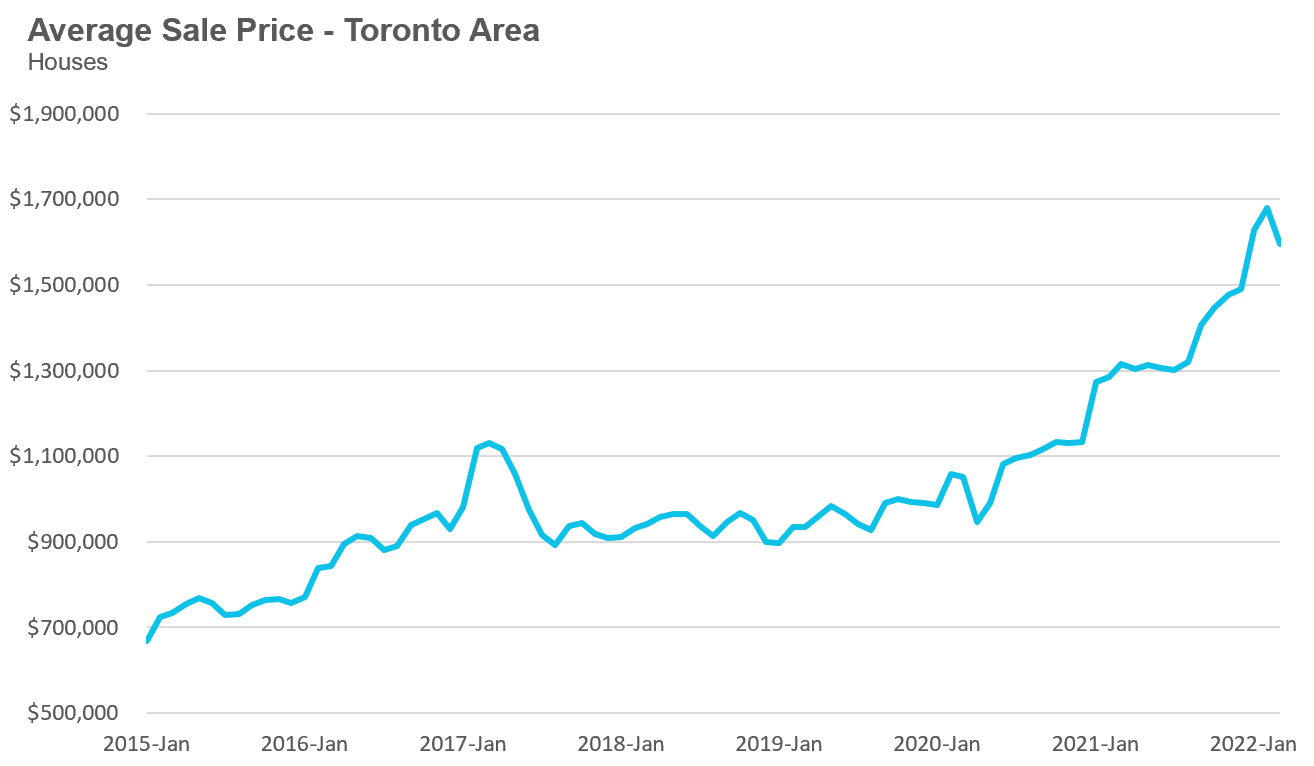
The median house price in March was $1,415,000, up 23% over last year, but down $70,000 over last month.
The median is calculated by ordering all the sale prices in a given month and then selecting the price that is in the midpoint of that list such that half of all home sales were above that price and half are below that price. Economists often prefer the median price over the average because it is less sensitive to big increases in the sale of high-end or low-end homes in a given month which can skew the average price.
Condo (condominiums, including condo apartments, condo townhouses, etc.) sales in the Toronto area in March 2022 were down 19% over last yea,r but well ahead of volumes in 2019 and 2020.
New condo listings were unchanged in March over last year and well ahead of the listing volume in 2019 and 2020.
The number of condos available for sale at the end of the month, or active listings, was down 5% over last year.
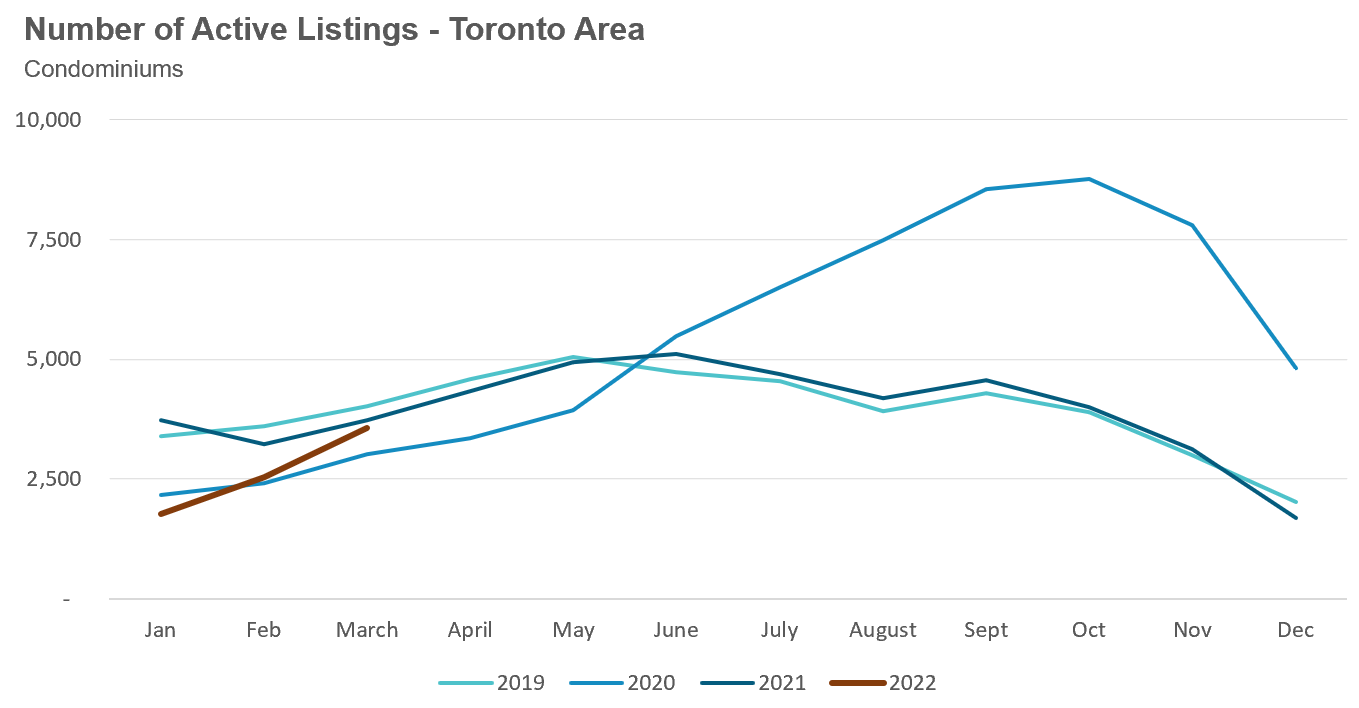
The strong demand helped keep the MOI below 1 MOI for the month of March.
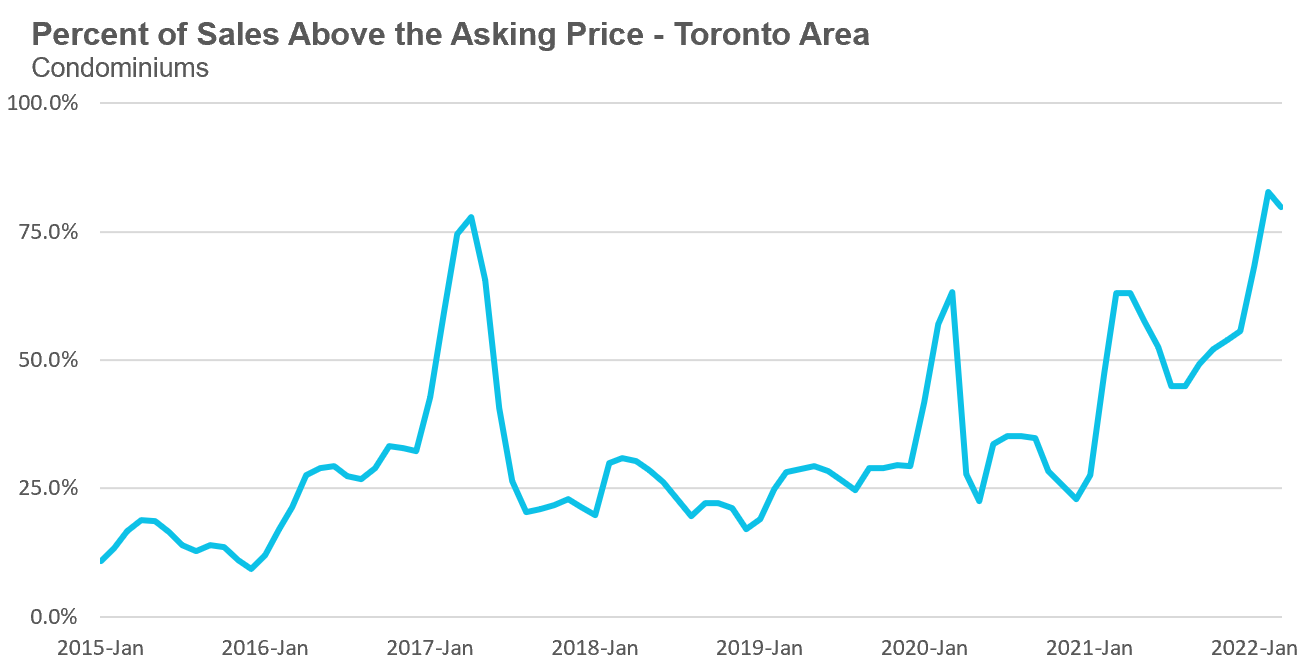
The competition for condos picked remained strong with the share of condos selling for over the asking price rising to 80% in March.
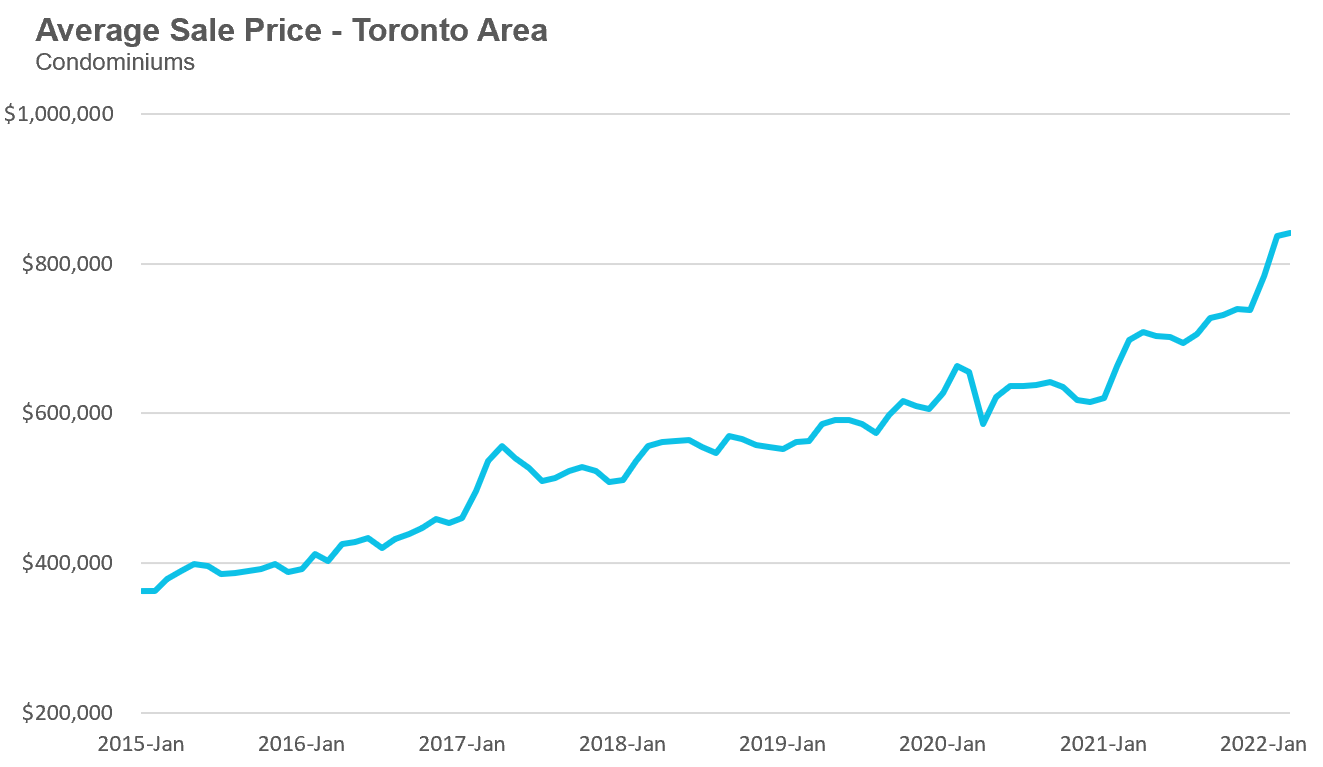
Average condo prices in March reached $840,444, up 20% over last year. The median price for a condo in March was $777,000, up 20% over last year.
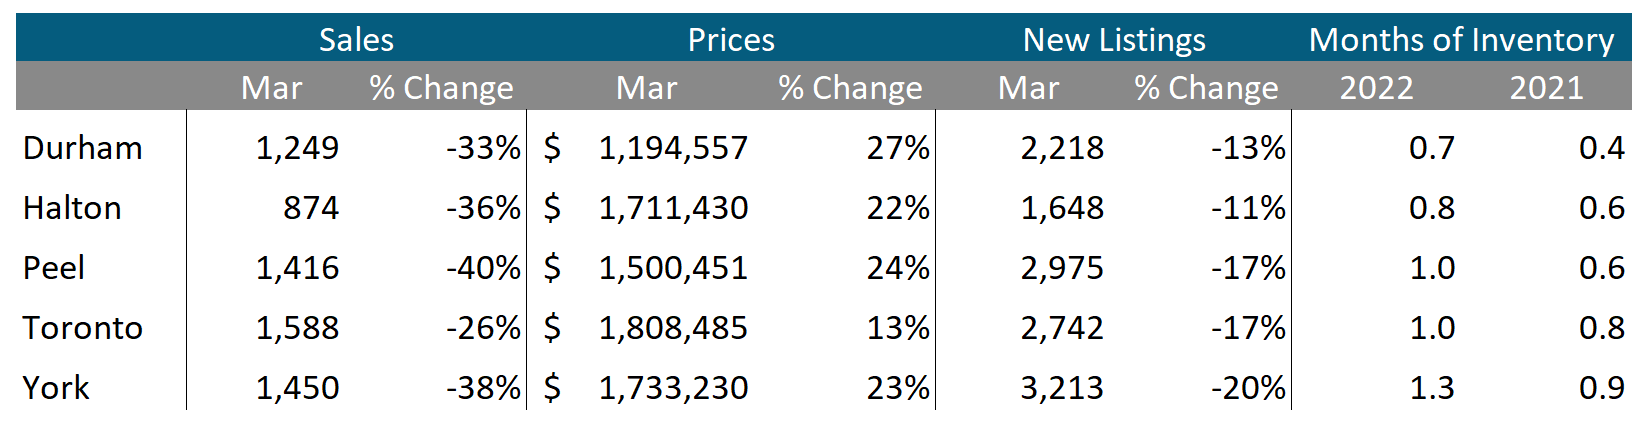
Houses
While average prices were up on a year-over-year (YOY) basis across all five regions in the GTA, YOY sales were down and inventory levels were ahead of last year’s level, indicating some market slowing.
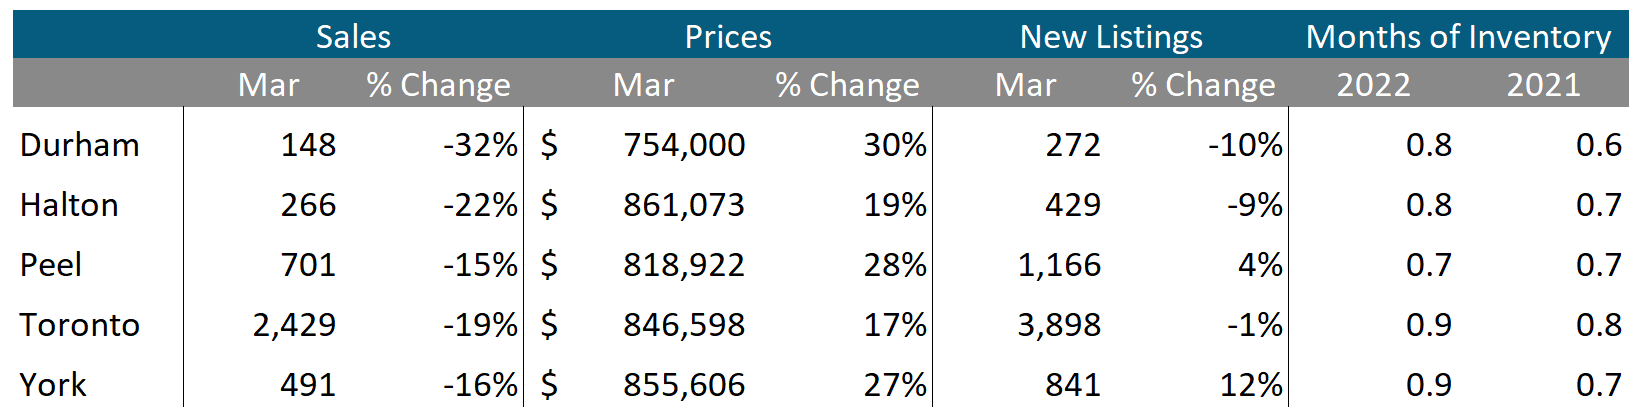
Condos
While condo sales were down across the GTA, average prices were up double digits in all five regions. Current MOI levels are below 1 across the GTA signalling a continuing strong seller’s market.
See Market Performance by Neighbourhood Map, All Toronto and the GTA
Greater Toronto Area Market Trends
GET MORE DATA
This monthly Move Smartly Toronto Area Real Estate Market Report is powered by Realosophy Realty. Get the same up-to-date Toronto area market data on realosophy.com and additional information on every home for sale, including building permit history, environmental alerts and more when you buy a home with Realosophy Realty.
