

FREE PUBLIC WEBINAR: WATCH REPORT HIGHLIGHTS & Q/A - Thursday August 10th 12PM ET

Join John Pasalis, report author, market analyst and President of Realosophy Realty, in a free monthly webinar as he discusses key highlights from this report, with added timely observations about new emerging issues, and answers your questions. A must see for well-informed Toronto area real estate consumers.
“I’ll be blunt as well - housing isn’t a primary federal responsibility. It’s not something that we have direct carriage of. But it’s something we can and must help with.”
- Prime Minister Justin Trudeau
The Prime Minister’s comments are deeply problematic for a number of reasons.
While the provinces and municipalities have far more control over the supply of housing through provincial planning and municipal zoning, the federal government controls virtually every aspect of the demand for housing. Federal agencies, including the Office of the Superintendent of Financial Institutions (OSFI) and Canada Mortgage and Housing Corporation (CMHC), control the mortgage underwriting guidelines for mortgages in Canada. Federally backed mortgage insurance is what enables first-time buyers to buy a home with less than a 20% down payment.
Perhaps most importantly, the federal government also controls Canada’s population growth rate, which directly impacts the demand for housing in Canada. The fact that Canada’s population is growing far more rapidly than our ability to build homes is one of the primary factors behind Canada’s housing crisis. This is something I discussed in last month’s report.
As highlighted by Move Smartly editor Urmi Desai during our August 2023 Real Estate Roundtable, the Prime Minister’s change in his communication strategy is important because it signals the federal government’s desire to download the blame for Canada’s housing crisis to the provinces, most of which are led by conservative premiers.
This is a strategy that mirrors the approach of Conservative leader Pierre Pollievre. But instead of blaming Conservative premiers for Canada’s housing crisis, Pollievre is blaming municipal “gatekeepers.”
Both federal leaders continue to ignore the federal government's important role in driving the demand for housing in Canada. Economist Mike Moffatt posted an important question on Twitter last month.
Our federal government continues to increase the number of study visas they issue each year, even though they know we don’t have adequate housing for these students because housing is not a “primary responsibility of our federal government.”
While our Prime Minister thinks this is an acceptable response, I know many Canadians, foreign students and workers who are experiencing this housing crisis first-hand disagree.
Anyone who has lived in Toronto for some time might conclude that the city has always had a rental crisis. Vacancy rates have been stubbornly low for decades, and I remember hearing about Toronto’s rental crisis when I was still a university student.
When things feel like a never-ending crisis, it’s hard to figure out if things have always been this bad or if there was a point in time when things got dramatically worse for renters. The only way to answer this question is to look at the data.
The rental data I will be using for this Data Dive is based on condominium apartment rental transactions from the Toronto Regional Real Estate Board’s MLS system. The chart below shows the average rental price for a condominium apartment from 2003 to July 2023.
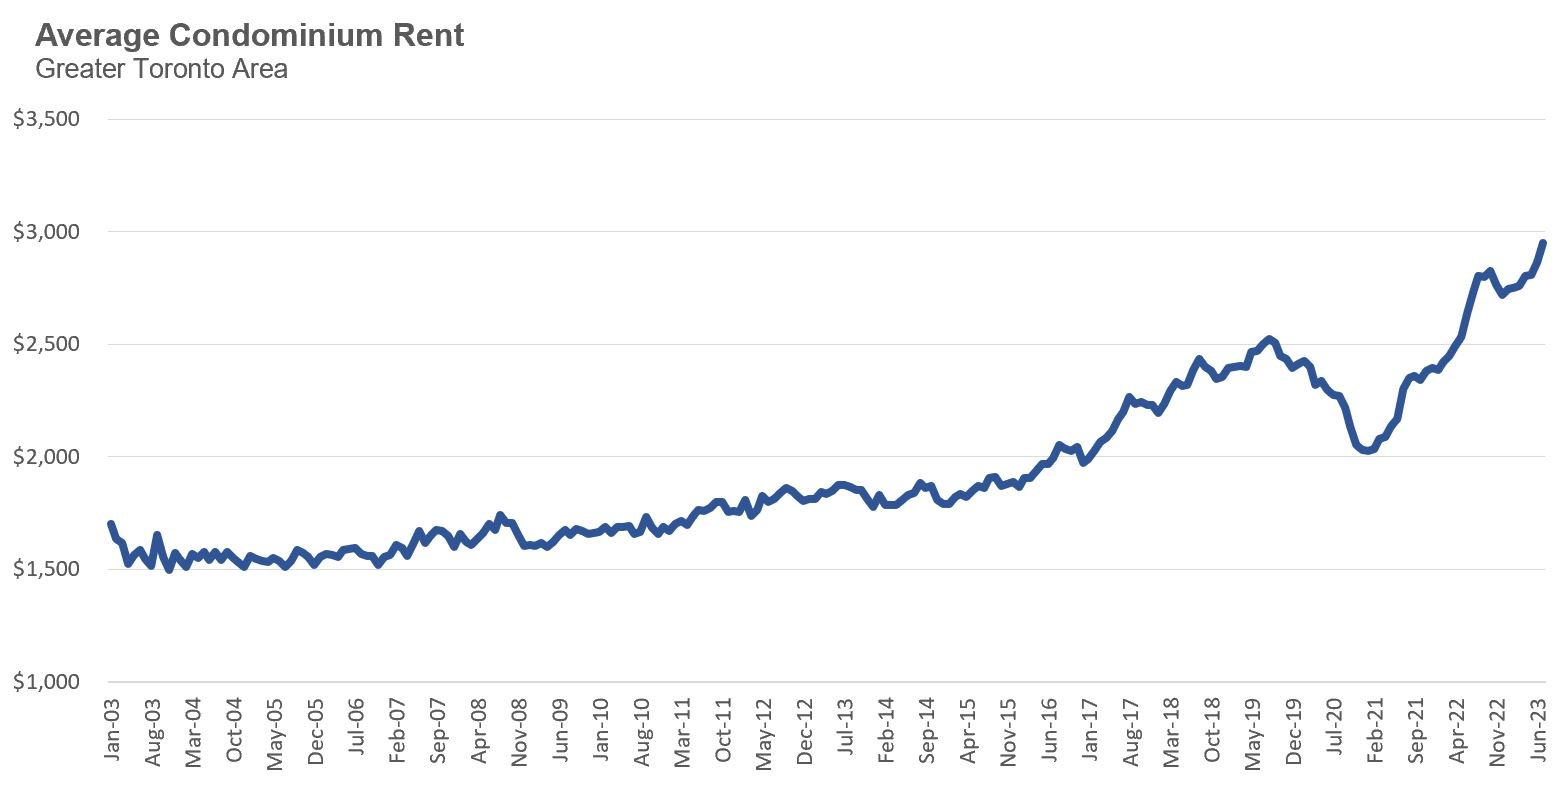
When looking at a relatively long time series of rents, we are interested in understanding if rents have been rising at a similar rate over time or if there is a particular period where rents were rising much faster than other periods. In this chart, it’s quite clear that rent prices were rising gradually between 2003 and 2015 before rapidly accelerating in the following years.
Average rents declined in the second half of 2020 as part of the urban exodus due to COVID, but they quickly recovered and are currently well above pre-COVID levels.
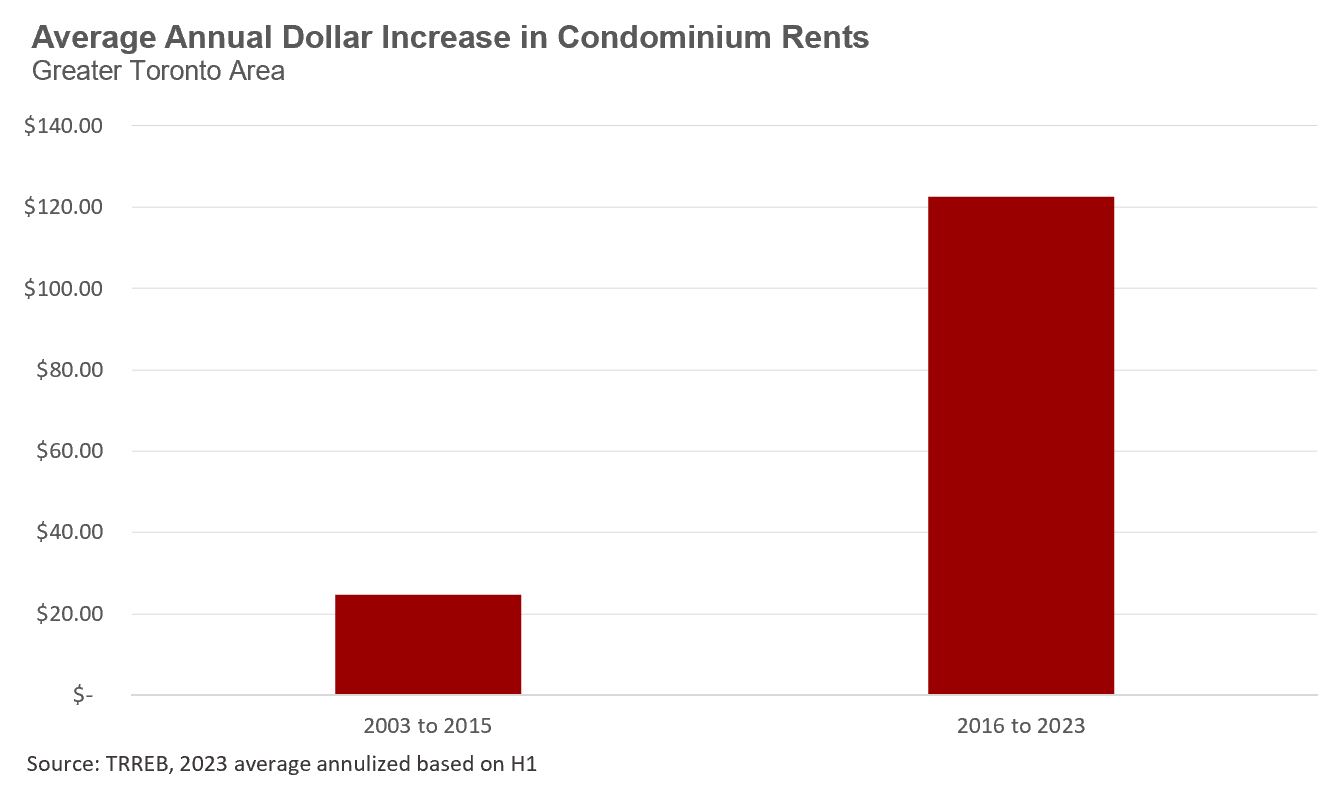
To get a better understanding of how average rents changed during the period of modest rent growth between 2003 and 2015 vs the following period, it’s helpful to convert the single-month average prices to a twelve-month average for each month, as this way, we are not putting too much emphasis on the fluctuations in a single month’s average price data. Going forward, any reference to average rent will refer to the previous twelve-month average.
In January 2004, the average condo rent was $1,564; by the end of 2015, the average rent had reached $1,862. That translates to a $298 increase in average rent over twelve years. If we break out this twelve-year increase into an average annual number, we find that the average condo rent increased each year by $25 per month.
In contrast, the average condo rent for January 2016 was $1,866, which climbed to $2,786 in June 2023. That translates to a $920 increase in the average rent over a seven-and-a-half-year period. If we break out this seven-and-a-half-year increase into an average annual number, we find that the average condominium rent increased each year by $123 per month.
So if it feels like Toronto’s rental crisis keeps getting worse, that’s because it is getting worse.
Annual condominium rents in Toronto are increasing 5 times faster after 2016 than they were before 2016.
What might be driving this rapid increase in rent since 2016?
The common explanation we hear from politicians, some economists and housing advocates is that this rapid increase in rents is due to a lack of supply. Specifically, either the city or province (or both) are restricting the supply of new housing through red tape, restrictive zoning policies, or to satisfy the demands of NIMBYs, or Not-In-My-Backyard-Neighbours who protest any new housing development planning for their area.
But unfortunately, this narrative doesn’t really hold up very well in explaining why rents have so rapidly accelerated when one looks at the data. Average annual condo completions in the Toronto CMA were actually higher in the years after 2016 than before 2016.
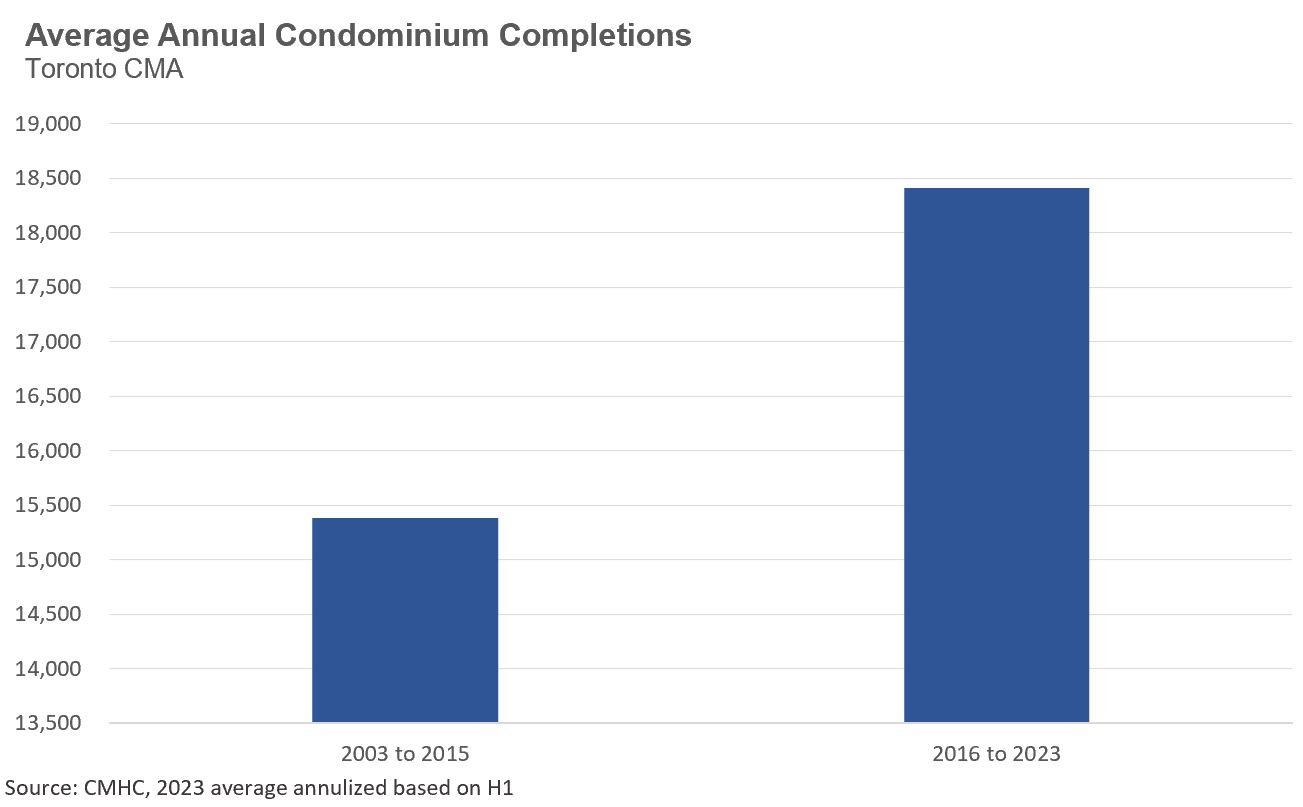
This does not mean that provinces and municipalities don’t need to do more to encourage more housing, especially when we consider that this increase in condo completions after 2016 was also coupled with a decline in new low-rise completions.
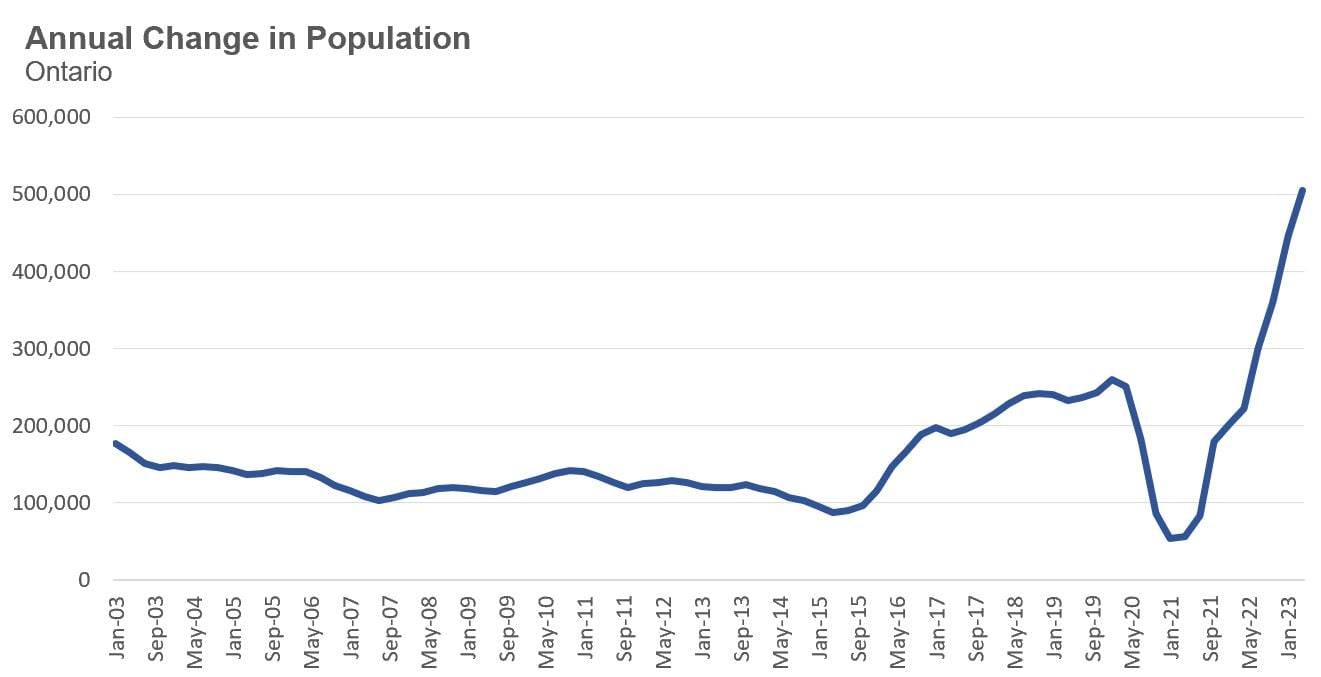
But ultimately, condo rents are a function of the demand for rentals and the supply of new completions each year. While the supply of new condo units increased, this growth did not help to cool rent prices because Ontario’s population growth, and by extension, the demand for rental housing, has grown far more rapidly over the same period.
Prior to 2016, Ontario’s population was growing by an average of 125,000 people per year. We saw that number increase to well over 200,000 between 2016 and 2020. After a short dip in 2020 due to COVID, Ontario’s population has grown by over 500,000 over the previous twelve months.
When a government rapidly increases the demand for housing without giving any thought to where people will live, the natural result is a market where average rents are increasing five times faster than historical trends.
When Canada’s new immigration minister Marc Miller announced that Ottawa might increase the rate at which our population is growing, this raised some questions from people concerned about Canada’s housing crisis.
University of Toronto economist Rob Gillezeau unpacked the federal government’s rationale and consequences of their immigration strategy on Twitter when he said (emphasis is mine):
“It's hard to fathom that government would knowingly choose to further exacerbate the housing crisis, but at least the federal government is being clear about its policy path. I do appreciate
Marc Miller's honesty on the rationale. Rather than engaging in other reforms to ensure long run fiscal sustainability, government is choosing a temporary worker + immigration to path to meeting that fiscal goal. That may be an economically viable path, but it comes with enormous costs with respect to the housing crisis & inequality that will disproportionately hurt newcomers, young people, renters, and working & middle class Canadians.”
In short, rather than engaging in other reforms to ensure Canada’s long-run fiscal sustainability, our federal government is using a shortcut solution, rapidly increasing Canada’s population growth, which they should know comes with enormous costs to the poorest households in Canada.
Sacrificing the poor for a shortcut to economic growth is not a promising vision for Canada.
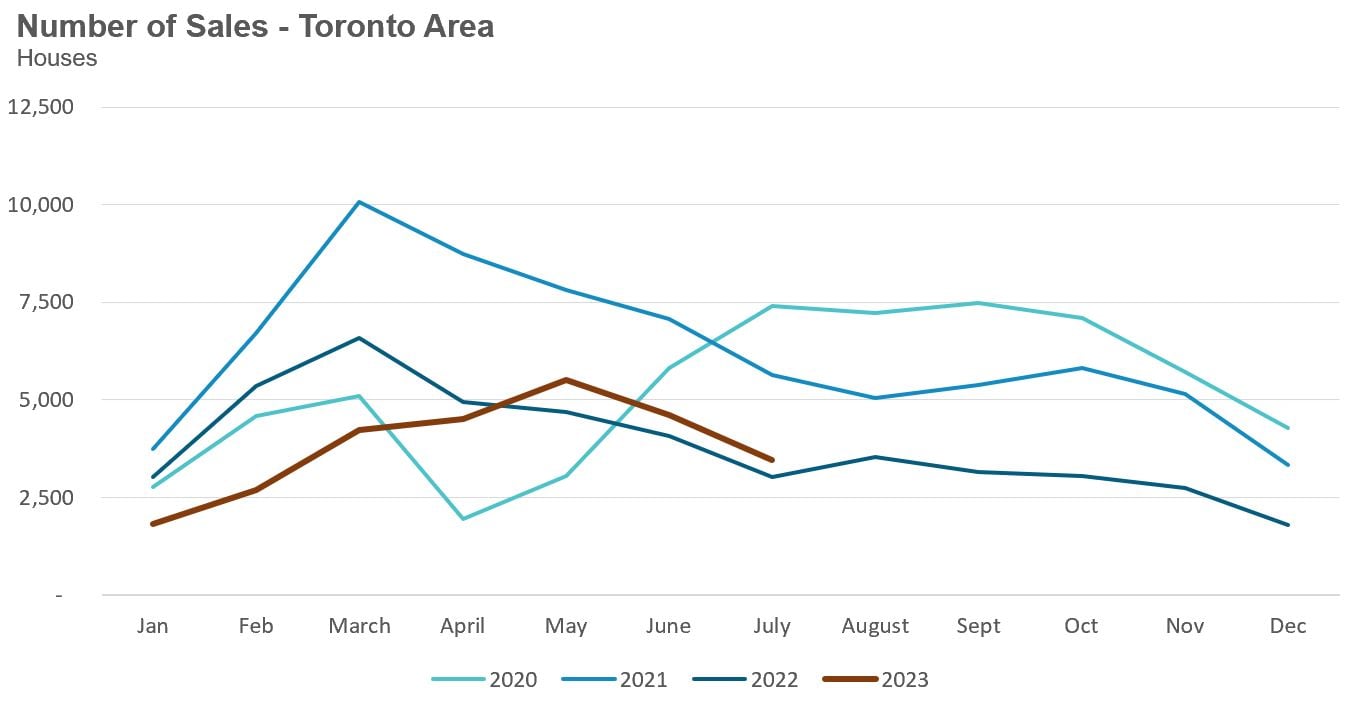
House sales (low-rise freehold detached, semi-detached, townhouse, etc.) in the Greater Toronto Area (GTA) in July 2023 were up 15% over the same month last year.
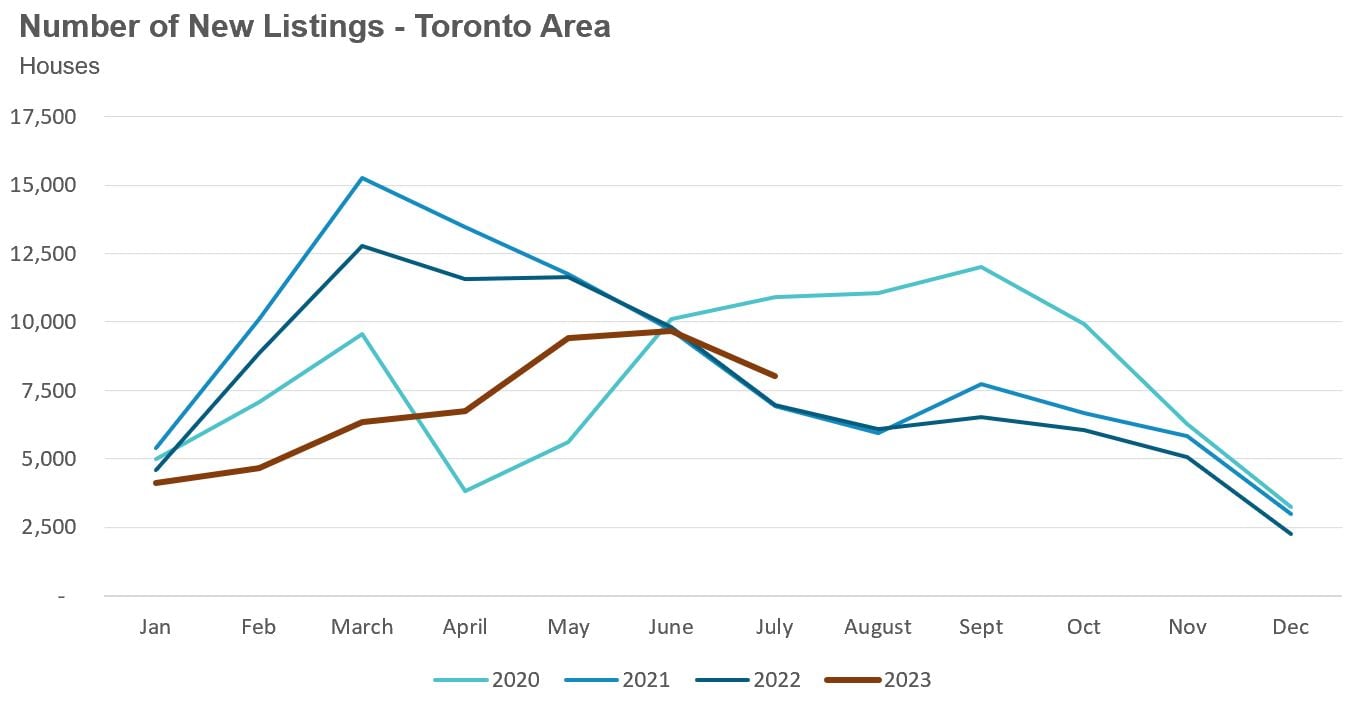
New house listings in July were up 15% over last year.
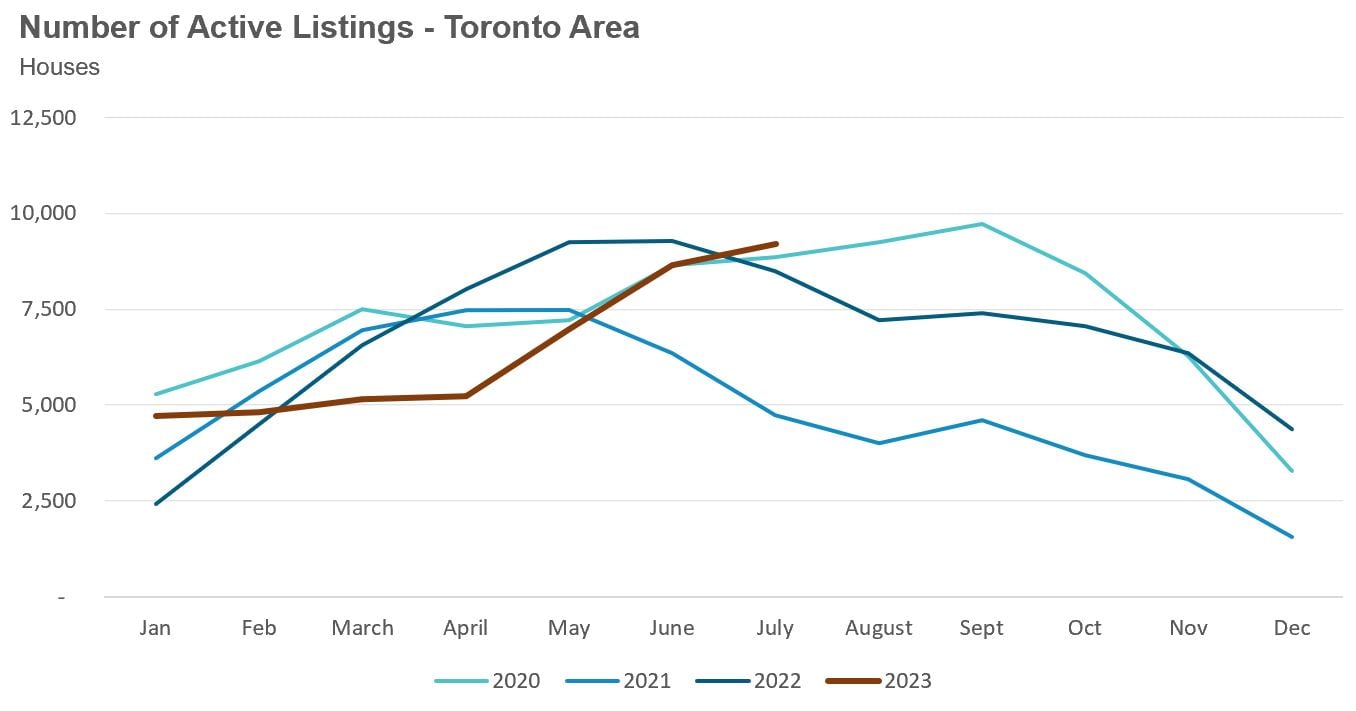
The number of houses available for sale (“active listings”) was up 8% in July when compared to the same month last year.
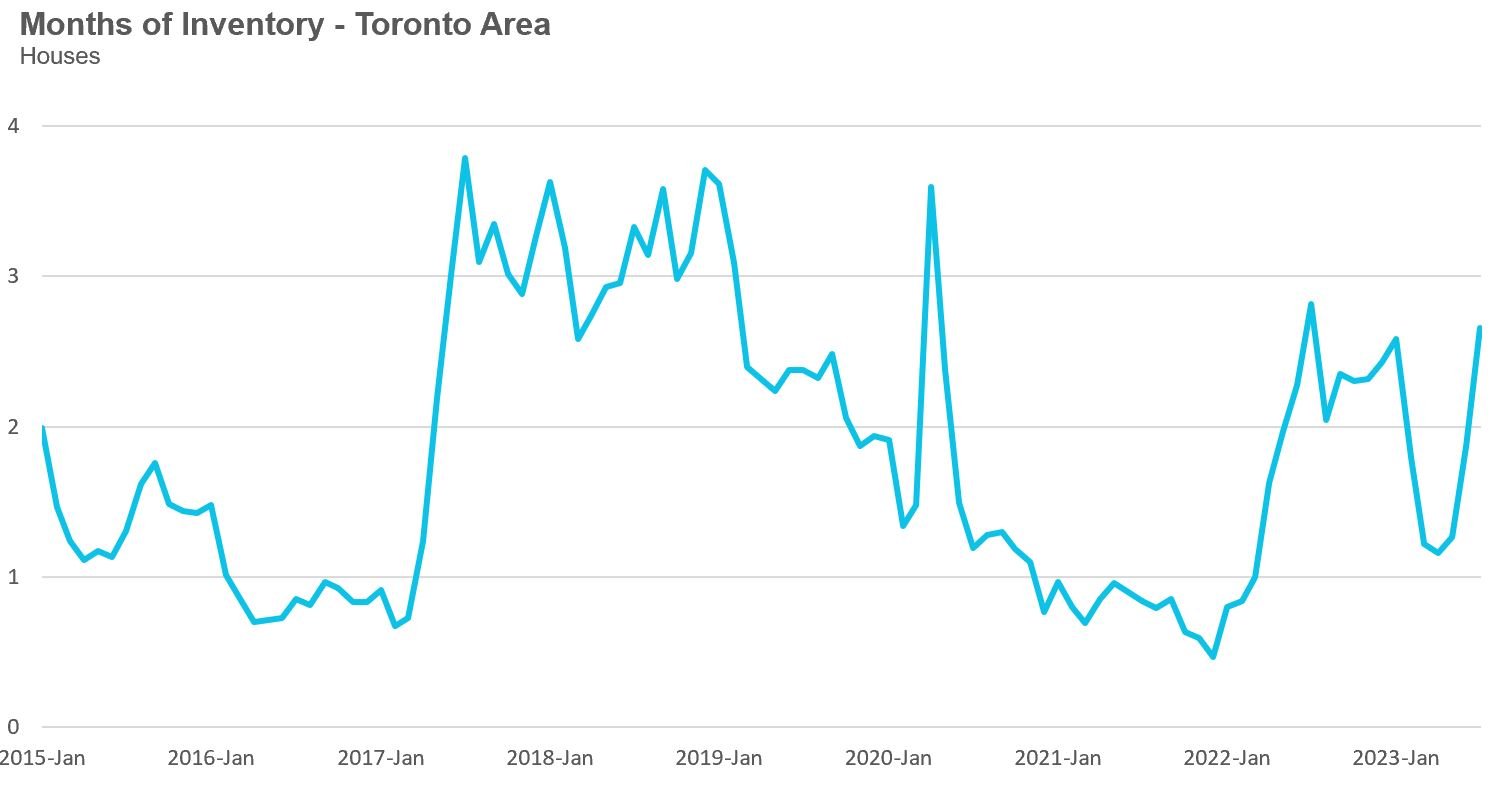
The Months of Inventory ratio (MOI) looks at the number of homes available for sale in a given month divided by the number of homes sold in that month. It answers the following question: If no more homes came on the market for sale, how long would it take for all the existing homes on the market to sell, given the current level of demand? The higher the MOI, the cooler the market is. A balanced market (a market where prices are neither rising nor falling) is one where MOI is between four to six months. The lower the MOI, the more rapidly we would expect prices to rise.
While the current level of MOI gives us clues into how competitive the market is on-the-ground today, the direction it is moving in also gives us some clues into where the market may be heading.
The MOI for houses increased sharply from 1.3 in May to 2.66 in July, signalling a rapidly cooling down market.
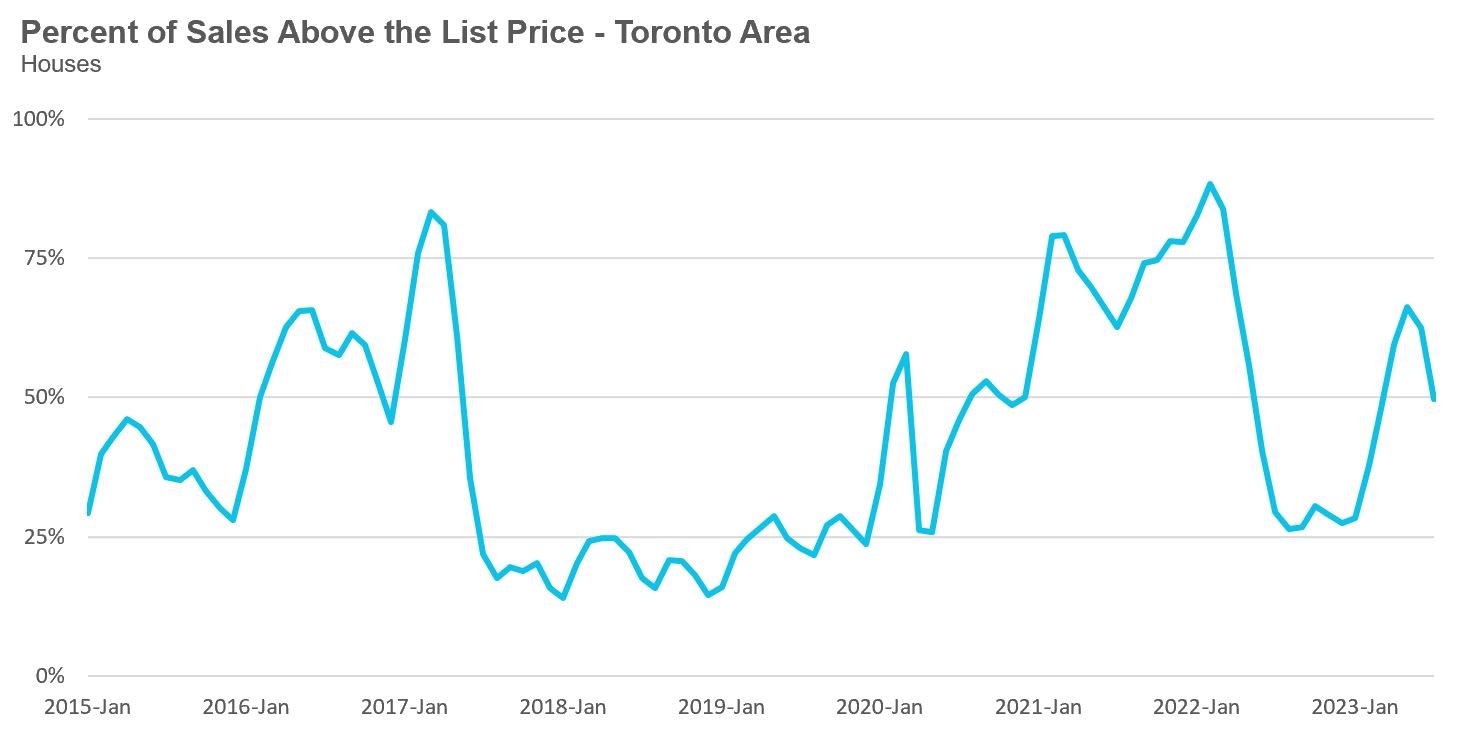
The share of houses selling for more than the owner’s list price decreased to 50% in July.
The average price for a house in July was $1,353,902 in July 2023, up 5% when compared to the same month last year but down 8% over the past two months.
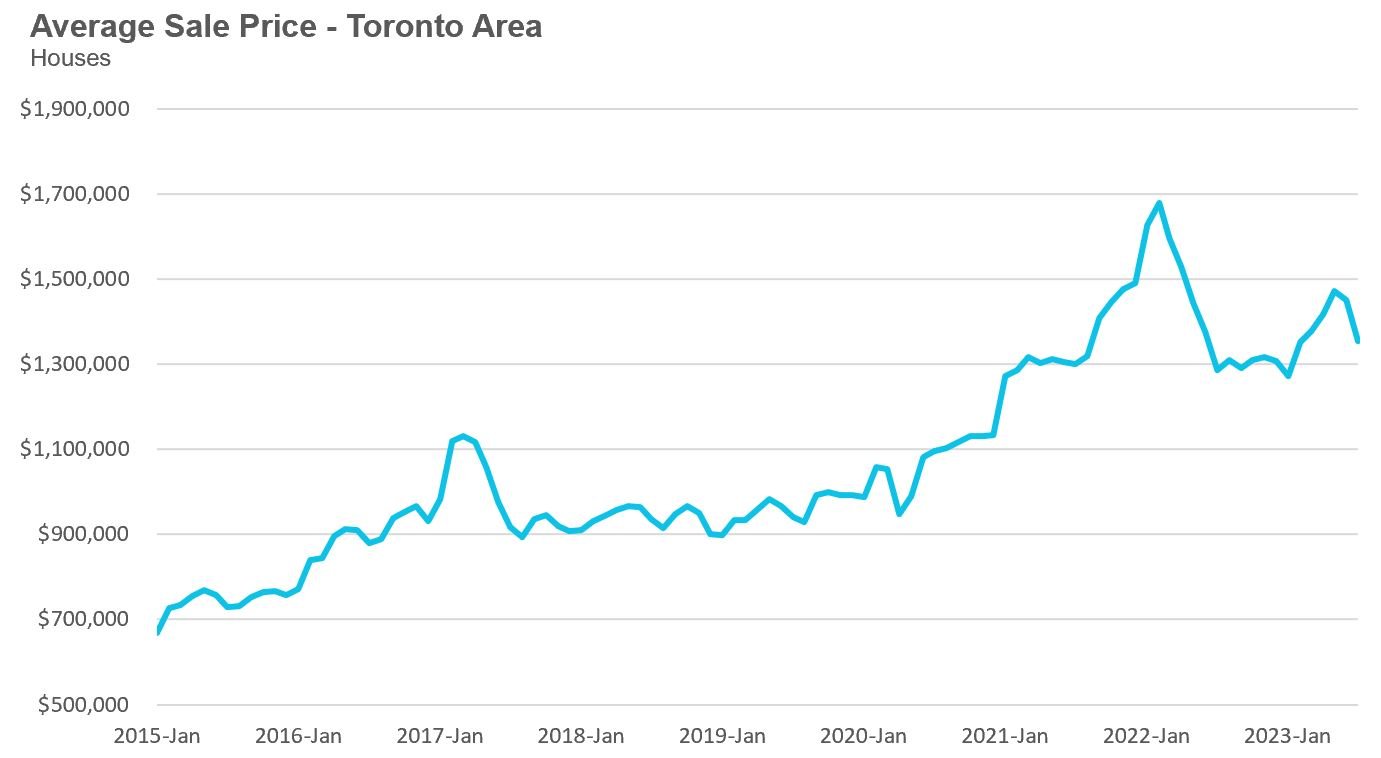
The median house price in July was $1,191,500, up 6% over last year, but also down 8% over the past two months.
The median is calculated by ordering all the sale prices in a given month and then selecting the price that is in the midpoint of that list such that half of all home sales were above that price and half are below that price. Economists often prefer the median price over the average because it is less sensitive to big increases in the sale of high-end or low-end homes in a given month which can skew the average price.
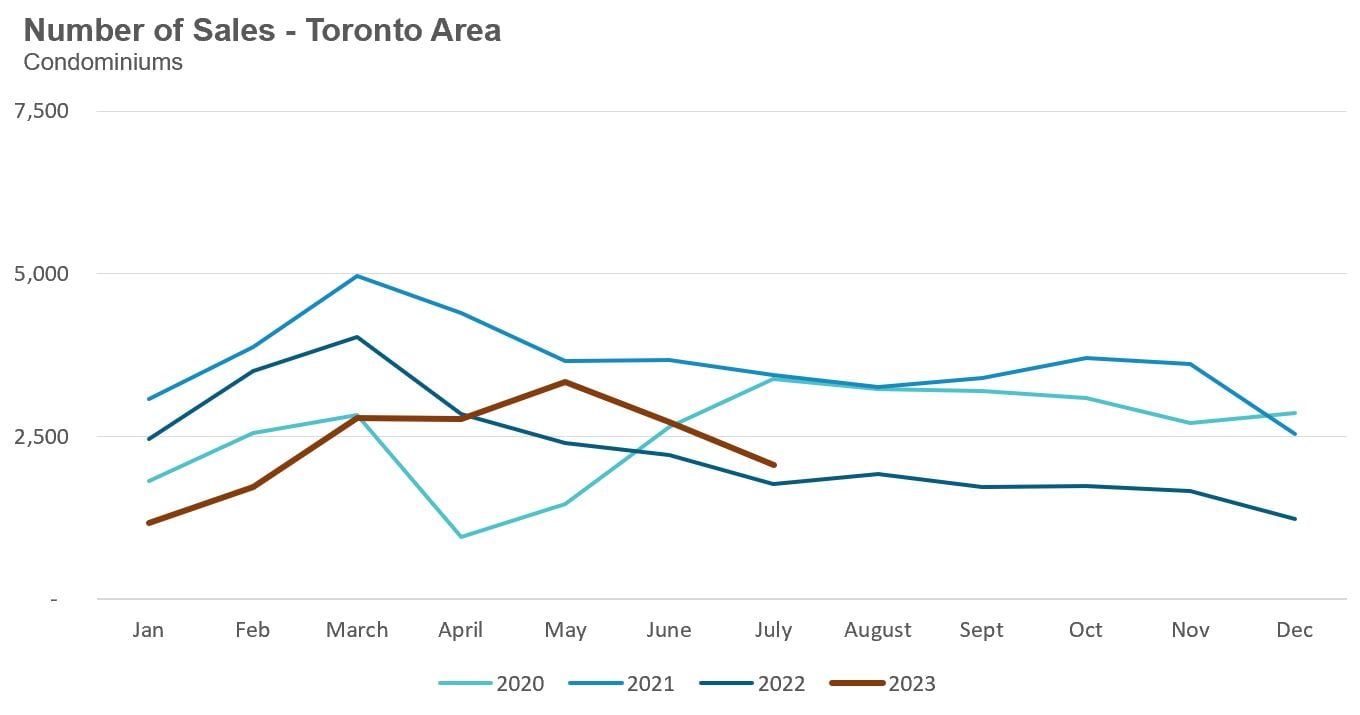
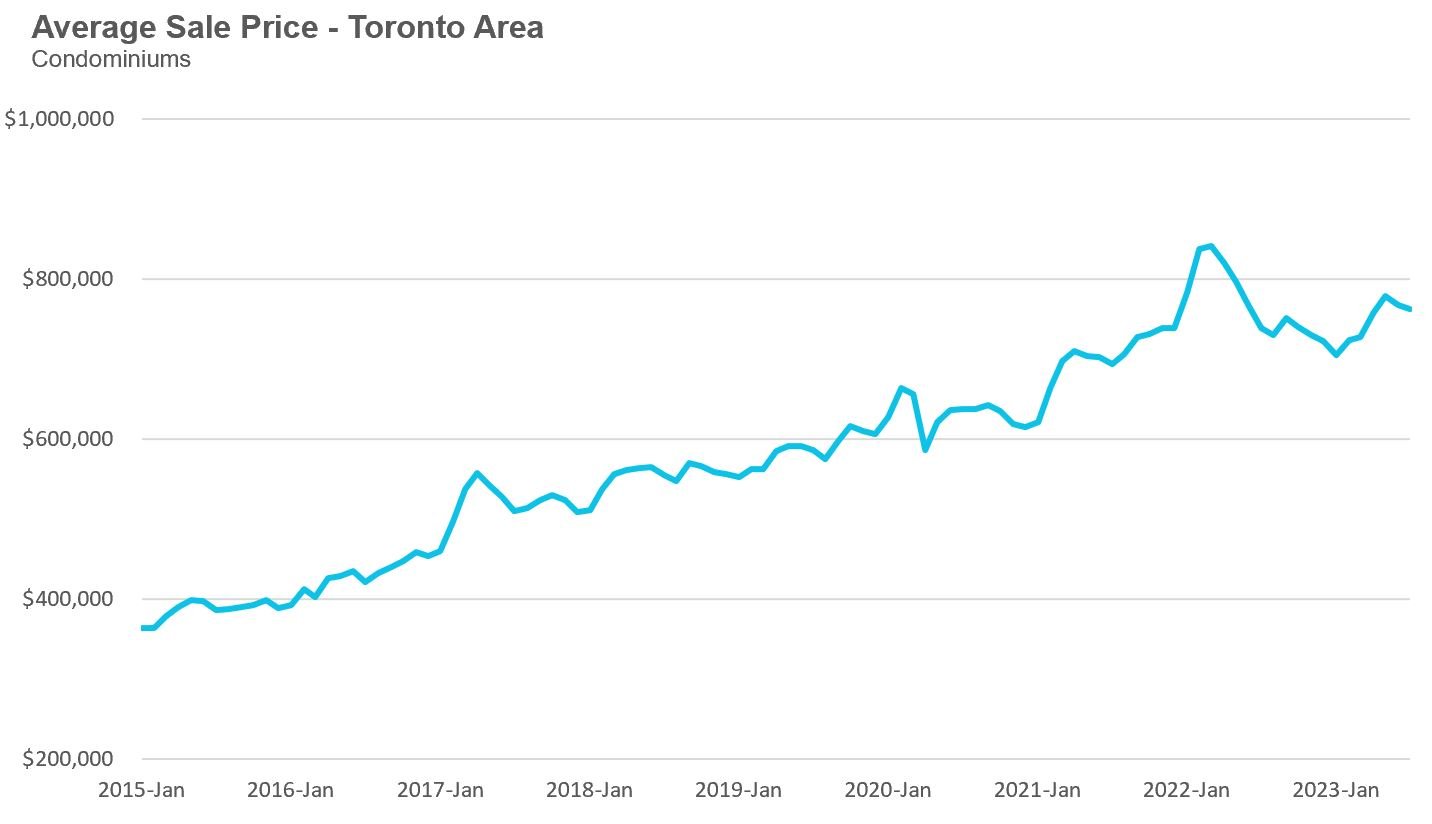
Condo (condominiums, including condo apartments, condo townhouses, etc.) sales in the Toronto area in July 2023 were up 17% over the same month last year.
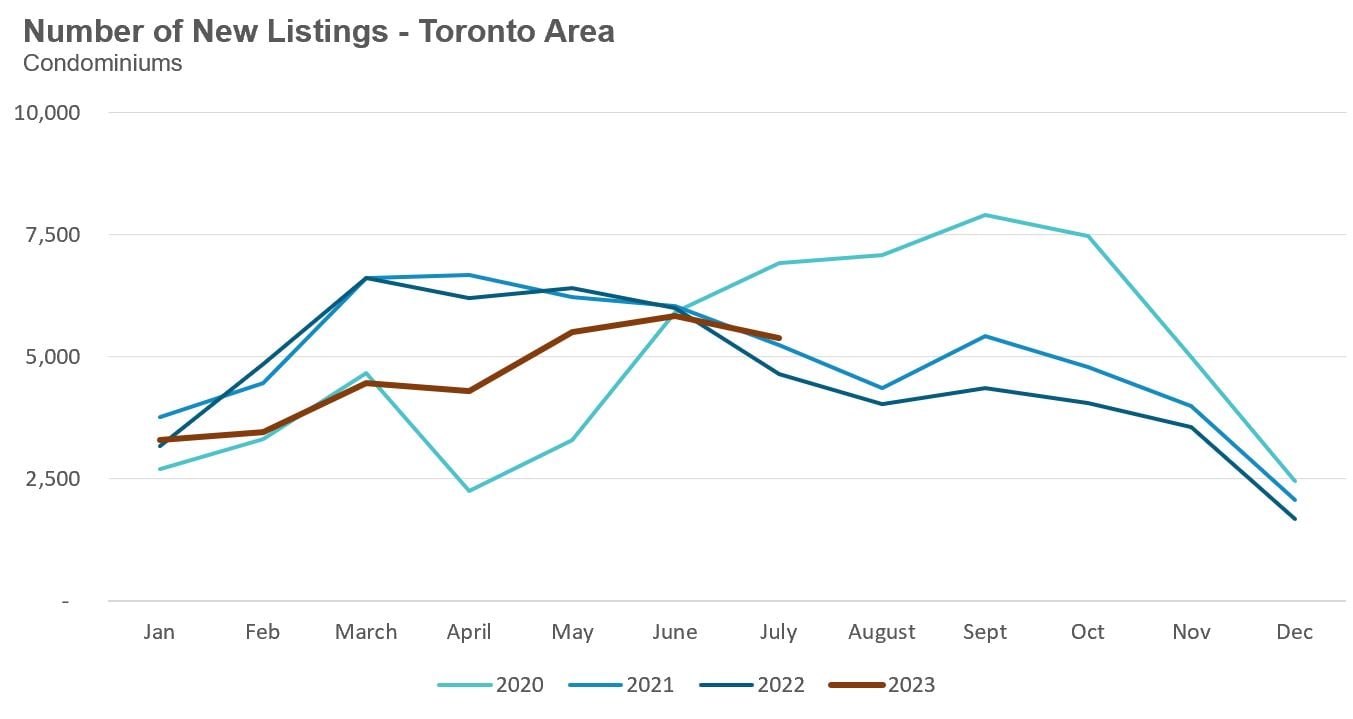
New condo listings were up 16% in July over last year.
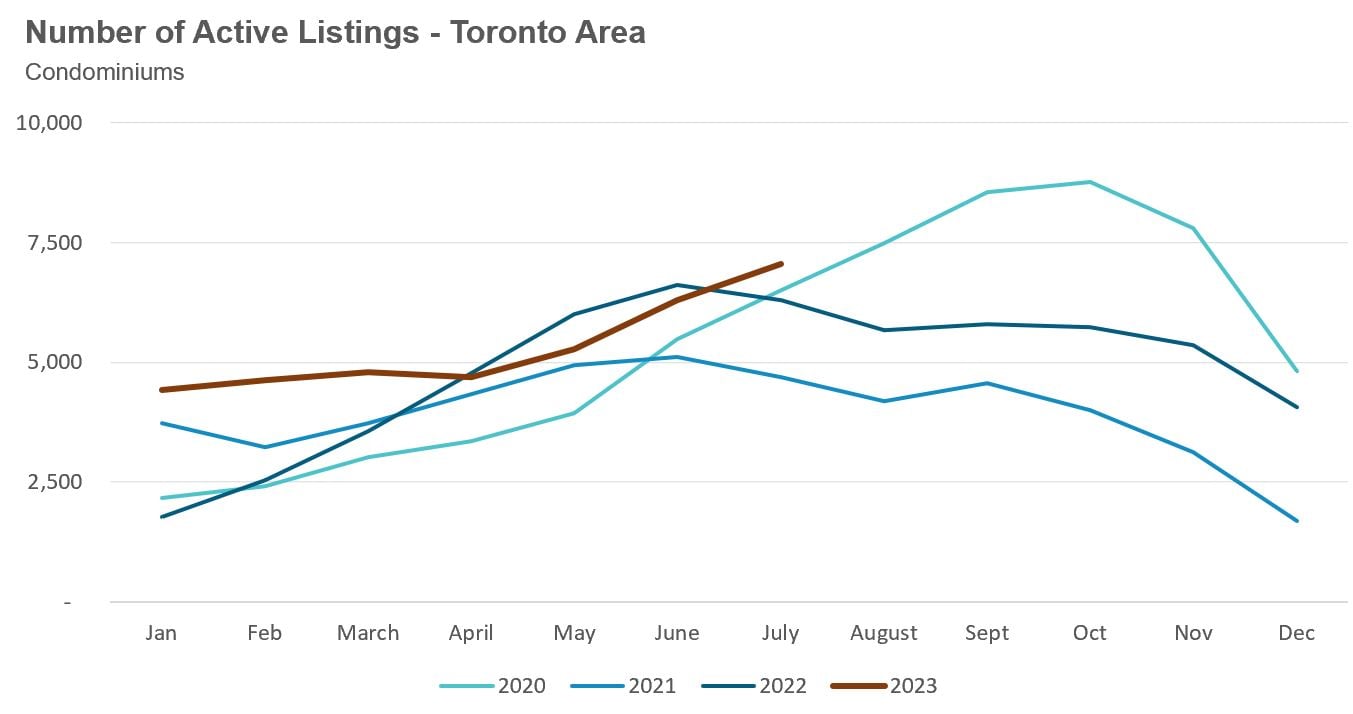
The number of condos available for sale at the end of the month, or active listings, was up 12% over last year.
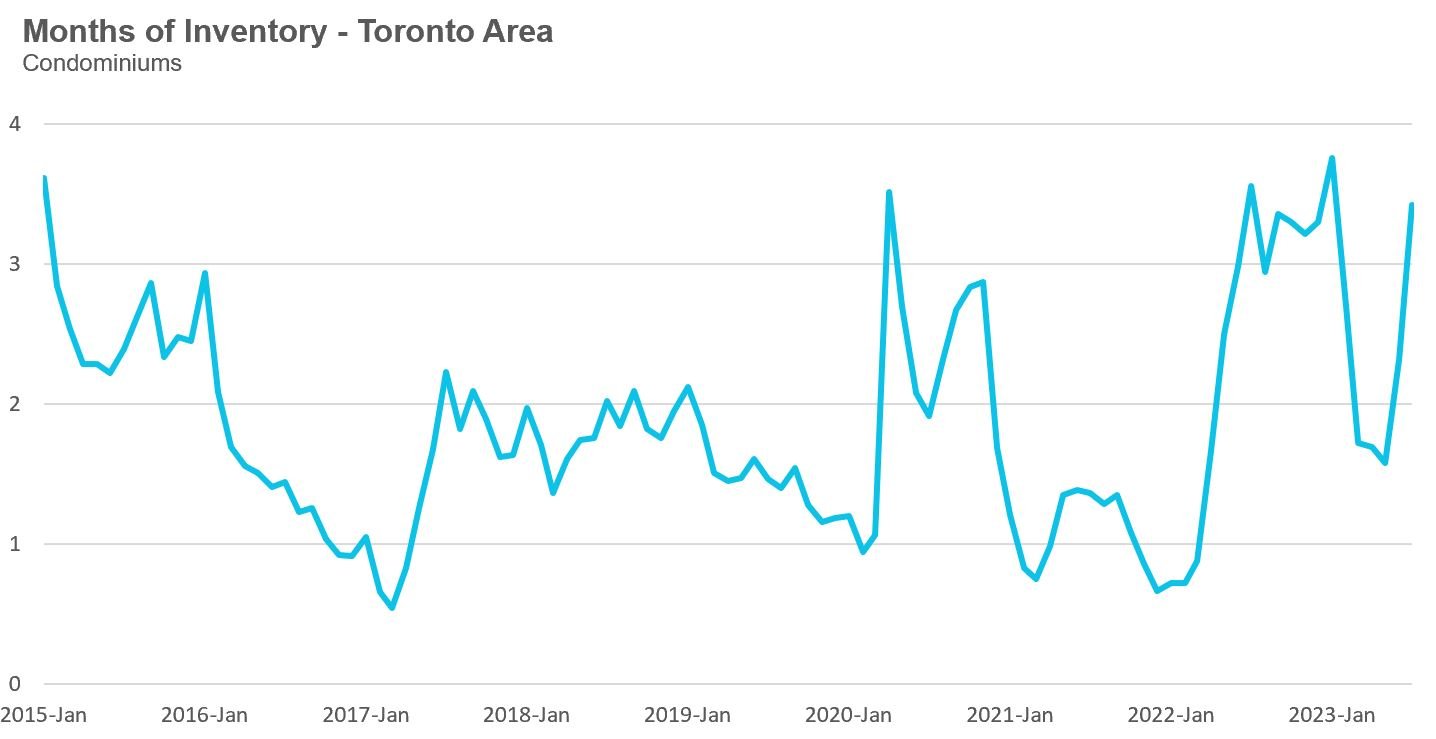
Condo months of inventory increased from 1.6 in May to 3.4 MOI in July, a sign that the condo market is rapidly cooling down.
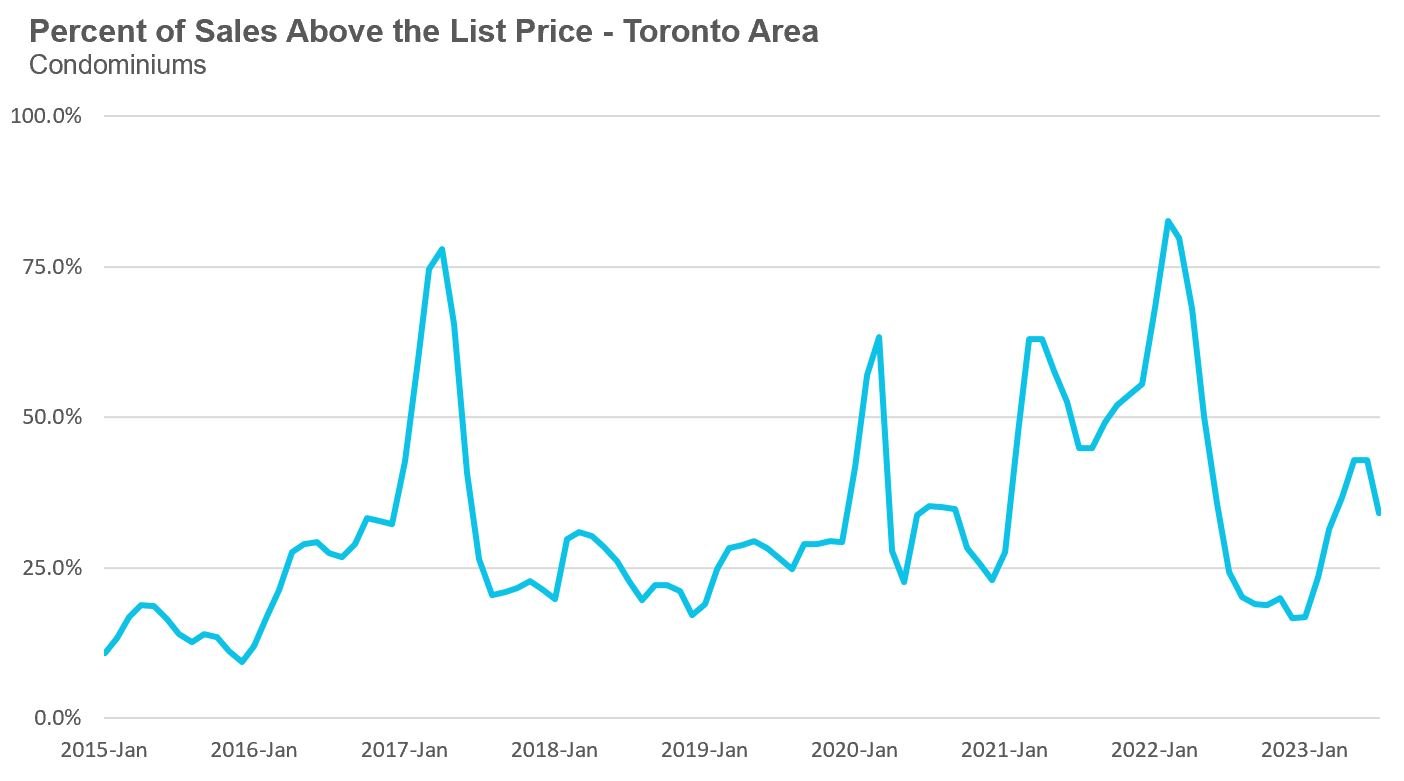
The share of condos selling for over the asking price declined to 34% in July.
The average price for a condo in July was $762,239, up 3% over last year. The median price for a condo in July was $690,000, unchanged compared to last year.
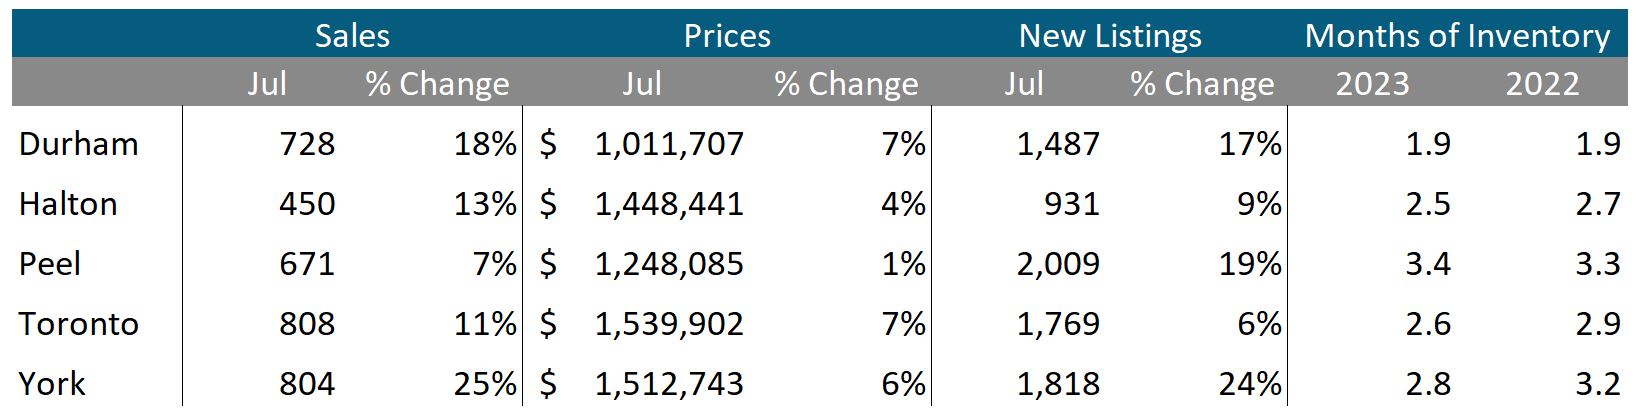
Average house prices and sales were up across the GTA last month. New listings were up in all regions, and up by double digits in Durham, Peel and York. The MOI is in line with last year’s levels suggesting a similar balance between demand and supply as last year
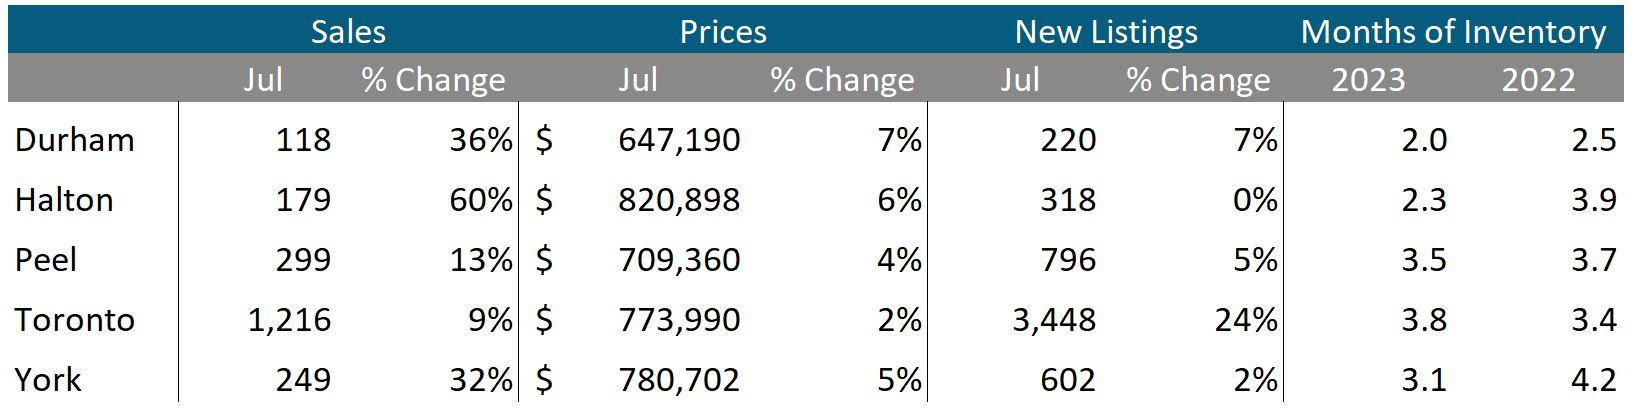
Condo sales were up across all regions in the GTA last month, with the suburbs seeing the most rapid increase in sales. Average prices were up across all four regions. Unlike for houses, MOI numbers this year are lower in most regions, suggesting a more competitive now as compared to last year; however, month-to-month MOI numbers are increasing (as discussed in the first section of this report).
See Market Performance by Neighbourhood Map, All Toronto and the GTA
Greater Toronto Area Market Trends


