“In some markets, where you had really rapid increases in prices, you could see a fall of 10 per cent, 20%.”
- Peter Routledge, OSFI
“If we don’t fix this, if we don’t right-size the number of homes in Canada or Ontario relative to population needs, things are never going to be more affordable.”
- Jean-Francois Perrault, Scotiabank Chief Economist
“Adding together the unformed households from 2016-21 due to the supply gap of homes, along with the formation of new households, we project, on net, an additional one million households to be formed in the next ten years, requiring one million new homes.”
- Mike Moffat
So how likely are we to build one million homes over the next ten years?
According to the CMHC, over the past ten years, Ontario has completed an average of 63,844 homes each year, well below the 100,000 net new homes we would need to build each year over the next ten years.
It’s worth noting that using new completions as measured by CMHC is not entirely accurate because this does not take into account the number of homes demolished and removed from our housing stock each year. In order to have 100,000 net new homes each year, Ontario would need to build a new home for every one removed from our housing stock, pushing the required annual completions above 100K.
If Ontario is averaging 63,844 completions per year, it’s clear that we are not going to get to 100K annual completions overnight and it will take the housing market some time to get to that level. But by that time, the shortfalls each year will need to be caught up on too.
If we use a constant rate of growth in new competitions that would allow us to achieve 1 million new completions over the next ten years, we end up with this chart showing the required completions in red over the next ten years, peaking at just over 130K completions in 2031.
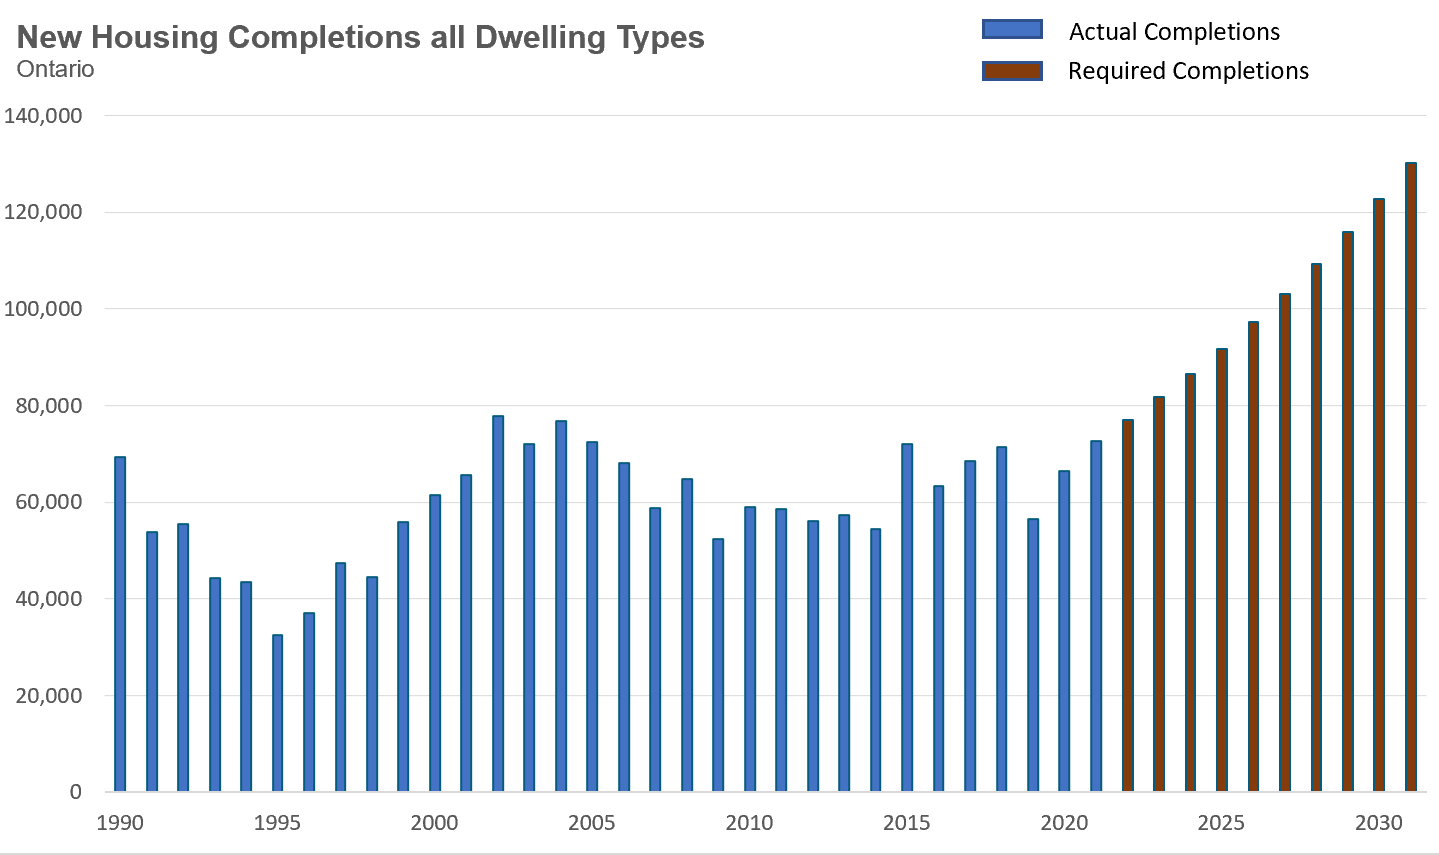
What is the likelihood that Ontario will go from completing 64,000 homes on average per year to over 130,000 completions in ten years?
Considering that the Ontario government only appointed a Housing Affordability Task Force tasked with making recommendations to increase housing supply just two months ago in December 2021, it's clear that the probability that Ontario will build 1 million homes in ten years is practically 0%.
Accelerating Ontario’s average annual housing completions from 64,000 to 100,000 per year would have required over a decade of planning and coordination between the public and private sectors.
This means that we not only need to scale up our housing completions rapidly, we need to make drastic changes to the types of homes we are building.
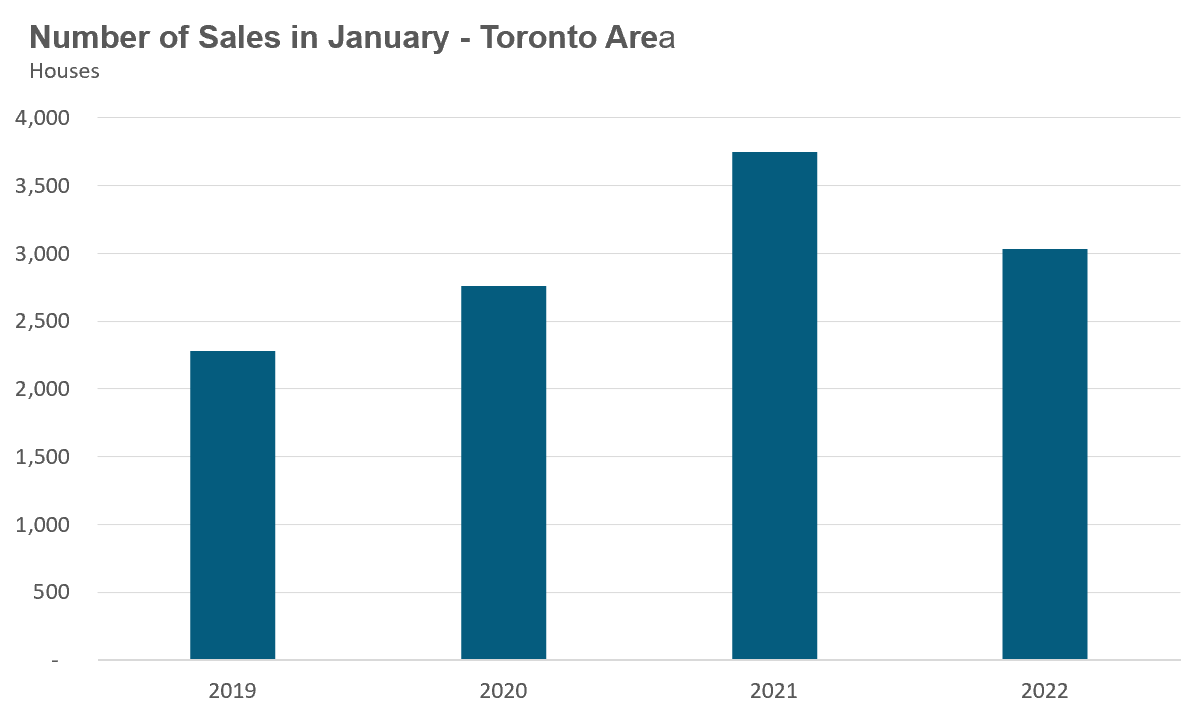
House sales (detached, semi-detached, townhouse, etc.) in the Toronto area in January 2022 were down 19% over the same month last year, but were above levels for the same month in pre-Covid 2019 and 2020.
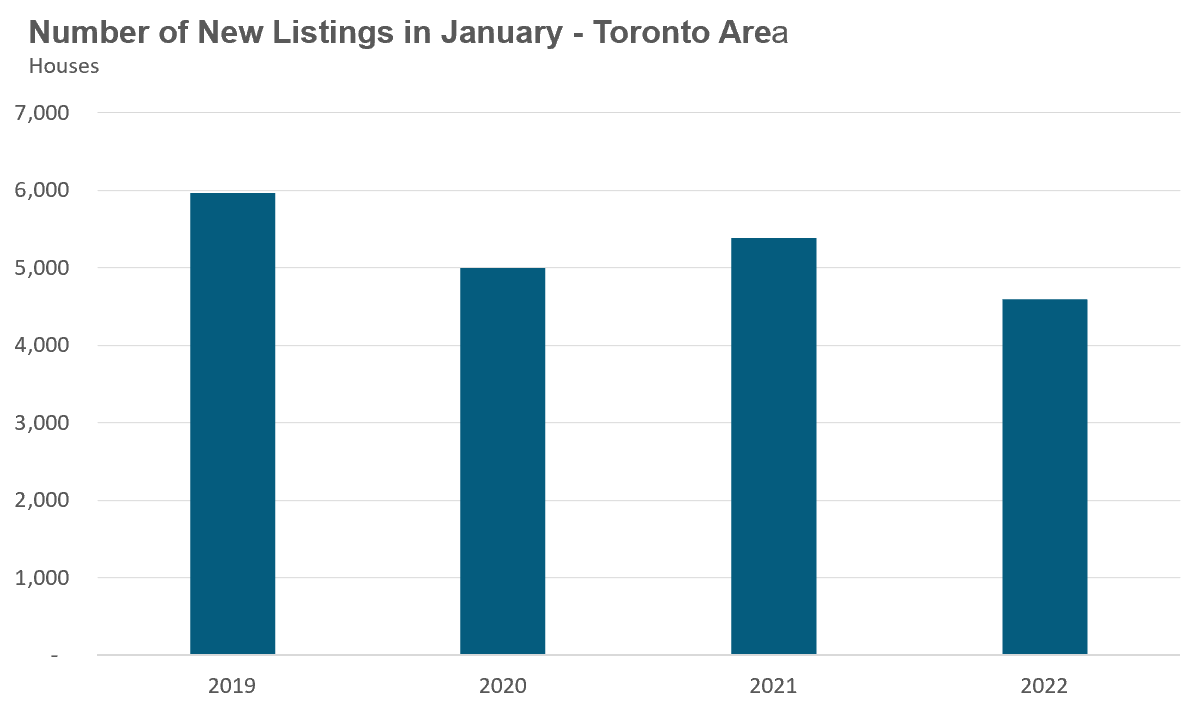
New listings in January were down 15% over last year, and below the volumes seen in 2019 and 2020.
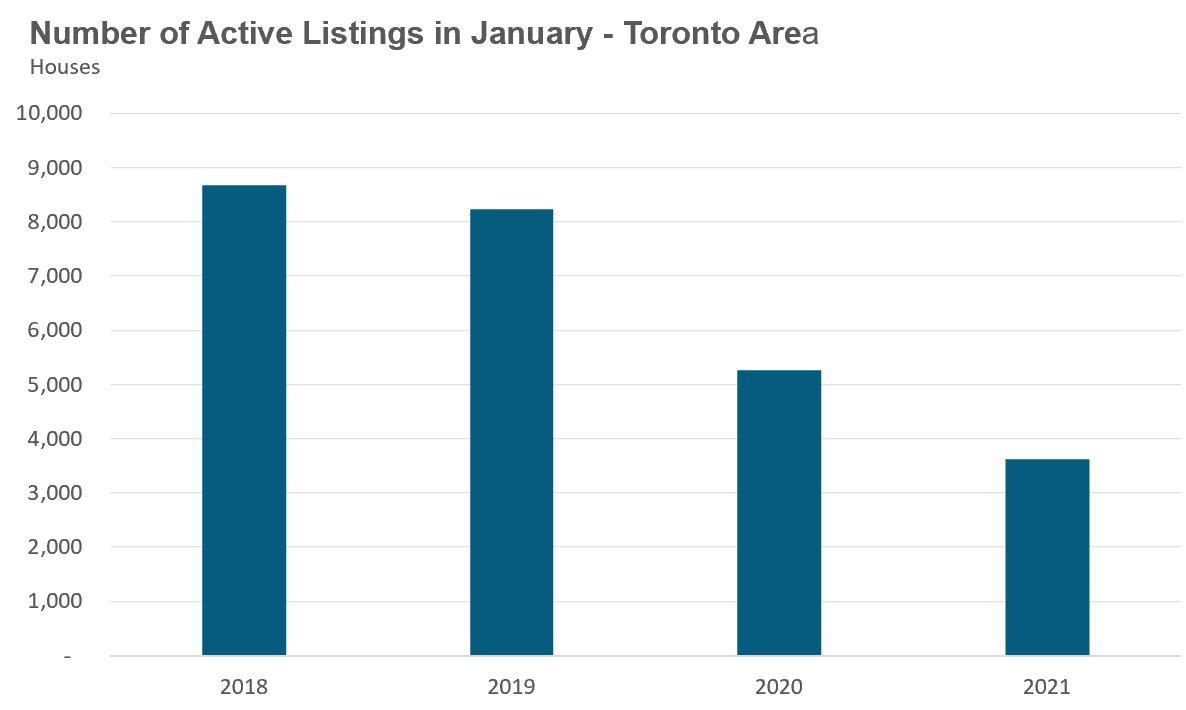
The number of houses available for sale (“active listings”) was down 33% when compared to the same month last year and 54% below the inventory levels seen in 2020. Toronto’s dwindling inventory is partly due to the decline in new listings last month, but the bigger factor is the surge in demand we saw during the second half of 2021.
This acceleration in demand absorbed much of the active inventory in 2021 which means we started the year with fewer active listings from last year. In 2018, for example, we ended the year with just over 8,000 active listings compared to December 2021 where we ended the year with just over 1,500 active listings. The low number of active listings that carried over from 2021 contributed to the tight market conditions at the start the year.
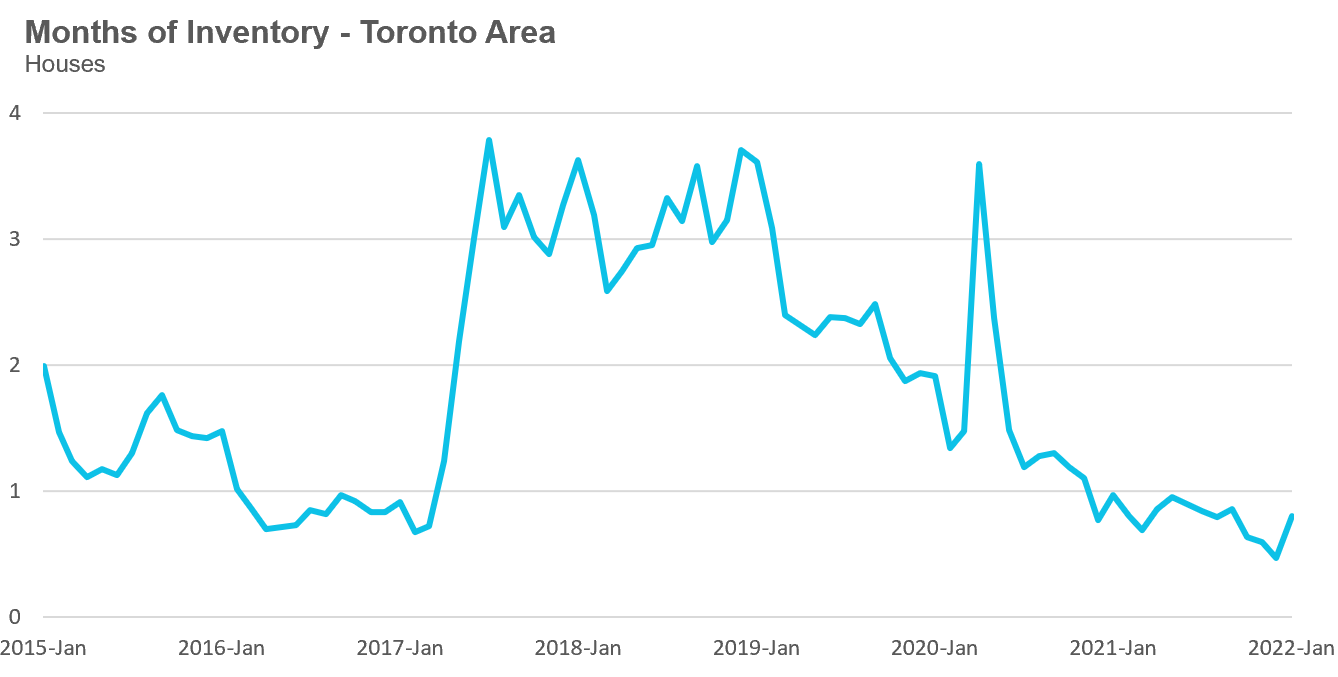
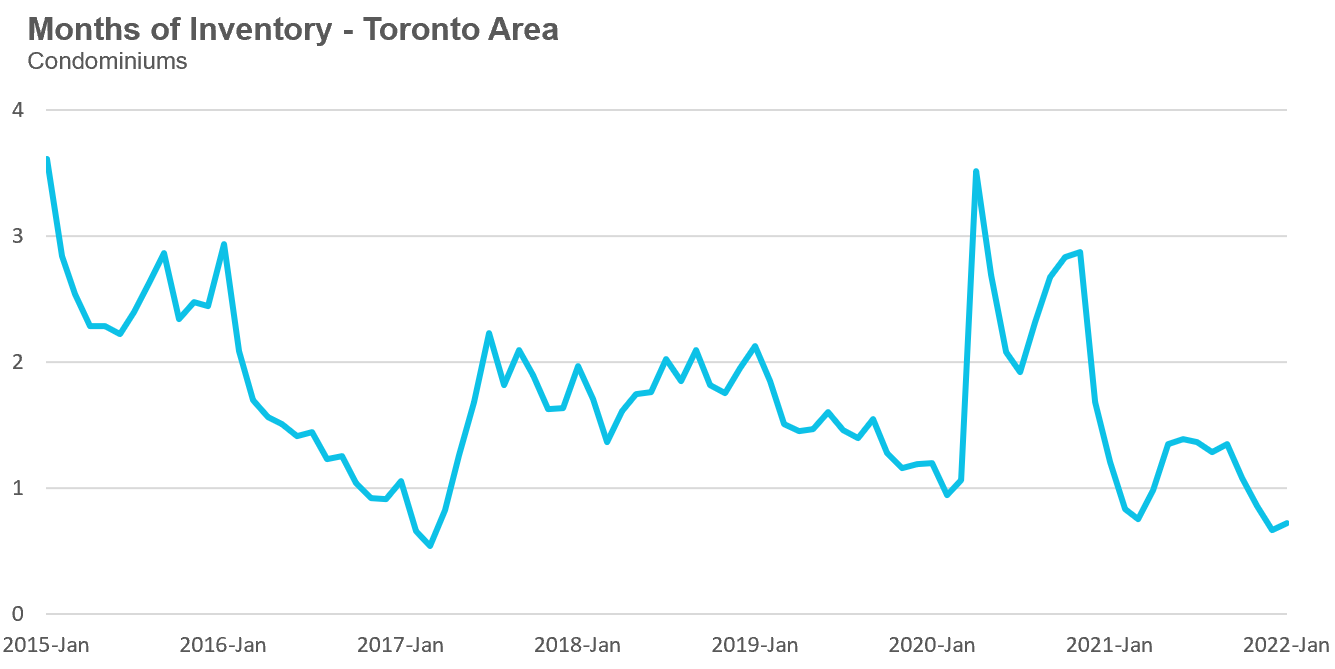
The Months of Inventory ratio (MOI) looks at the number of homes available for sale in a given month divided by the number of homes that sold in that month. It answers the following question: If no more homes came on the market for sale, how long would it take for all the existing homes on the market to sell given the current level of demand?
The higher the MOI, the cooler the market is. A balanced market (a market where prices are neither rising nor falling) is one where MOI is between four to six months. The lower the MOI, the more rapidly we would expect prices to rise.
This January, the market remained very competitive with under 1 MOI.
While the current level of MOI gives us clues into how competitive the market is on-the-ground today, the direction it is moving in also gives us some clues into where the market may be heading. The MOI has been below a very competitive 1 MOI for the past twelve months.
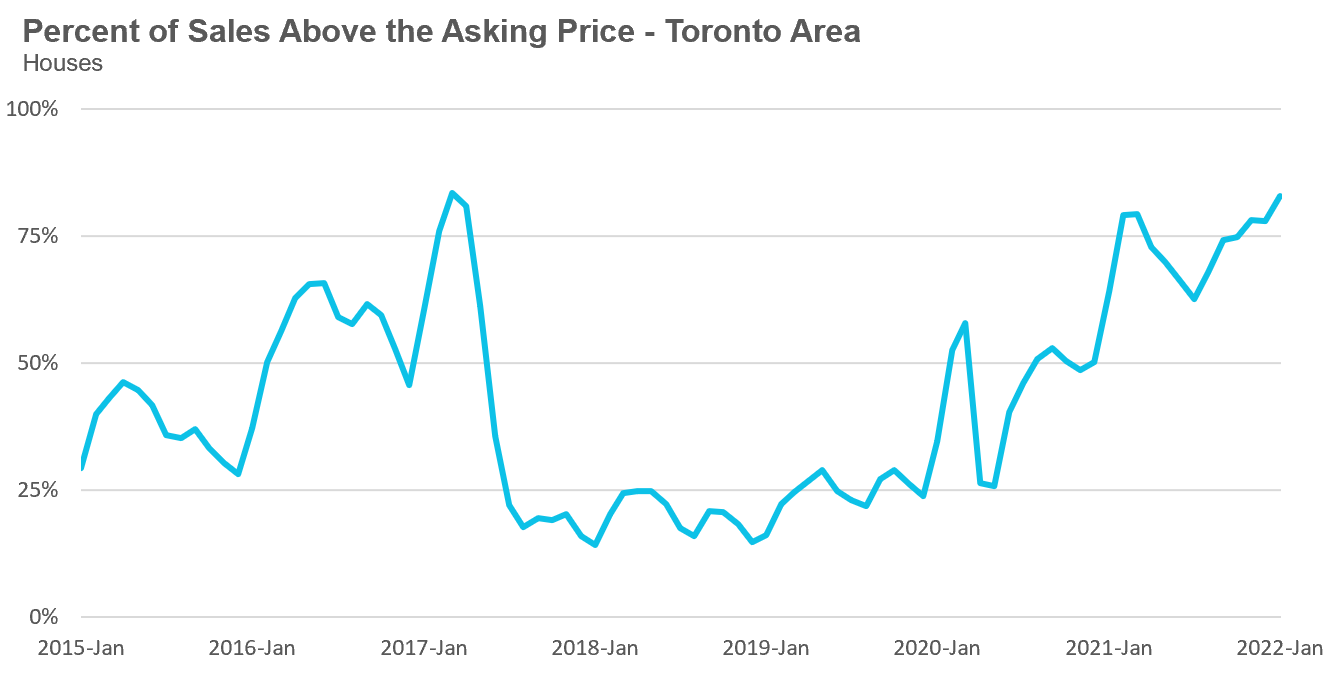
Over the past 5 years, the share of houses selling for more than the owner’s asking price climbed from 68% in August to 83% in January.
After a brief plateau in house prices during the first half of 2021, average house prices have been accelerating since September 2021. The average price for a house has climbed from $1.32M in August to $1.627M in January 2022, a 23% increase in just 5 months and up 28% over last year.
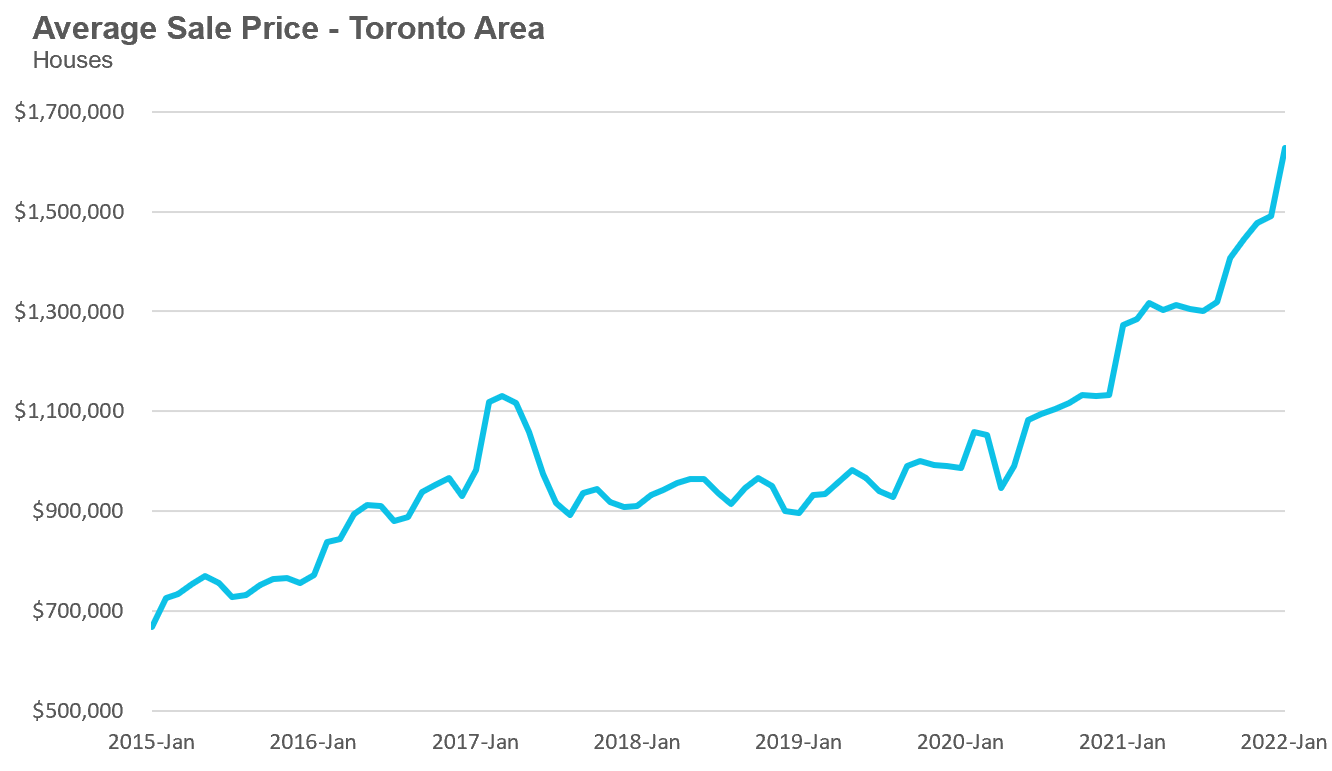
The median house price in January was $1,450,000, up 31% over last year when the median house price was $1,103,500.
The median is calculated by ordering all the sale prices in a given month and then selecting the price that is in the midpoint of that list such that half of all home sales were above that price and half are below that price. Economists often prefer the median price over the average because it is less sensitive to big increases in the sale of high-end or low-end homes in a given month which can skew the average price.
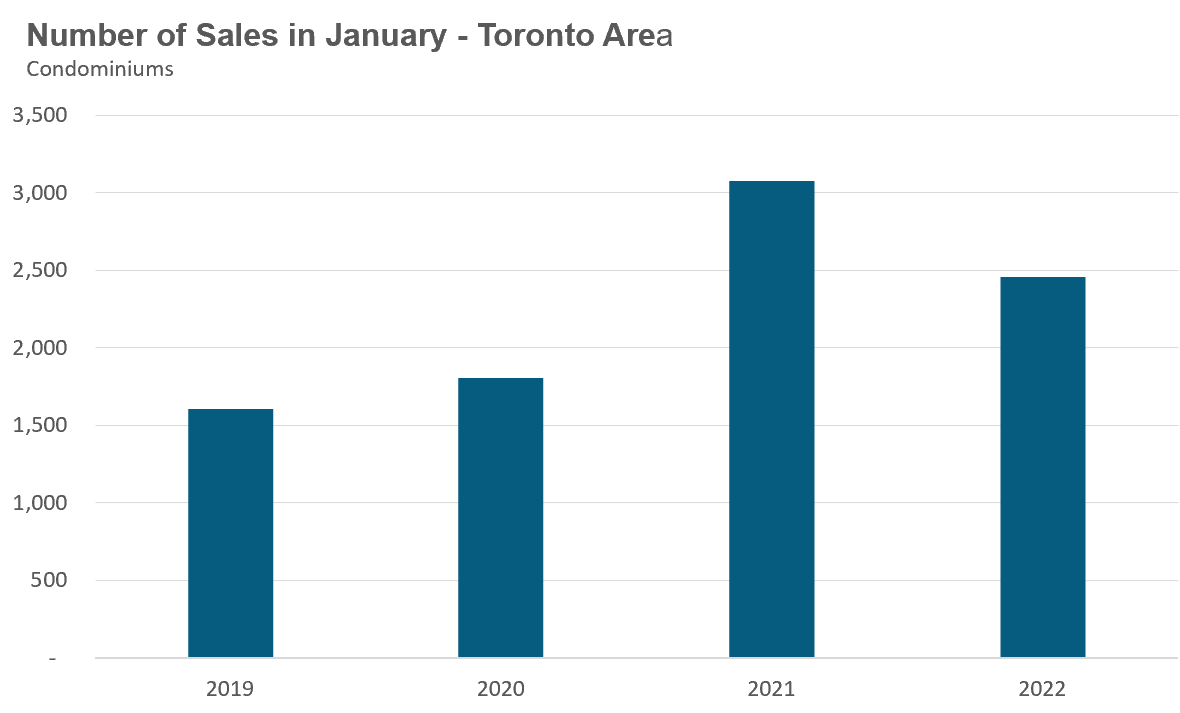
Condo (condominiums, including condo apartments, condo townhouses, etc.) sales in the Toronto area in January 2022 were down 20% over last year and up 26% compared to pre-Covid 2020.
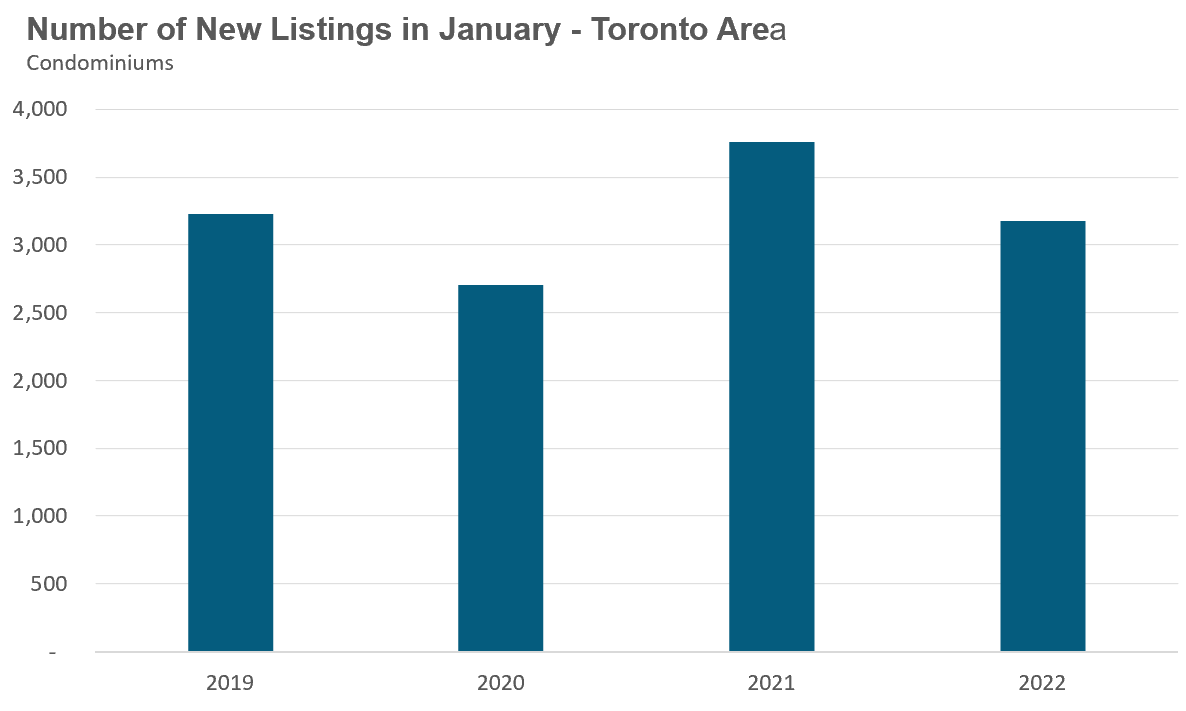
New condo listings were down by 16% in January over last year, but well above the volumes in 2019 and 2020.
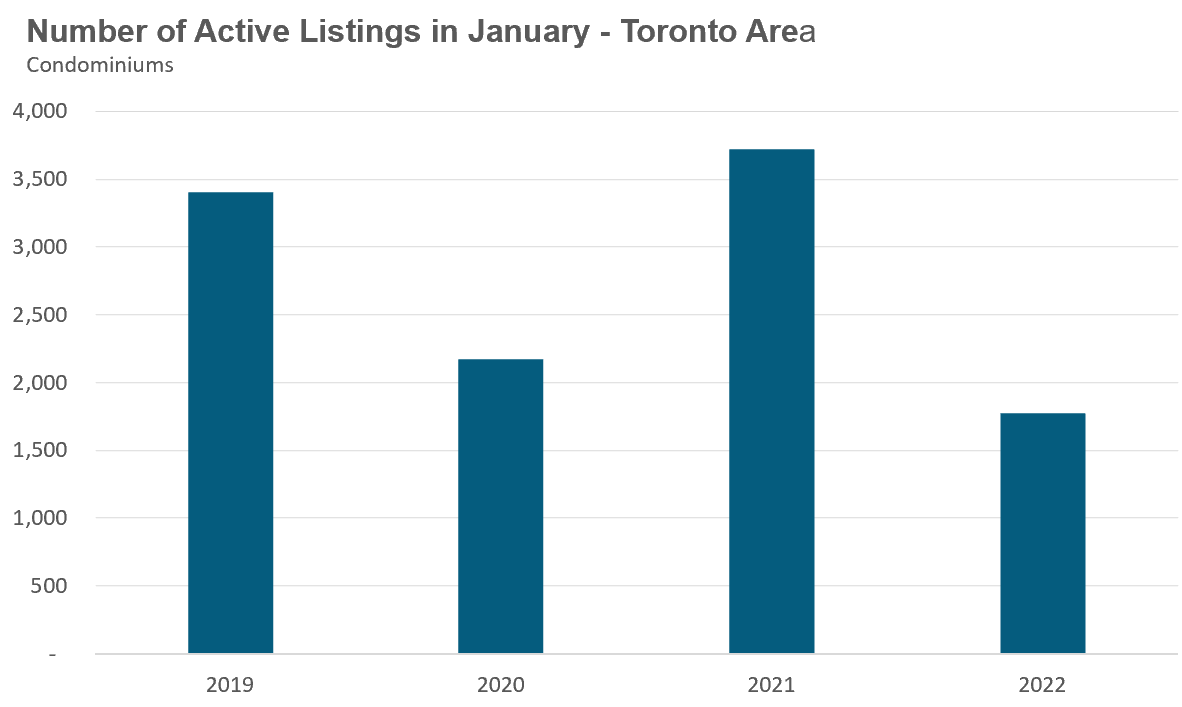
The number of condos available for sale at the end of the month, or active listings, was down 52% over last year, a period that saw a surge in condo listings due to declining prices, falling rents and rising vacancy rates.
The strong demand helped keep the MOI below 1 MOI for the month of January.
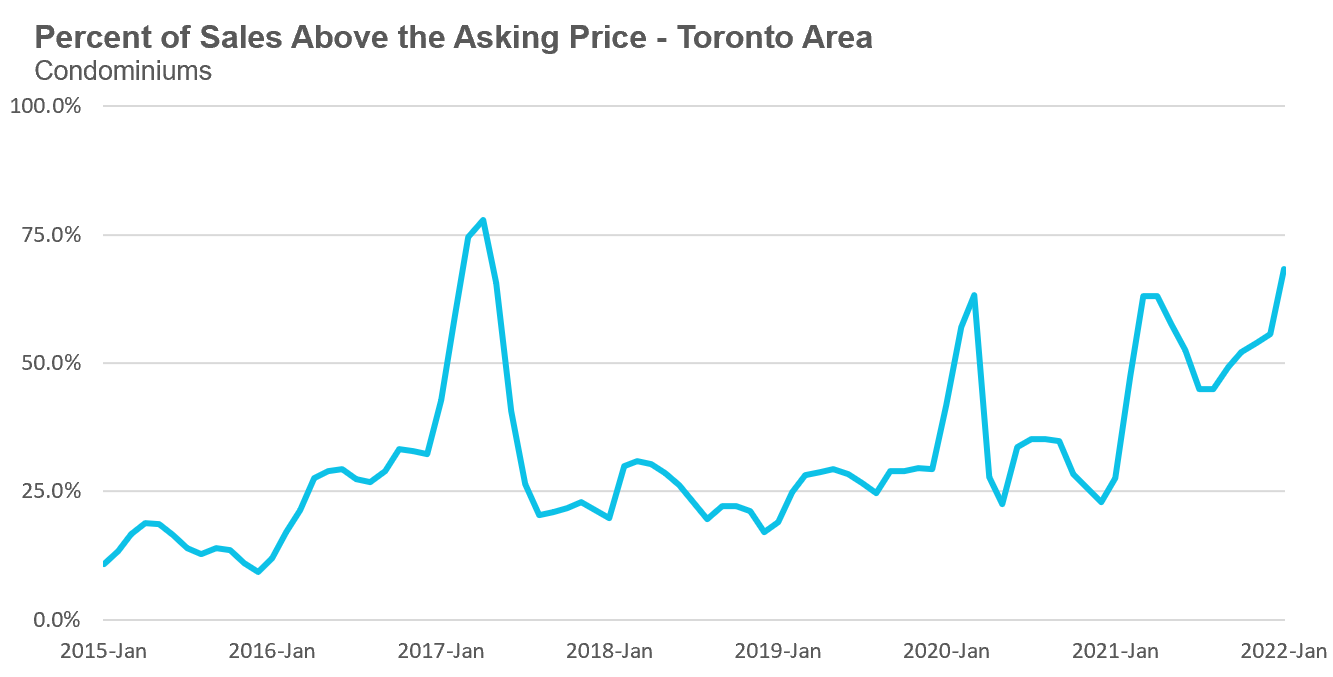
The competition for condos picked up significantly with the share of condos selling for over the asking price rising from 45% in August to 68% in January.
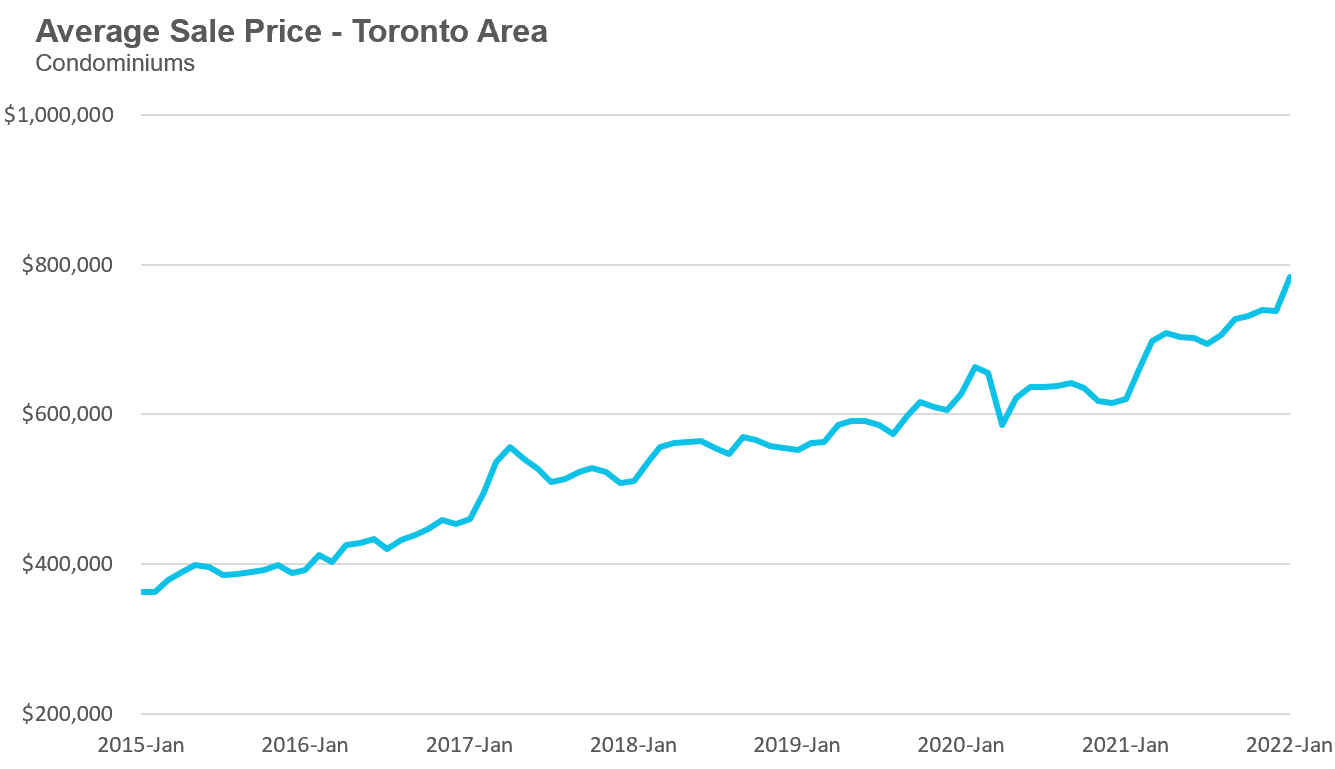
Average condo prices in January reached $783.942, up 26% over last year. The median price for a condo in January was $722,000 up 24% over last year.
Houses
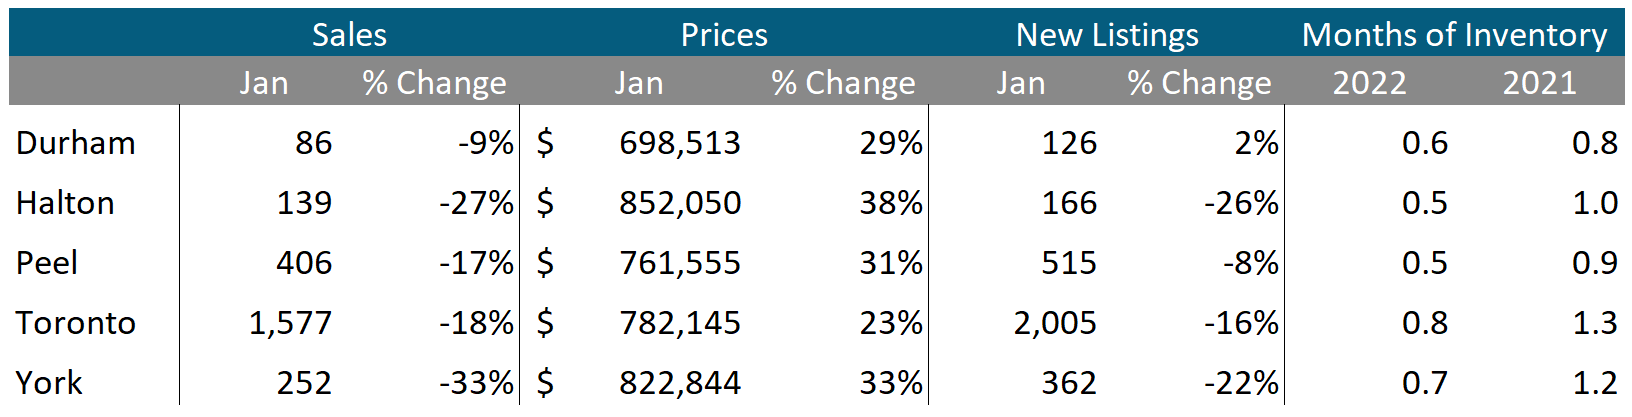
Sales across all five regions in the GTA were down in January while average prices were up on a year-over-year basis. The decline in new listings helped keep the market competitive with MOI below 1 across the entire GTA, indicating a strong seller’s market.
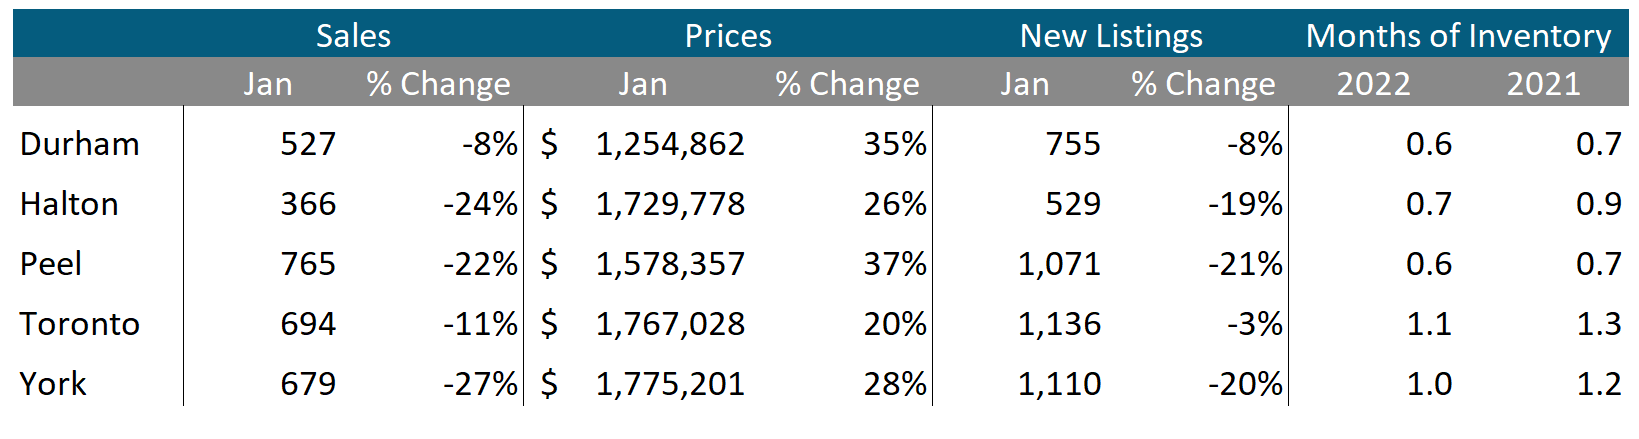
Condos
Condo sales were up in Durham but down across the rest of the GTA in January. Average prices were up double digits in all five regions. Current MOI levels are below 1 across the GTA signalling a strong seller’s market.