


This chart from the National Bank of Canada shows that Canada had the fastest growing population in 2021 when compared to the rest of the G7.
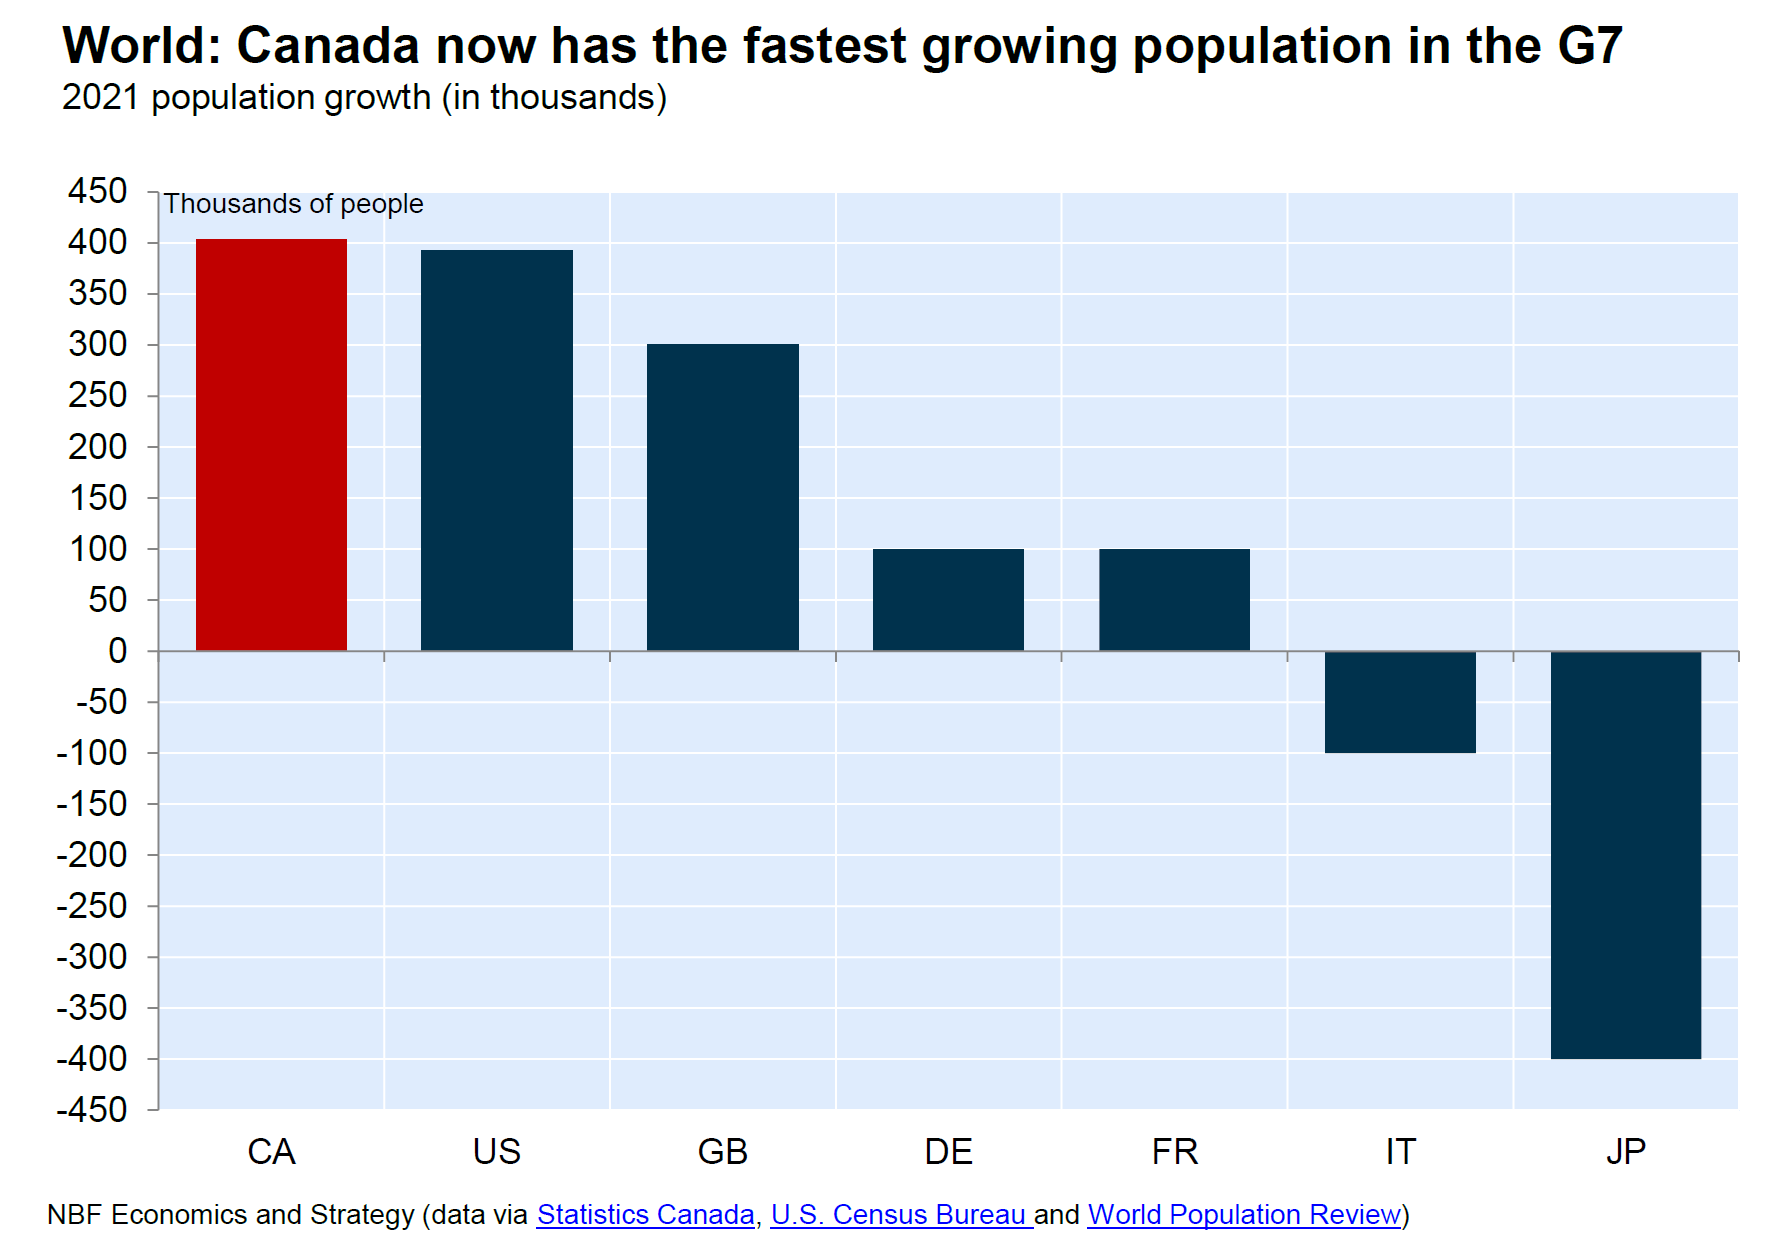
But looking at how fast a country’s population is growing in absolute numbers ignores the fact that some countries are much larger than others. Canada and the US both saw their population grow by roughly 400,000 people, but when we consider that the US is roughly 9X the size of Canada we see that Canada’s population growth rate far exceeds the US.
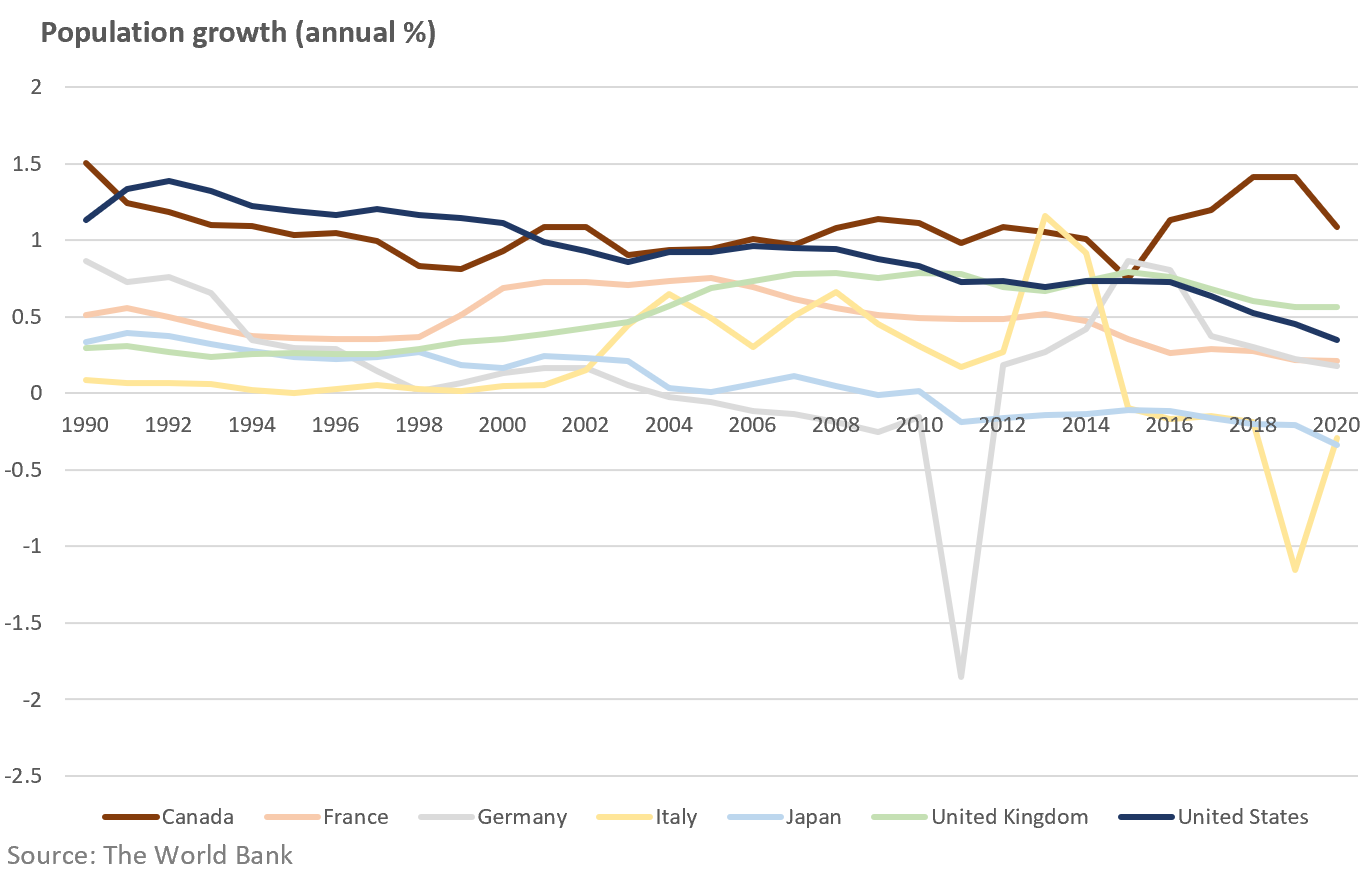
When we consider the population growth rate across the G7, Canada’s population growth has been outpacing the rest of the G7 over the past twenty years, but has really pulled away from every other country since 2016.
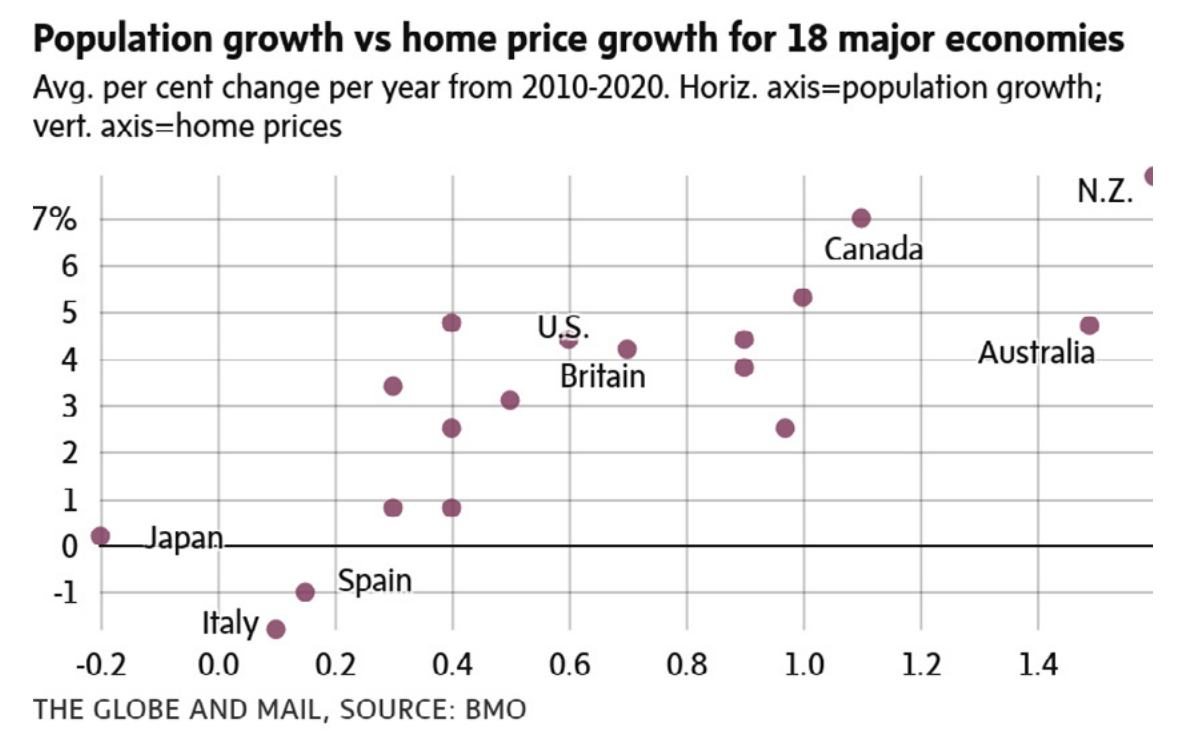
And it’s this boom in Canada’s population that has been a big factor driving up home prices.
The Bank of Montreal analyzed the relationship between population growth and home prices in 18 developed countries and found that countries with the fastest growing populations are also seeing the biggest rise in home prices.
To see why home prices rise more rapidly in countries where population growth is booming we can compare Canada’s historical population growth against our annual new house completions.
The Liberal government under Justin Trudeau has significantly increased Canada’s immigration targets which is why Canada’s population has increased significantly since 2015. As we can see from the chart below, it’s relatively easy for our federal government to increase immigration targets to get Canada’s population growing from 350,000 people per year to over 500,000 virtually overnight.
What’s not so easy, is getting our new home construction industry to instantly respond to this surge in demand for housing by building the roughly 60,000 homes per year that would be needed to meet this additional demand for housing.
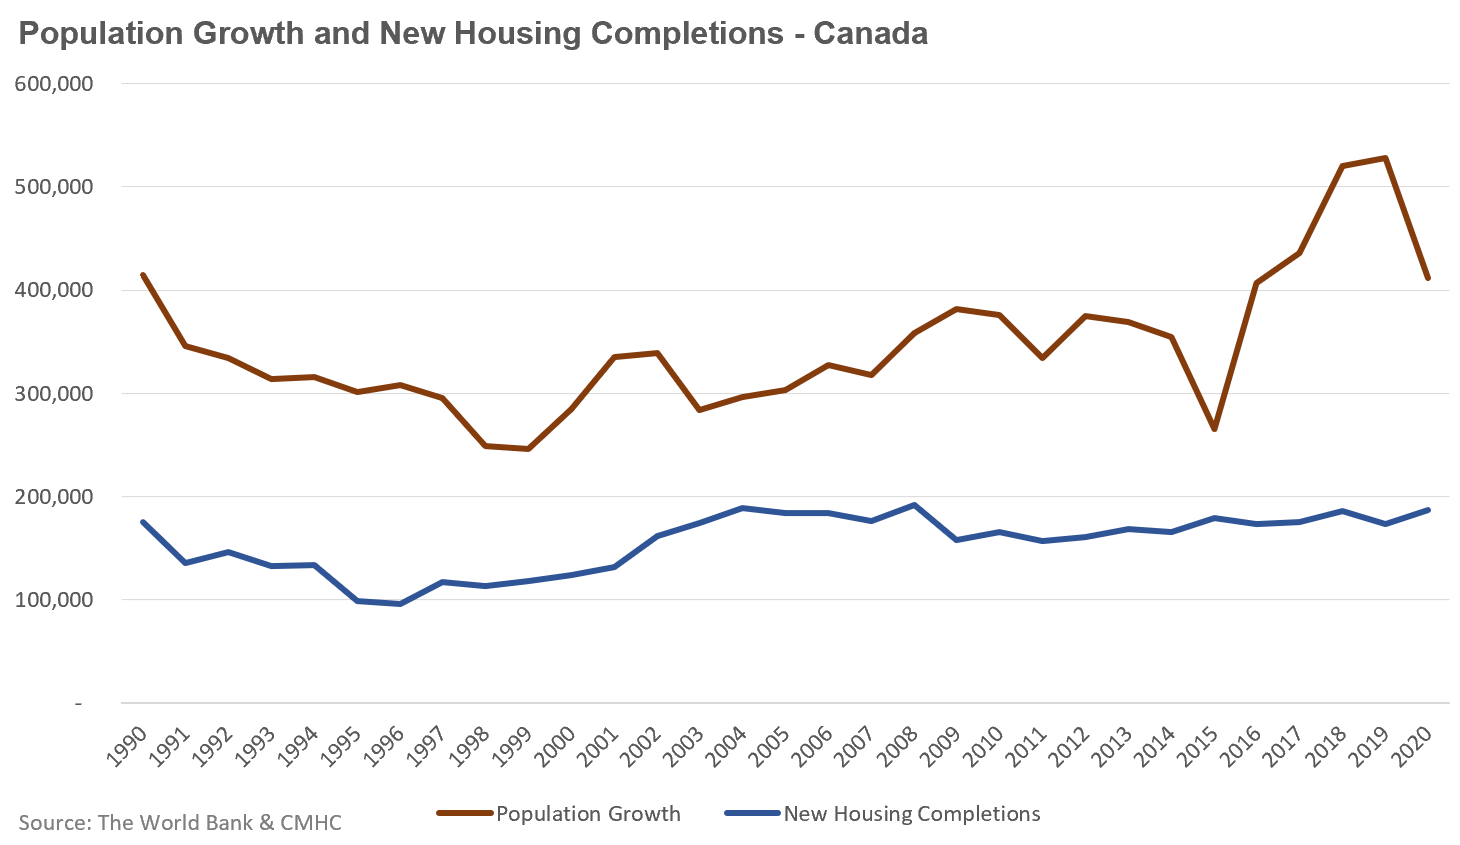
Canada’s new housing completions have been relatively constant since the early 2000s and clearly could not respond fast enough to the Liberal’s population growth targets so the end result is higher home prices.
Many planners and economists seem to believe that the only reason our housing construction hasn’t kept pace with our population growth is because our provinces and municipalities are deliberately preventing more homes from being built through restrictive zoning and bureaucratic red tape and so on.
They argue that if these barriers were removed, our new home construction industry could easily build 60,000 more homes per year (a 35% increase above our ten year average) to accommodate the additional demand for housing thanks to the federal Liberal’s elevated immigration targets.
This unfortunately is an overly optimistic assumption about how quickly new housing can respond to sudden increases in demand. While changes allowing more density and more types of housing are necessary, this alone doesn't result in more homes actually being built.
At least not in the short term.
Federal policy makers should know that the new home construction industry can’t increase their output by 35% overnight and that, per the research, one of the expected consequences of a rapidly rising population in any country is higher home prices.
While the Liberal government might argue that our economy needs this population boom to offset our aging population, our economy also needs affordable homes for these younger generations.
A Perennial Question
The start of a new year is a perfect time to tackle what has become one of the most common — and still important — questions I get about the Toronto area housing market — What’s going to cause the market to cool and when is that finally going to happen?
When most people ask this question, what they want to know is when are prices going to fall, but first we have to think about how the market is going to cool down — going from a market where 3 out of 4 homes are getting multiple offers because there is less than 1 month of available inventory (MOI) to a market where closer to 1 in 4 homes are getting multiple offers and MOI is 2 to 3 months.
In other words — before home prices can go in reverse and actually fall, the market needs to slow down first.
So what might cause the market to slow down?
A cool down in the housing market typically starts with a decline in demand (as opposed to a surge in supply) and I think there are multiple factors that may result in a decline in demand this year.
Coming Buyer Fatigue?
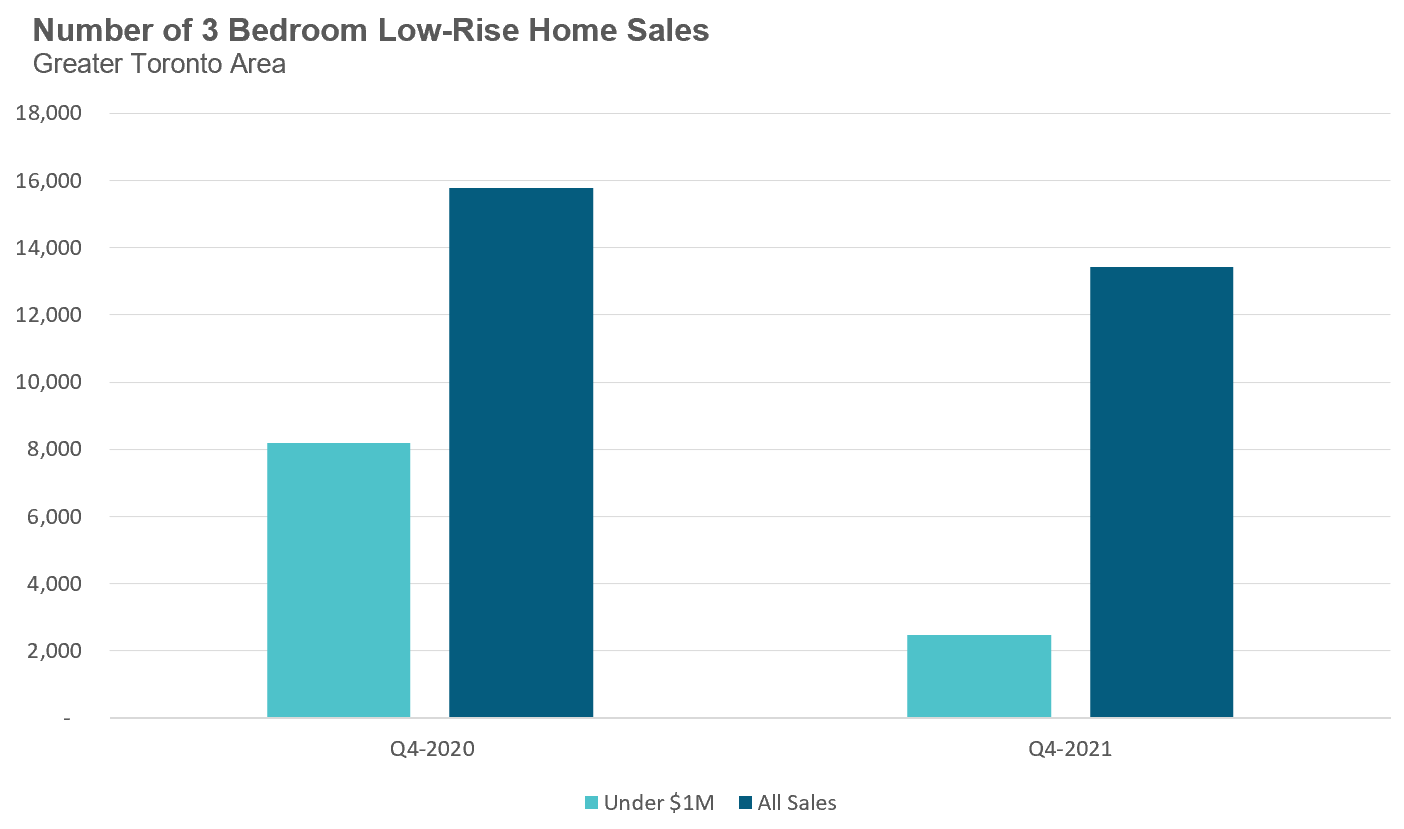
This first factor that could lead to a decline in demand is buyer fatigue due to high home prices. First-time buyers are a big driver of housing demand, and among these buyers, those looking for a 3-bedroom family home are being particularly squeezed.
Buying a home for under $1 million is becoming increasingly difficult and many first time buyers in this price range are losing hope.
The under $1M price point is important to first-time buyers because homes over $1M require a bigger down payment, a minimum of 20% (as compared to as little as 5%). Buyers with less than a 20% down payment in Canada are required to purchase mortgage default insurance through the Canadian Mortgage and Housing Corporation (CMHC) or a private insurer and the maximum home price for this insurance coverage is $999,999. This means that a homebuyer spending $999,999 needs a $75,000 down payment while a buyer spending $1M needs a $200K down payment.
When we look at the number of 3-bedroom houses that sold for under $1M during the final quarter of 2020 vs the same in 2021, we see that the number of sales fell from 8,196 in 2020 to 2,460 in 2021.
While some buyers who were originally looking for a 3 bedroom home might end up buying a condo instead, many families do not consider an 800 square foot condo a substitute for a 3-bedroom home.
Given this, many of these buyers will end up either giving up on the dream of buying a home or will start searching for a home outside of the Greater Toronto Area in cities where homes are more affordable.
It’s worth noting that the federal Liberal government promised to increase the insured mortgage cutoff from $1M to $1.25M during Canada’s last federal election. If the Liberal government follows through with this promise, then the decline in demand I describe above will likely be delayed somewhat since this type of a policy change will stimulate demand. But such a policy move in an already overheated market would be a very misguided one. Policies that stimulate demand and debt are not solutions to housing affordability because they push home prices higher in the short-term, again adding pressure on first-time buyer budgets and leaving them no better off.
A Cap on Investors?
Moving onto another group responsible for significant demand in the market, we come to our second potential cause of a market slowdown. In response to cautions from the Bank of Canada regarding the outsized impact real estate investors are having on the housing market and the risks this presents to Canada’s financial stability, the Liberals have indicated that they are considering an increase in the down payment requirements for investment properties.
If such a change occurs, it would make it harder for investors to buy homes which will take a considerable amount of demand out of the housing market.
Such a policy change would also likely stimulate supply because many of the investors we are seeing today are not actually buying investment properties, but are holding on to their existing home as an investment property when they upsize to a bigger home. Higher down payment requirements make it harder for people to hold onto that existing home, which may have a moderate increase in the supply of new listings.
The Impact of Higher Interest Rates
The other significant factor that may cool demand in 2022 is higher interest rates. Money markets are expecting the Bank of Canada to raise interest rates from 0.25% to 1.5% by the end of the year.
Canada’s mortgage stress test requires buyers to qualify for their mortgage using the greater of the benchmark rate which is currently 5.25% or their actual mortgage rate plus a 2% buffer.
This means that if today’s home buyer is getting a 5-year fixed mortgage at 2.25%, they are actually qualifying using the benchmark rate of 5.25%. If 5-year mortgage rates rise this year to 3.5% then buyers will see their borrowing power reduced slightly because they’ll have to qualify for their mortgage using an interest rate of 5.5%, their mortgage rate plus a 2% buffer.
But where we’ll see the biggest impact of higher interest rates is not with the amount that buyers will qualify to borrow but how much they will be willing to borrow.
Let’s assume for a moment that 5-year mortgage rates go up by just 1% and this has no impact on how much a buyer can borrow — the buyer who qualifies to borrow $800K today with a 2.25% 5-year fixed rate can still qualify to borrow $800K later this year when the rate on 5-year mortgages goes up to 3.25%.
But even though this buyer’s borrowing capacity may not have changed, their borrowing costs have changed considerably. The cost to borrow $800K will increase from just under $3,500 today to just under $3,900 when rates rise to 3.25%. While some buyers will be comfortable spending an extra $400 per month on their mortgage, many will not and will either have to spend less or find themselves priced out of the GTA housing market.
Higher interest rates will also push more real estate investors to the sidelines since record low interest rates were a key driver behind the surge in demand from real estate investors in 2021.
Now, I should stress that even if we do see some or all of these factors arise this year (e.g., buyer fatigue, higher interest rates, tighter credit on investors, etc.), given how competitive the market currently is and how much slack it could take up in terms of reduced demand, I don’t expect to see any on-the-ground impacts on the ground until the second half of 2022.
A Yearly Cooling Pattern
Moving on from special factors, there is a more familiar phenomenon that will likely result in some cooling off of the market later this year, namely the seasonal nature of the real estate market.
The first quarter of every year is typically the most competitive and 2022 will be no different.
Most people assume the spring market is the most competitive because it has the highest number of sales, but it actually contains a few different on-the-ground trends.
Most buyers who want to buy a home in the spring typically start their home search in January or February because they know it will take them several months to buy a home. But the first quarter of every year also has a relatively low number of new listings so we end up with a lot of buyers competing for very few homes available for sale.
As we move toward the spring market, tens of thousands of buyers exit the market because they’ve already bought and thousands more homes get listed which means the market tends to be very busy, but less competitive than it is in the tighter market conditions at the start of the year.
This yearly trend will continue in 2022, and will likely be worse than in previous years given the low inventory currently available for sale. If the market does return to these familiar yearly patterns, we should start to see some cooling by late spring to early summer.
Cooling Down is Not Falling — Yet
All of the above factors may result in the cooling of the market, but as I discussed above, this doesn’t mean that prices are going to fall right away. Given how hot the market is in favour of sellers, what we will first see in the event of cooling is a gradual move to a more balanced market.
So when will we see a correction in home prices? While nobody knows for sure when the market might continue to cool to the extent that it would favour buyers and see prices fall, there are a few things for us to be mindful of.
One additional factor that real estate analysts and economists consider when trying to determine where a market might go next is the extent to which it may be ‘in a bubble’ at present. A simple explanation of a bubble is when a market is seeing prices that are higher than what ‘fundamentals’ like, for example, the rates of economic, income and population growth, etc., suggest they should be.
Last month, I discussed why a surge in investors buying single family homes has the Bank of Canada worried about bubble-like symptoms in our housing market, a concern I share with them. But I also mentioned that bubble-like booms in house markets can go on longer than we think and predicting when they’ll end is very difficult.
Predicting when they will burst has been a long standing puzzle for economists. In 1957, economist Paul Samuelson wrote:
Every bubble is someday pricked. But I have long been struck by the fact, and puzzled by it too, that in all the arsenal of economic theory we have absolutely no way of predicting how long [a bubble] will last. To say that prices will fall back to earth after they reach ridiculous heights represents a safe but empty prediction. Why do some manias end when prices have become ridiculous by 10 per cent, while others persist until they are ridiculous to the tune of hundreds of per cent?
I believe the reason predicting the end is so difficult is that bubbles, as Samuelson points out, are manias. They are not periods where markets are rational and driven by predictable fundamentals, but rather by exuberance and people’s optimistic beliefs about the future direction of home prices as economists Karl Case and Robert Shiller noted in 1988 after studying the behaviour of buyers in boom and post-boom housing markets.
When Beliefs Change
This means that predicting the end of a bubble really comes down to predicting when beliefs about the future direction of house prices will change from optimistic to cautious and then pessimistic. This is the most important thing any potential home buyer should be keeping an eye on — a shift in how people are talking about the housing market.
This is precisely what happened when home prices fell in Toronto’s suburbs in 2017. After bubble-like appreciation in home prices in 2016 and the first quarter of 2017, buyers and sellers suddenly became very pessimistic about the housing market when the provincial government announced plans to introduce a foreign buyer tax. There weren’t actually enough foreign buyers in Toronto to have been deterred to cause the subsequent crash in the market, but more widespread fears about these buyers turning away proved enough to spur falling home prices. Though the fall eventually plateaued, suburban home prices remained sluggish for the next two years.
So the factor we need to consider is what might cause a change in beliefs about our housing market today?
This, of course, is the million dollar question!
The truth is, nobody really knows. But again there are a few potential catalysts we should keep an eye out for.
A shift in government policy is one. As I just mentioned, prices fell in 2017 largely because people were worried prices would fall after the province introduced a foreign buyer tax.
If policy makers introduce a number of new policies aimed at cooling the market and if buyers and sellers worry these policies will cause prices to fall, this could shift beliefs. And it doesn’t matter if the policy is significant enough to actually cause a decline, what matters is if buyers and sellers believe it might cause prices to fall.
Now while I mentioned earlier that the Liberal government is considering increasing the down payment requirements on investment properties, I don’t expect such a policy to have the same type of dramatic impact on beliefs as we saw in 2017 with Ontario’s foreign buyer tax. In 2017, Torontonians first saw a similar tax introduced in BC which saw prices fall in the Vancouver area, which gave more impetus to such fears. The conditions now are far different and I do not expect our federal government to want to encourage such strong reactions (for reasons I’ll discuss below).
Another catalyst could be extreme buyer fatigue. If potential home buyers decide, in significant numbers, to not buy a home because home prices are just too high, this could have a sudden shift in the balance of the market.
This would effectively be the opposite of the unexpected surge in demand in the summer of 2020 after Ontario’s first Covid-19 lockdowns between March and May of that year. Most economists and real estate professionals, including many that we spoke to at our 2020 online Summit, did not expect buyers to rush into the housing market in significant numbers given the uncertainty caused by Covid-19, and yet that is precisely what happened.
But the opposite could also happen, and what has gone up could come down if buyers start to give up and walk away from the unbelievably high home prices in the Toronto area.
Similarly, the counterpart to buyer fatigue is investor disbelief — the belief that home prices have hit a peak and can't go any higher.
So When Will Prices Actually Fall?
Something we often hear alongside discussions of whether our housing market is in a bubble is that of a magical “soft-landing” — a period in which home prices level off gradually, which sounds like a great outcome for both would-be home buyers and home owners and sellers that wouldn’t see their home prices fall by much.
But this “soft-landing” is often no more than wishful thinking.
“Bubbles will last longer than you think, but they don't correct by going sideways.”
- David Rosenberg
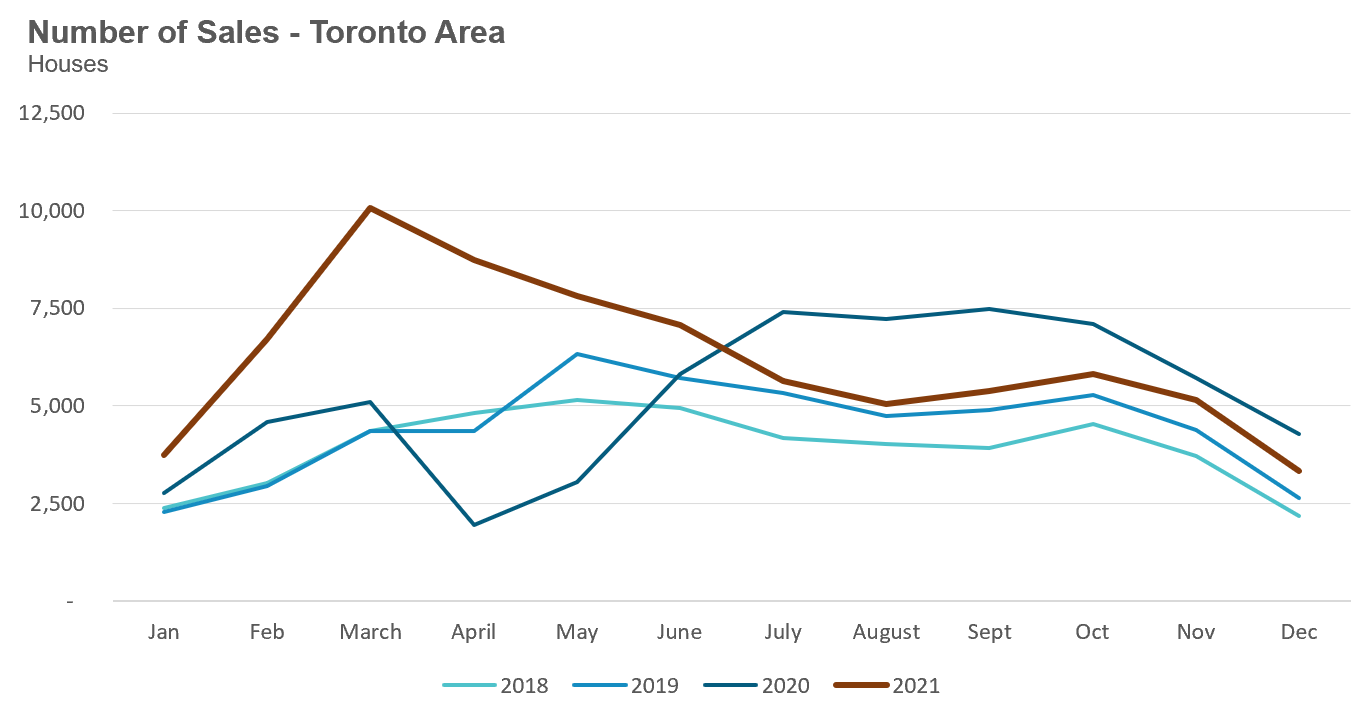
House sales (detached, semi-detached, townhouse, etc.) in the Toronto area in December 2021 were down 22% over the same month last year, but were above levels for the same month in pre-Covid 2018 and 2019.
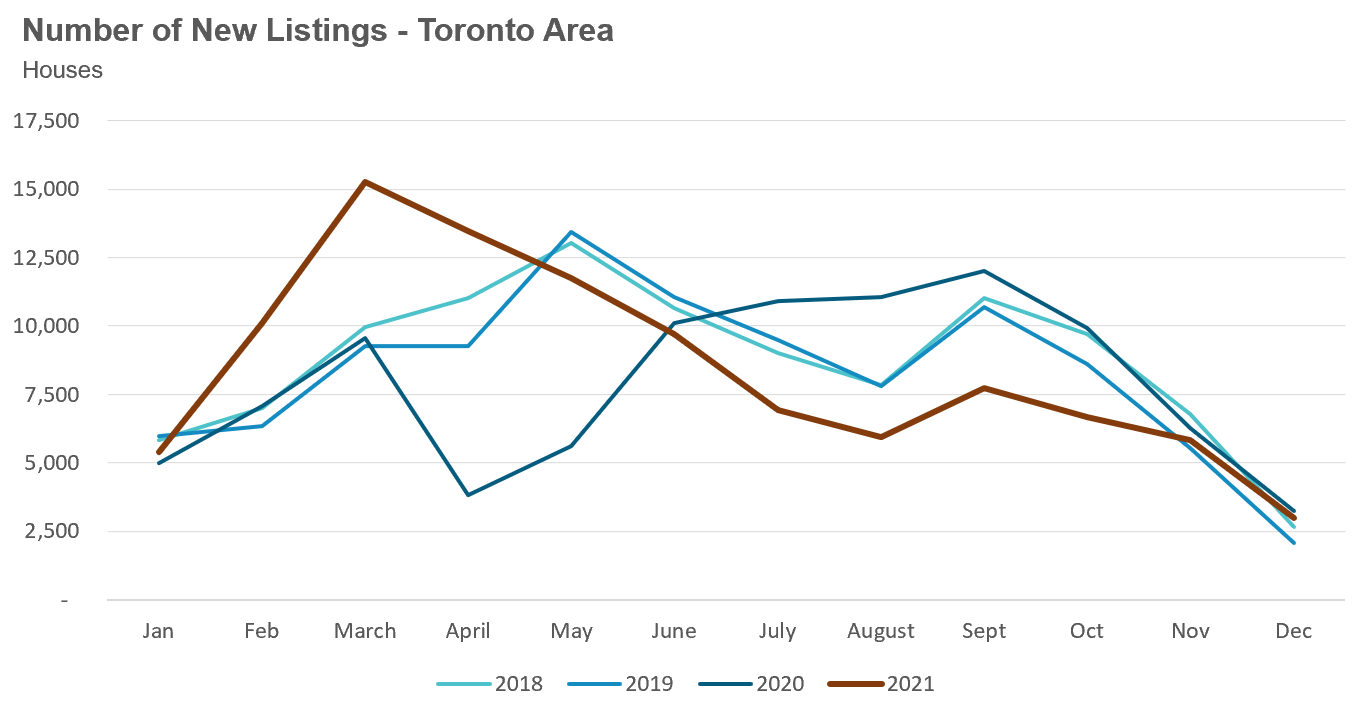
New listings in December were down 7% over last year, but slightly ahead of new listings volumes seen in 2018 and 2019.
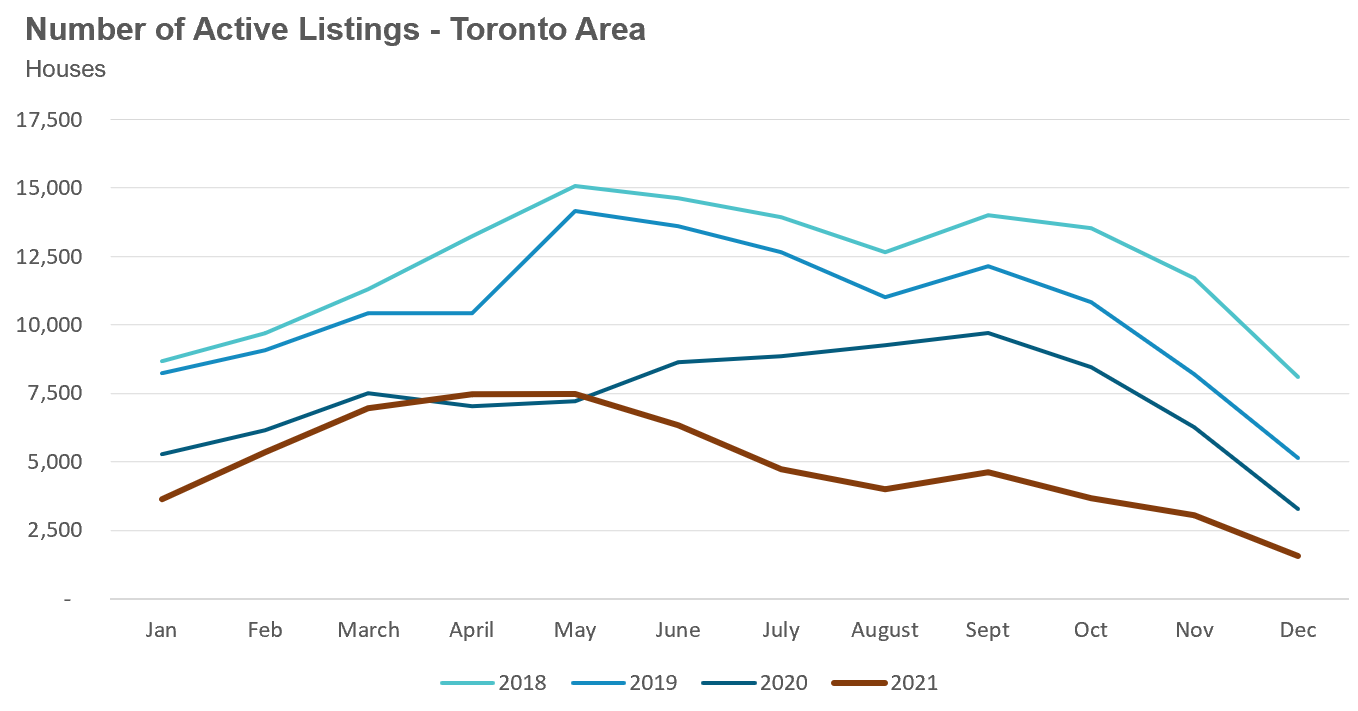
The number of houses available for sale (“active listings”) was down 52% when compared to the same month last year and 69% below the inventory levels seen in pre-Covid 2019.
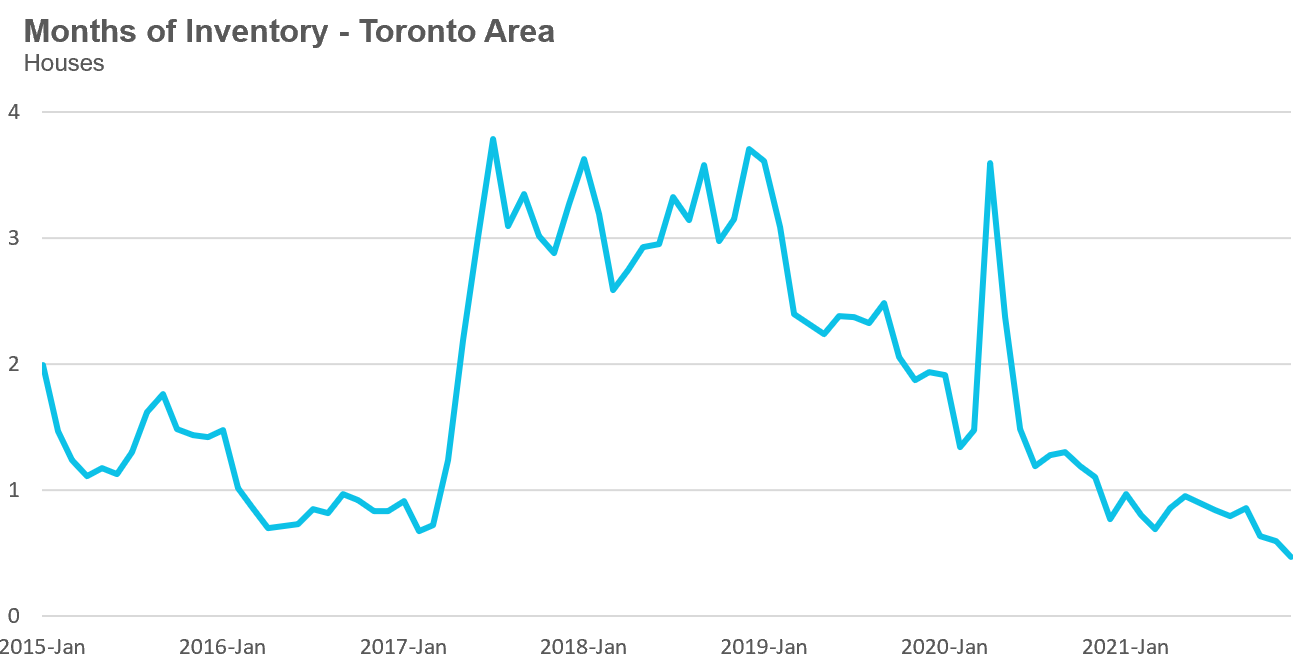
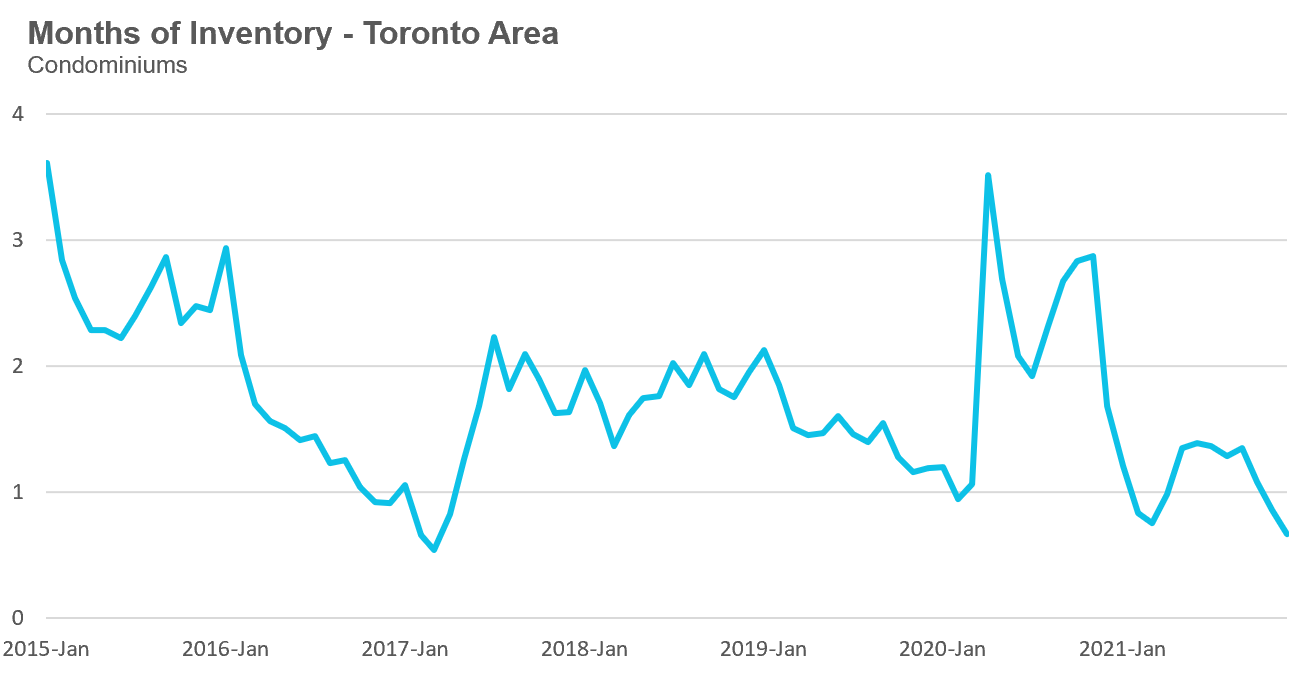
The Months of Inventory ratio (MOI) looks at the number of homes available for sale in a given month divided by the number of homes that sold in that month. It answers the following question: If no more homes came on the market for sale, how long would it take for all the existing homes on the market to sell given the current level of demand?
The higher the MOI, the cooler the market is. A balanced market (a market where prices are neither rising nor falling) is one where MOI is between four to six months. The lower the MOI, the more rapidly we would expect prices to rise.
This December, the market remained very competitive with the MOI at 0.5 months.
While the current level of MOI gives us clues into how competitive the market is on-the-ground today, the direction it is moving in also gives us some clues into where the market may be heading. The MOI has been trending down below a very competitive 1 MOI for the past twelve months.
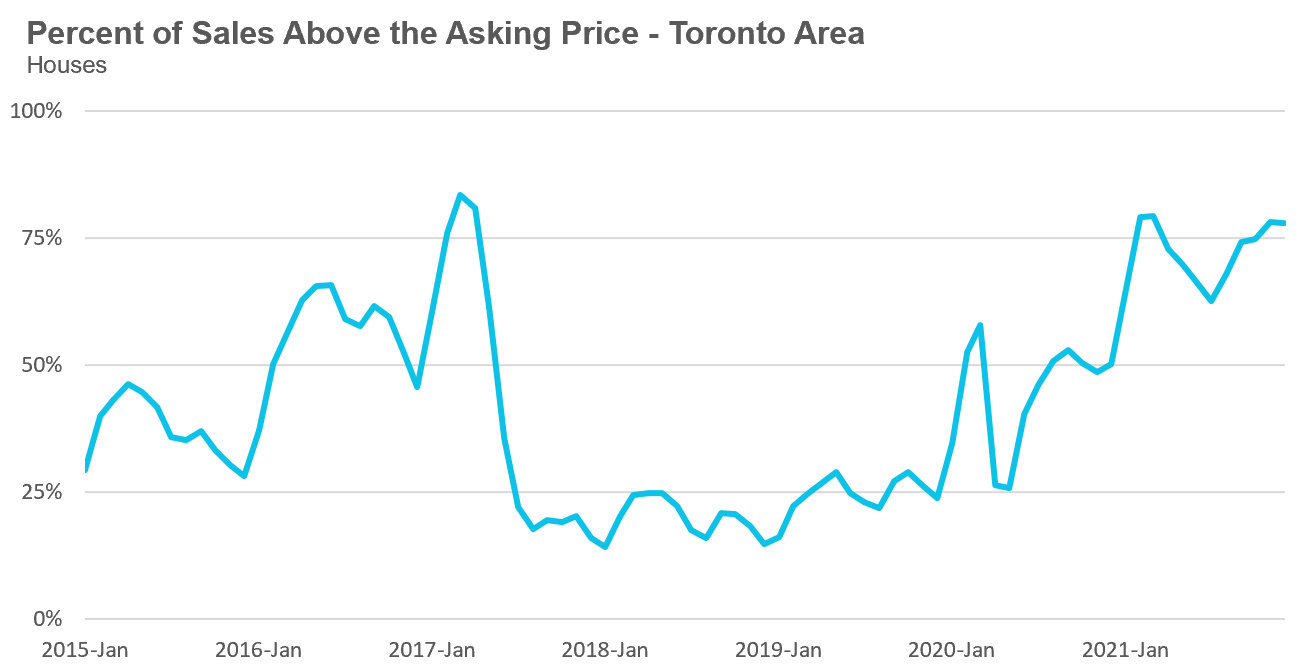
The share of houses selling for more than the owner’s asking price climbed from 68% in August to 78% in December.
Average house prices had plateaued in 2021, remaining relatively constant in the $1.3M range since the start of the year, up to this September, when average prices surged above $1.4M and continued to climb in December to $1,491,134, up 32% over last year.
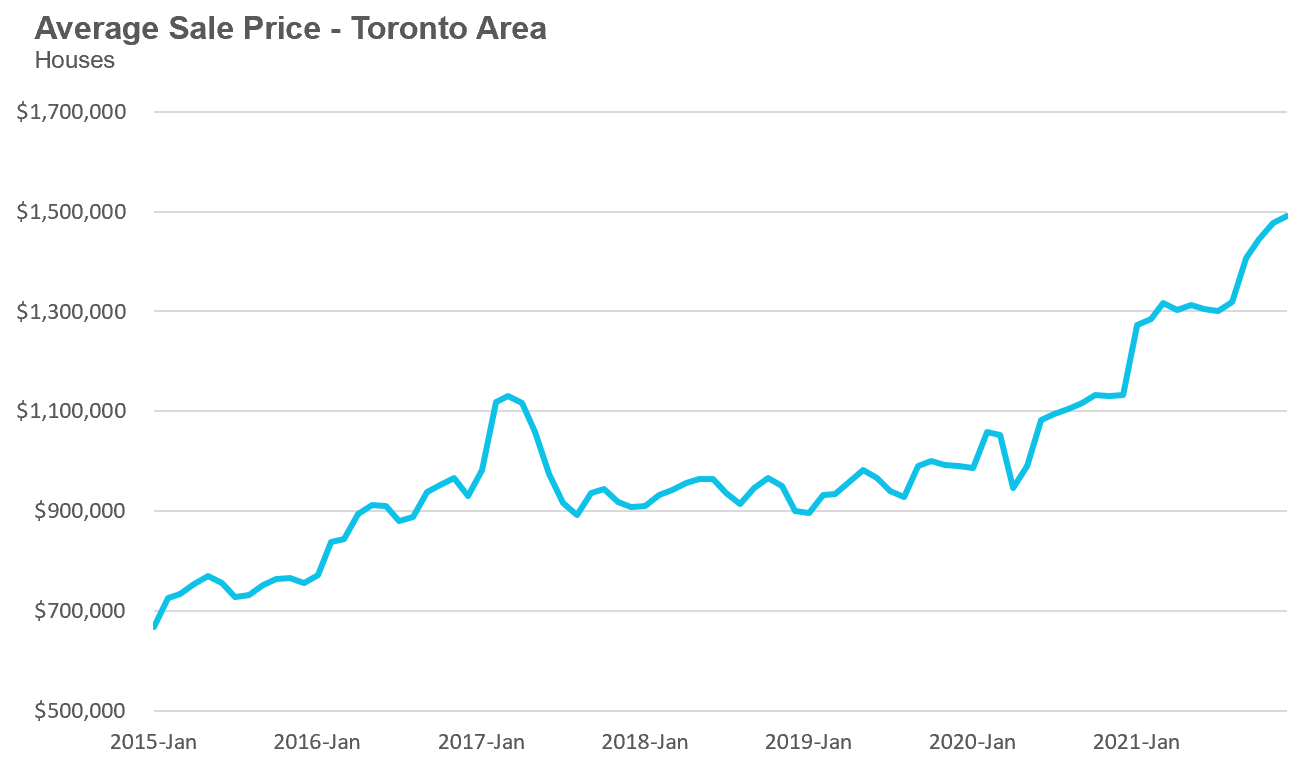
The median house price in December was $1,320,000, up 35% over last year.
The median is calculated by ordering all the sale prices in a given month and then selecting the price that is in the midpoint of that list such that half of all home sales were above that price and half are below that price. Economists often prefer the median price over the average because it is less sensitive to big increases in the sale of high-end or low-end homes in a given month which can skew the average price.
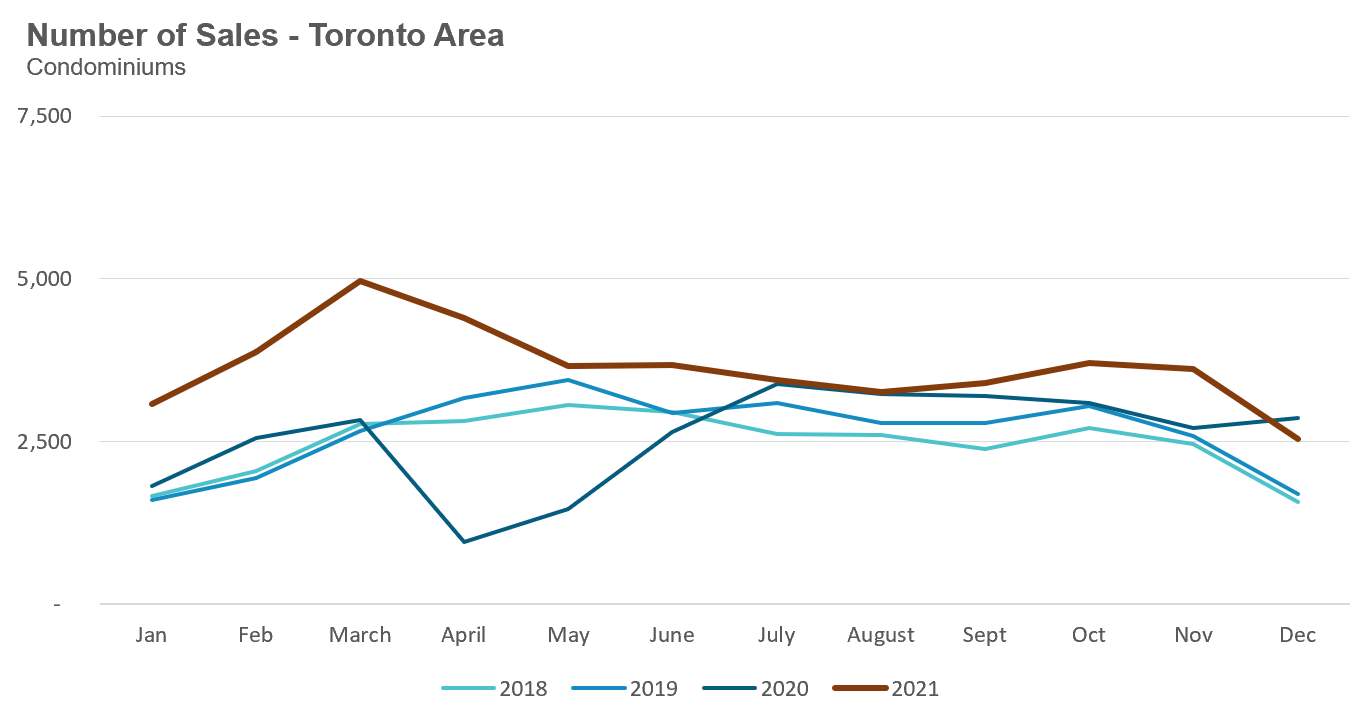
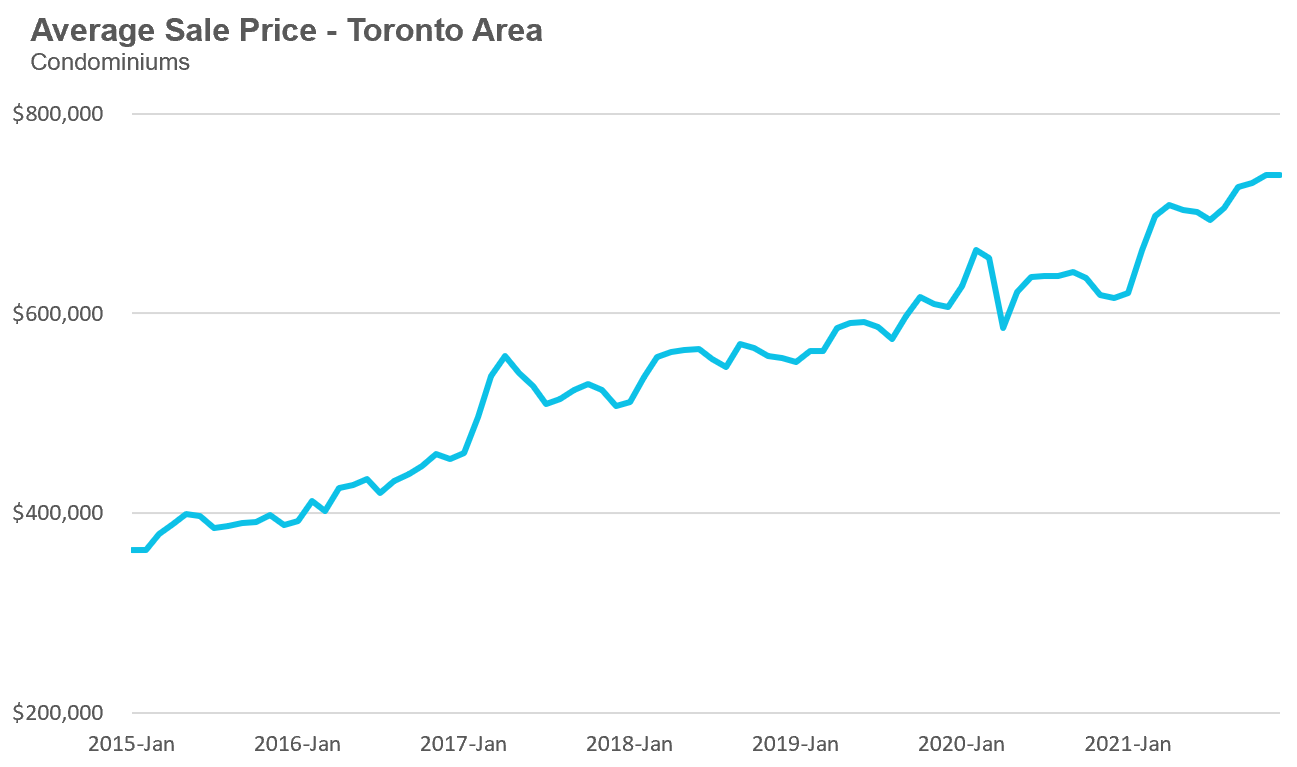
Condo (condominiums, including condo apartments, condo townhouses, etc.) sales in the Toronto area in December 2021 were down 11% over last year and up 50% compared to pre-Covid 2019.
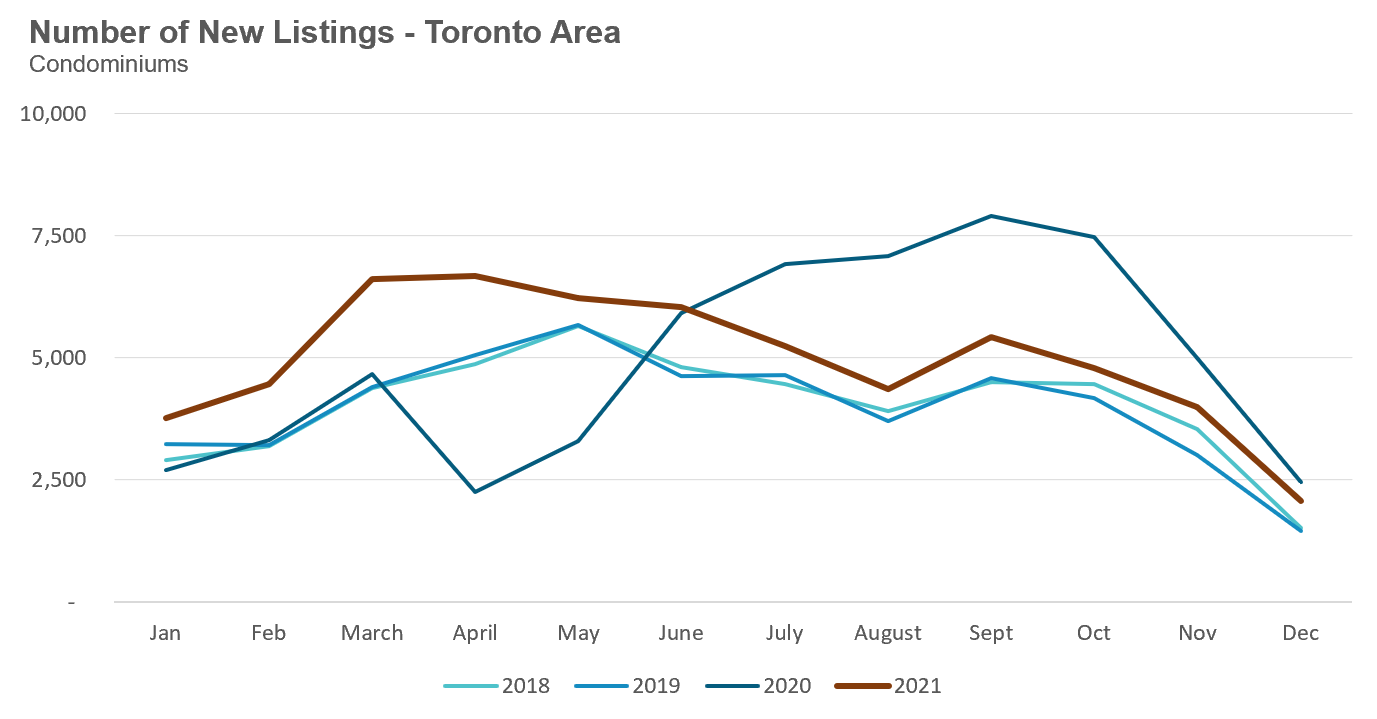
New condo listings were down by 16% in December over last year, but above the volumes in 2018 and 2019.
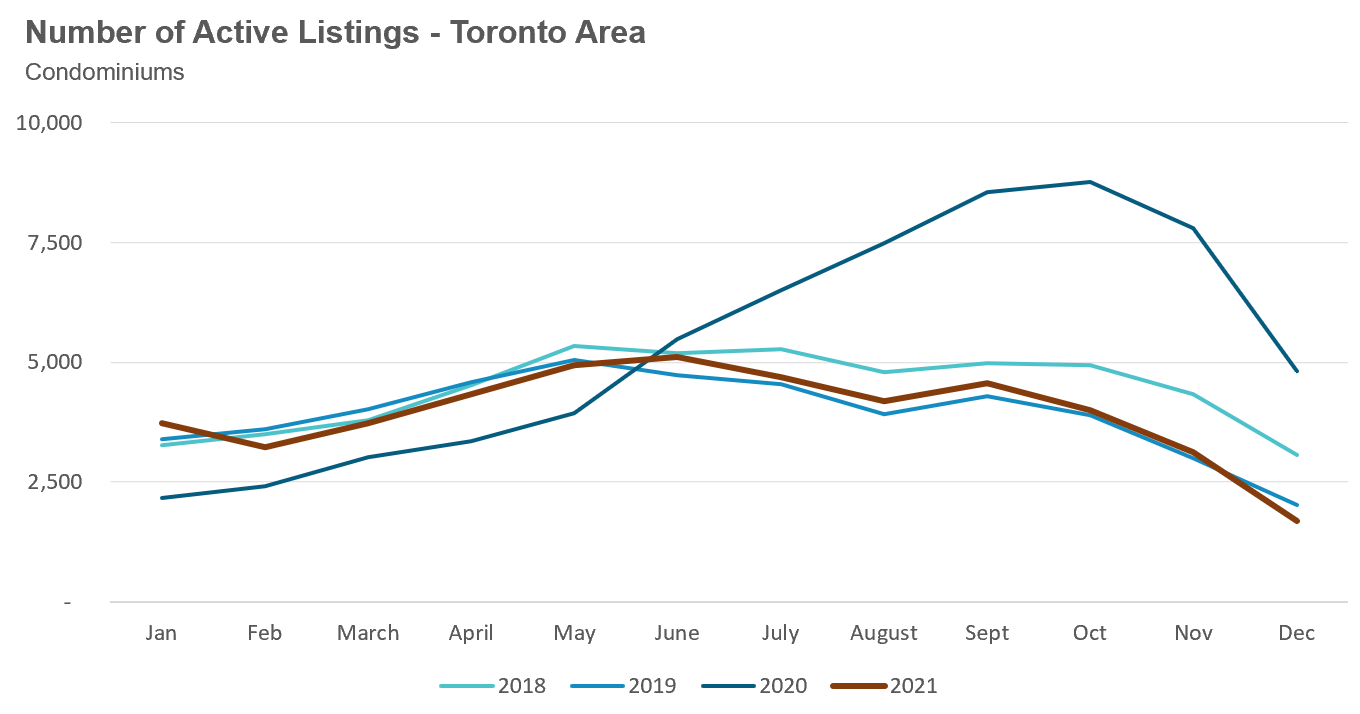
The number of condos available for sale at the end of the month, or active listings, was down 65% over last year, a period that saw a surge in condo listings due to declining prices, falling rents and rising vacancy rates.
The strong demand helped push the MOI down to just 0.7 MOI for the month of December.
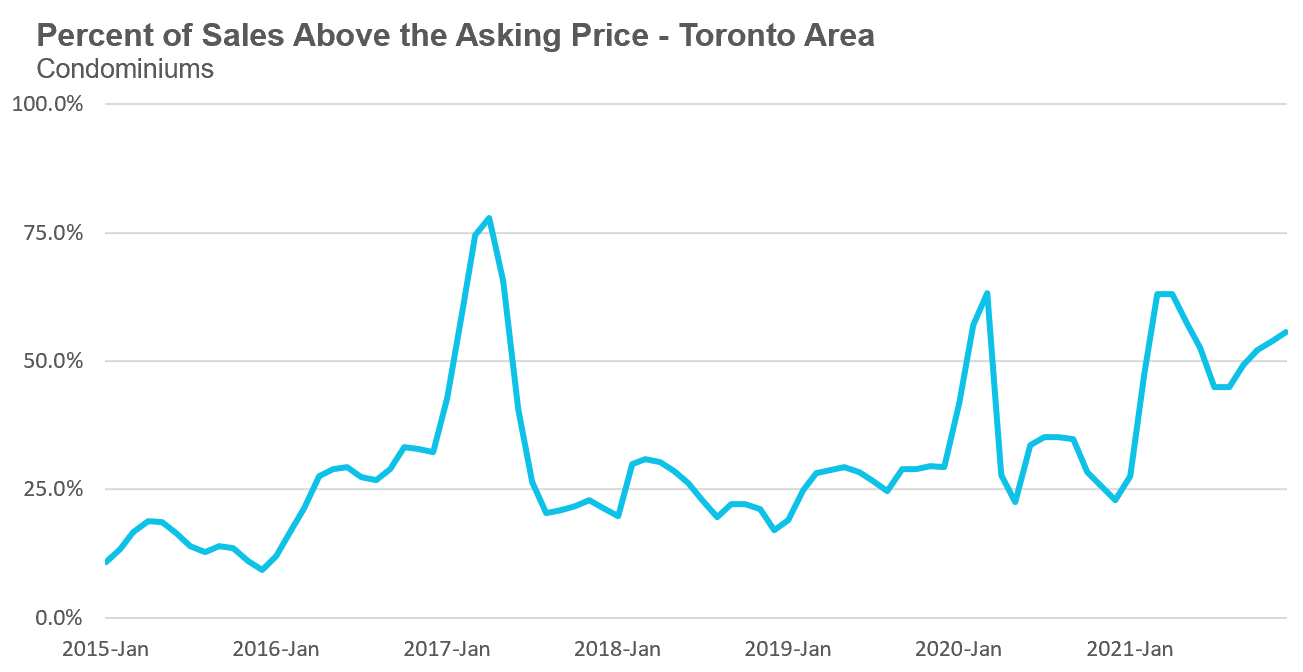
The competition for condos picked up very slightly with the share of condos selling for over the asking price rising from 45% in August to 56% in December.
Average condo prices had plateaued at approximately $700K for most of 2021, but have increased over the past two months. The average price for a condo in December reached $738,302, up 20% over last year. The median price for a condo in December was $675,000 up 19% over last year.
Houses
Sales across all five regions in the GTA were down in December while average prices were up on a year-over-year basis. The decline in new listings helped keep the market competitive with MOI below 1 across the entire GTA, indicating a strong seller’s market.
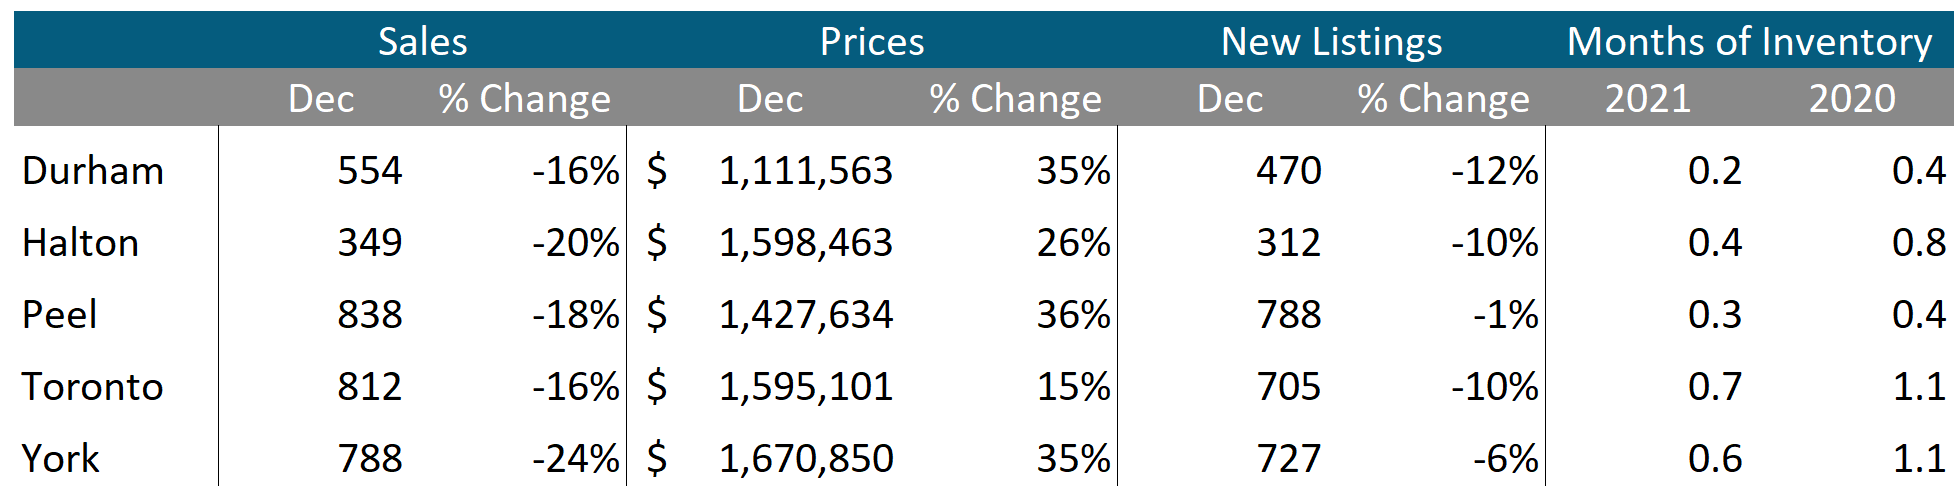
Condos
Condo sales were up in Durham but down across the rest of the GTA in December. Average prices were up double digits in all five regions. Current MOI levels are below 1 across the GTA signalling a strong seller’s market.
