FREE PUBLIC WEBINAR: WATCH REPORT HIGHLIGHTS & Q/A - Thursday May 11th 12PM ET

Join John Pasalis, report author, market analyst and President of Realosophy Realty, in a free monthly webinar as he discusses key highlights from this report, with added timely observations about new emerging issues, and answers your questions. A must see for well-informed Toronto area real estate consumers.
At the start of 2023, if you had asked anyone what the biggest risk facing Toronto’s housing market was, the most likely response would have been a further decline in home prices due to higher interest rates leading to a massive slowdown in sales.
But Toronto’s real estate market had other plans for 2023.
As I first highlighted in my February 2023 report, the market started the year hotter than expected and since then, it has remained increasingly competitive.
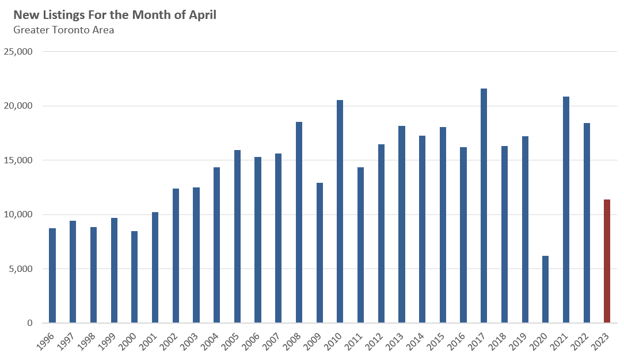
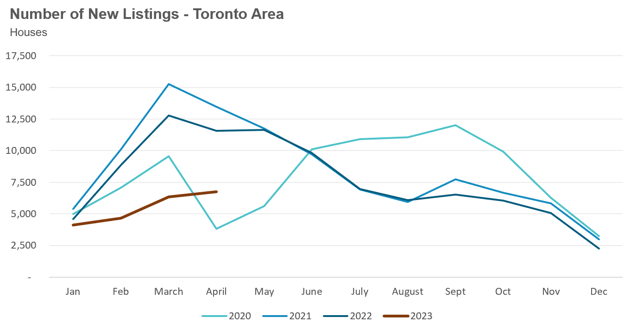
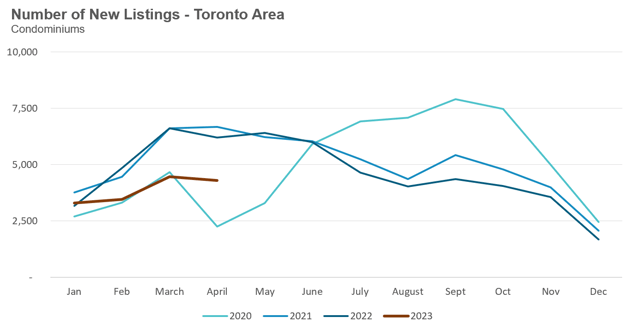
While the demand for homes has picked up in 2023 as compared to the second half of 2022, the primary driver of the competition we are seeing today is not booming demand but dwindling supply. The number of homes listed for sale in the Toronto area in April was down 38% over last year, the lowest level in 20 years, with the exception of April 2020, the first full month of the Covid-19 pandemic lockdown.
So why are so few homes being listed for sale right now?
There are likely a number of potential explanations for this. Firstly, as I discussed in my March 2023 report, Canadian banks have been very flexible when it comes to helping their existing clients manage the rapid increase in their mortgage rates over the past year. Some are helping clients with fixed payment variable rate mortgages to keep their payments at the same amount in spite of rising interest rates by extending the amortization (time period) of their loan even if that means their current payment isn’t enough to cover the interest on their mortgage; for these borrowers, their mortgage balance is actually growing each month rather than declining, referred to as negative amortization. This has softened the payment shock that these owners and investors would have experienced if they had to increase their mortgage payments instead and as a result, this is likely why we seeing relatively little distressed selling when overleveraged owners or investors are forced to sell properties they cannot afford.
In addition, another source of new listings each year comes from households that upsize to a bigger home. But upsizing has become a luxury at today’s high interest rates so far fewer households (likely those that need to due to changing life circumstances) are making that leap.
One way of seeing how the competition in the housing market has changed over time is by considering the percent of houses that sold with no conditions. In a balanced market (one doesn’t overly favour buyers or sellers), we tend to see more houses sell conditionally on a home inspection or financing. However, when the market heats up more, increasing competition among buyers, buyers are willing to exclude those conditions from their offer because sellers find those condition-less offers more attractive (i.e., as the sale is complete right away and not when or if any conditions are successfully fulfilled, etc.). In a competitive market, as the number of houses that receive multiple offers increases, the share of sales that have no conditions also tends to increase.
The chart below looks at the percentage of low-rise houses that sold with no conditions over the past year. I didn’t include a chart for condos since a buyer condition on reviewing a condominium's status certificate and financial statements is very common even in a competitive market. Furthermore, we are not seeing the same degree of upward pressure on condo prices as we are seeing with houses, something I’ll discuss further in the next section of this report.
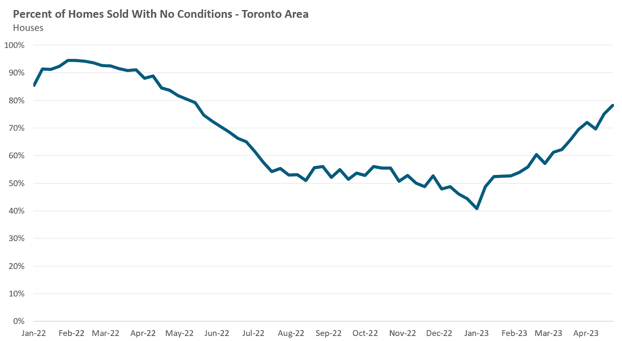
Turning back to houses, during the second half of 2022, just over half of houses sold with no conditions, signalling a busy, but not overly competitive market. Since then the share of houses selling with no conditions has climbed rapidly reaching just under 80% at the end of the most recent concluding month, April.
When this happens, house prices typically accelerate which is exactly what we are seeing in the low-rise market. The average price of a house during the second half of 2022 remained flat at around $1.3M, but has since accelerated to just over $1.4M.
On-the-ground, we are seeing early signs of the Fear of Missing Out (FOMO) amongst buyers in the market for houses, which is pushing more and more buyers to bid aggressively on offer nights.
There are likely a few factors driving FOMO we are seeing today.
Firstly, FOMO never happens when homes sit on the market with no bidding wars and sell for under the asking price. FOMO is itself a product of a very tight housing market when multiple buyers are experiencing themselves competing for the same homes each week. When buyers see for themselves that prices today are higher than they were just three months ago, they worry that if they don’t buy soon they’ll never be able to afford a home as prices continue to rise.
FOMO is also being fueled by the fact that young families constantly hear from our government and experts that there just aren’t enough homes for everyone (a lack of supply) in the near to longer-term, especially in the face of rising population levels driven by immigration, which makes them fear that they need to do everything possible to get into the market.
Finally, as the Bank of Canada and the Federal Reserve appear to have paused their rate hikes, buyers are expecting rates to fall in the year ahead, which they worry might push home prices up even higher as mortgage rates fall and make prices more affordable.
Which leads me to the biggest risk facing Toronto’s housing market right now — if these early signs of FOMO and the price acceleration we are seeing continue as we move into the spring and summer amidst historically low listing levels, the market will be more vulnerable to a price decline if interest rates stay high for longer than expected and households start to feel this pressure.
While Toronto’s condo market is heating up, it is not seeing the same level of competition amongst buyers and upwards price pressure as we are seeing for low-rise houses.
While median and average prices for condos in April are up slightly since December/January (likely due to a seasonal decline in those latter months), prices are very much in line with where they were during most of the second half of 2022.
I suspect there are two main factors that have prevented the condo market from seeing the same type of frenzy we have been seeing in the low-rise market this year.
Firstly, condo buyers are often first-time buyers who are currently renting an existing condo so they will often compare the cost of renting their current unit vs buying. In contrast, buyers of low-rise houses are less likely to consider the option to continue renting because there are not as many low-rise house rentals and young families are more willing to pay a premium for a home they can settle into for the long-term and not find themselves forced to move if their landlord decides to sell the house a year or two from now.
Returning to the condo segment, given high interest rates, the cost of owning a condo is high relative to the cost of renting a unit that is similar in size and quality. The table below shows the average cost of a 1-bedroom condo in downtown Toronto for the month of April along with the average monthly maintenance fee and property taxes. The mortgage payment assumes a 20% down payment, a 5% interest rate and a 30-year amortization.
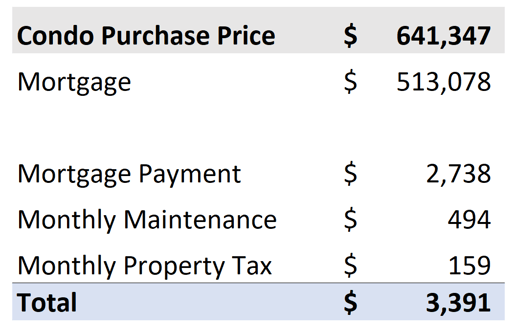
From above, a buyer would have monthly costs of $3,391 to own an average 1-bedroom condo downtown. But the average rent for a similarly sized and situated condo in April was $2,455, or $937 less than the cost of owning.
Some buyers are of course comfortable with paying slightly higher monthly costs each month to own rather than rent, but I suspect that this gap in the costs of owning vs renting may be keeping a bit of a ceiling on condo prices in the short-term.
The other factor that has limited upwards price pressure on condos is that investors are not as active as they once were in this segment. Investors buying with a 20% down payment would find themselves faced with the exact same scenario above where their monthly carrying costs would be roughly $900 more than their monthly rent. While Toronto condo investors are used to some level of negative cashflow on their investments, as the negative casfhlow increases it makes investing in condominiums for challenging financially.
While we may see some upward pressure on condo prices in the months ahead, I suspect it will be far more modest than the potential acceleration we may continue to see in low-rise house prices.
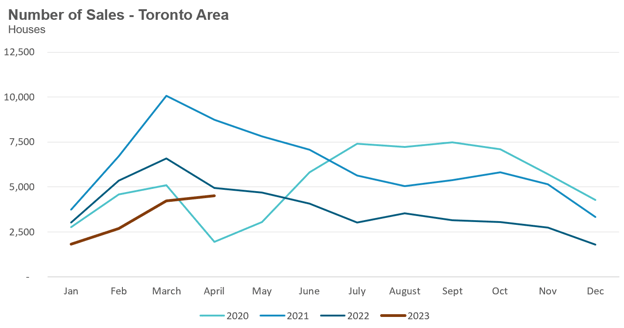
House sales (low-rise freehold detached, semi-detached, townhouse, etc.) in the Greater Toronto Area (GTA) in April 2023 were down 9% over the same month last year.
New house listings in April were down 42% over last year and well below historic new listing volumes for the month of April.
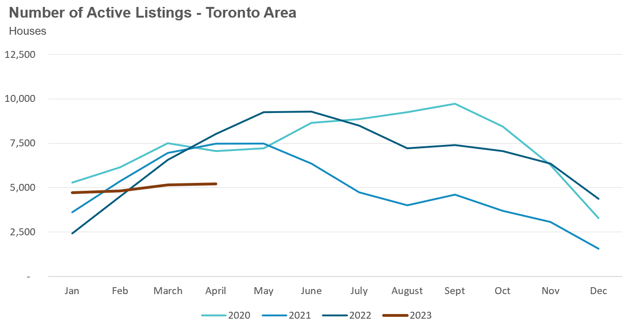
The number of houses available for sale (“active listings”) was down 35% when compared to the same month last year.
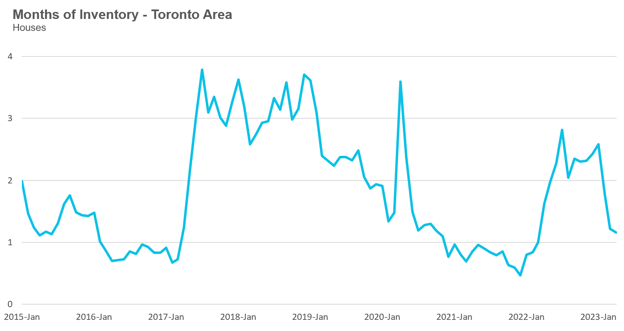
The Months of Inventory ratio (MOI) looks at the number of homes available for sale in a given month divided by the number of homes that sold in that month. It answers the following question: If no more homes came on the market for sale, how long would it take for all the existing homes on the market to sell given the current level of demand? The higher the MOI, the cooler the market is. A balanced market (a market where prices are neither rising nor falling) is one where MOI is between four to six months. The lower the MOI, the more rapidly we would expect prices to rise.
While the current level of MOI gives us clues into how competitive the market is on-the-ground today, the direction it is moving in also gives us some clues into where the market may be heading.
The MOI for houses remained relatively flat at 1.2 MOI in April. This puts the market for houses deep into seller’s market territory.
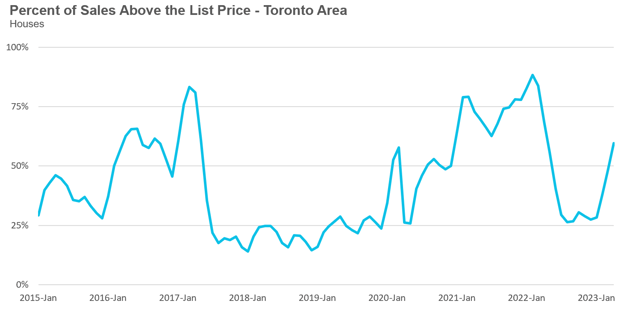
The share of houses selling for more than the owner’s asking price increased to 60% in April.
The average price for a house in April was $1,416,731 in April 2023, well below the peak of $1,679,429 reached in February 2022 and down 7% when compared to the same month last year.
It’s worth noting that the average price had been relatively flat at around $1.3M since July, but has begun to trend up over the past few months and is at the highest level since June 2022.
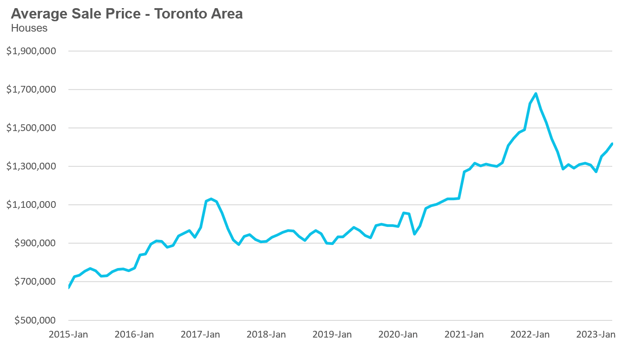
The median house price in April was $1,260,000, down 7% over last year, and below the peak of $1,485,000 reached in February 2022.
The median is calculated by ordering all the sale prices in a given month and then selecting the price that is in the midpoint of that list such that half of all home sales were above that price and half are below that price. Economists often prefer the median price over the average because it is less sensitive to big increases in the sale of high-end or low-end homes in a given month which can skew the average price.
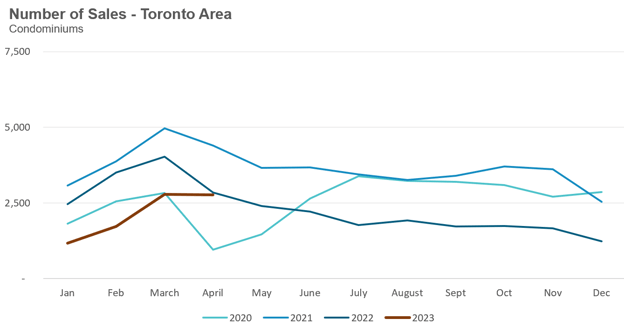
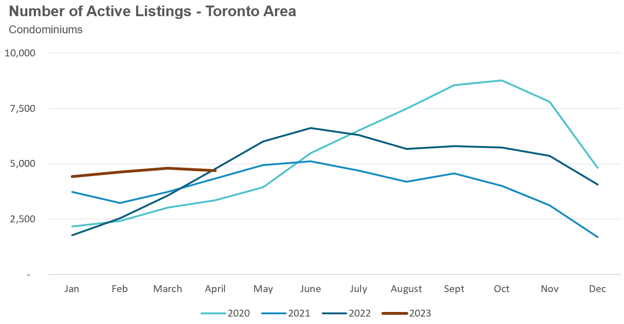
Condo (condominiums, including condo apartments, condo townhouses, etc.) sales in the Toronto area in April 2023 were down 3% over the same month last year.
New condo listings were down 31% in April over last year.
The number of condos available for sale at the end of the month, or active listings, was down 2% over last year.
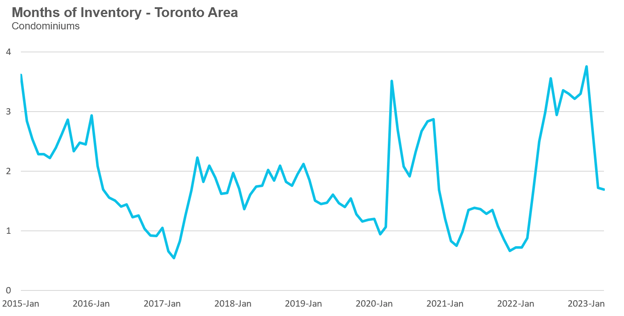
Condo months of inventory remained relatively flat at 1.7 MOI in April, which puts the condo market in seller’s market territory.
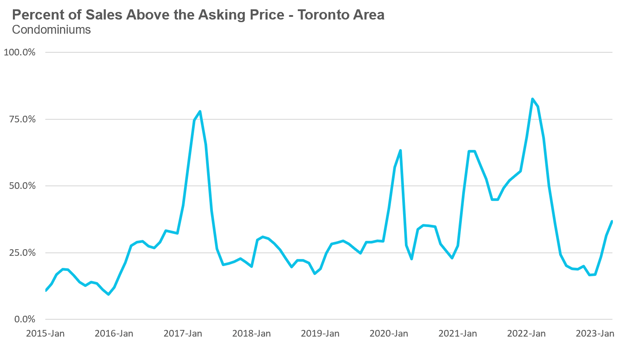
The share of condos selling for over the asking price remained unchanged at 37% in April.
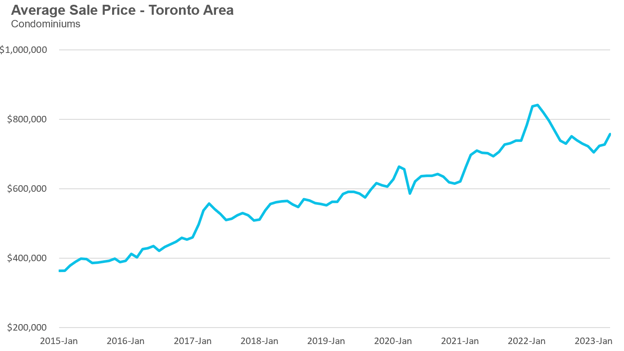
The average price for a condo in April was $757,172, down from the peak of $840,444 in March 2022, and down 8% over last year. The median price for a condo in April was $685,000, down 9% over last year, and down from the March 2022 peak of $777,000.
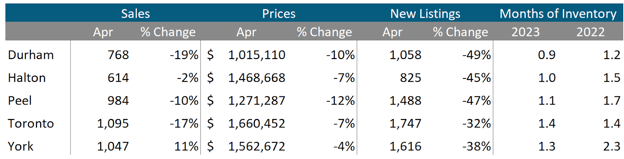
Houses
As we can see from these regional year-over-year trends across the GTA, new listing levels have declined more rapidly than the decline in sales. While house prices are down over last year across, inventory levels are below last year, and this tightened supply is contributing to the month-to-month increase in prices we are seeing over the past few months.
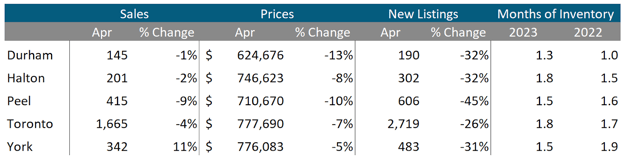
Condos
As in the GTA market for houses, the decline in new listing levels is far greater than the decline in sales. However, unlike the market for houses, inventory levels for condos in most regions are slightly above last year’s levels. Prices are also down year-over-year across all five regions.
Browse Real-Time Market Trends on Movesmartly.com:
See Market Performance by Neighbourhood Map, All Toronto and the GTA
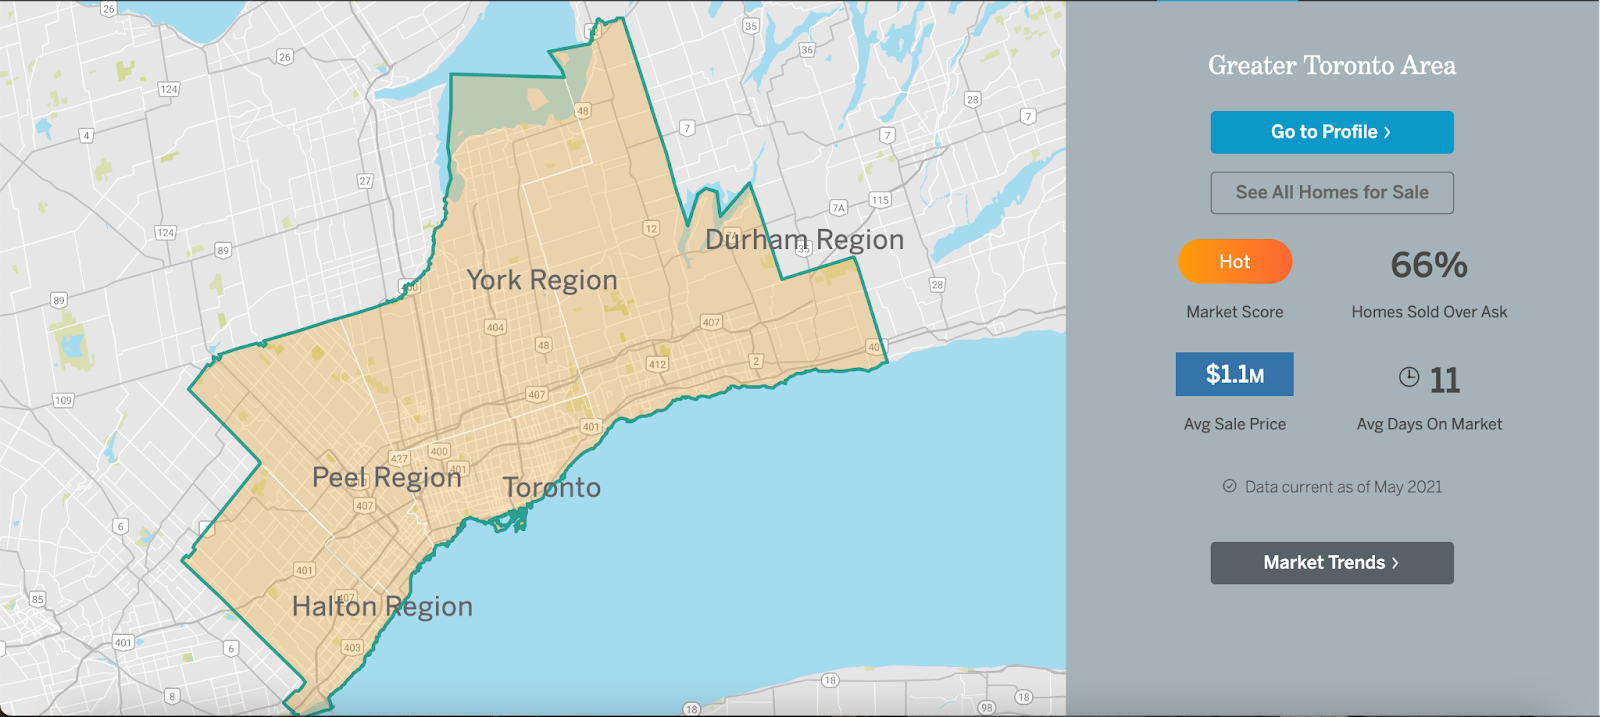
Greater Toronto Area Market Trends