Author John Pasalis is the President of Realosophy Realty, a Toronto real estate brokerage which uses data analysis to advise residential real estate buyers, sellers and investors. He is a top contributor at Move Smartly, a frequent commentator in the media and researcher cited by the Bank of Canada and others.
A Still Tightly Supplied Market Likely to Continue in a Competitive Fall
FREE PUBLIC WEBINAR: WATCH REPORT HIGHLIGHTS
Join John Pasalis, report author, market analyst and President of Realosophy Realty, in a free monthly webinar as he discusses key highlights from this report, with added timely observations about new emerging issues, and answers your questions. A must see for well-informed Toronto area real estate consumers.
The Market Now
The summer came to a close showing strong signs that in the fall we will continue to see a competitive market for homes in the Toronto area.
While house sales were down 30% on a year over year basis, sales were well above the pre-COVID levels in 2018 and 2019 for the month of August.
The big factor that is keeping Toronto’s housing market very competitive is the declining number of homes coming on the market for sale. New listings were down 46% over last year and well below levels in 2018/19.
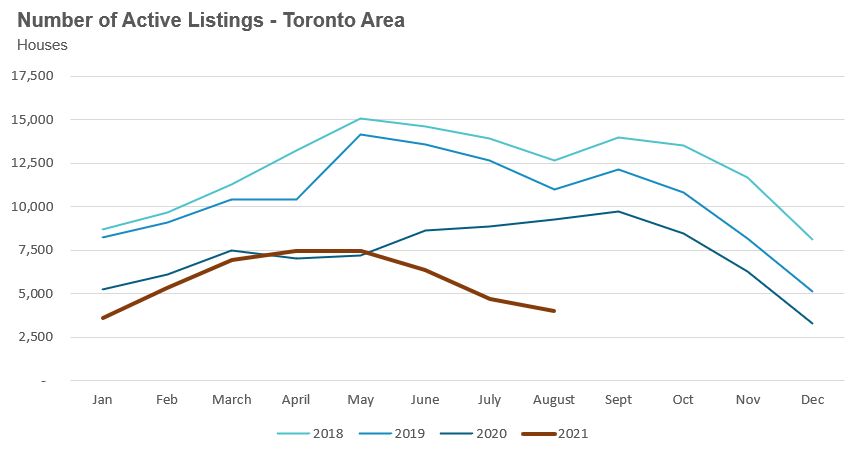
At the end of August, the Toronto area had only 4,001 houses available for sale, a 56% decline from inventory levels last year and well below the 11 to 12,000 active house listings that are more typical for the month of August.
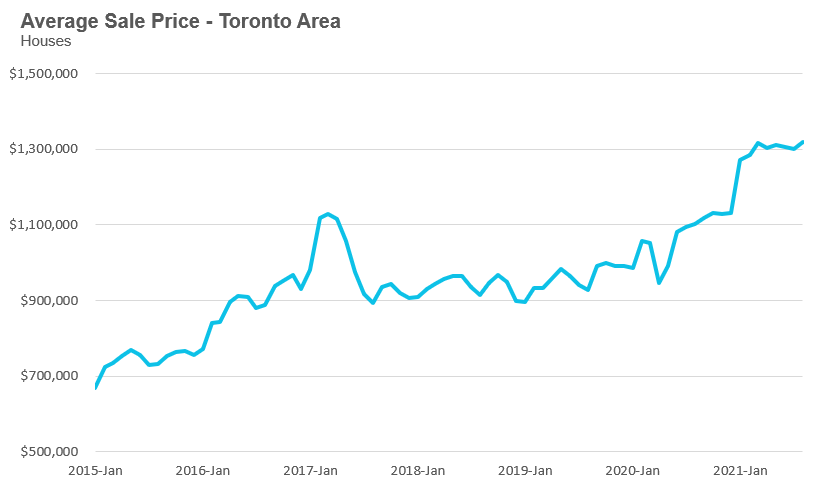
The average price for a house in August was $1,319,214 with home prices plateauing around the $1.3M range since the start of the year.
Condominium sales in August were up 1% over last year and above the pre-COVID levels in 2018 and 2019 for the month of August.
New condo listings were down by 38% in August 2021 over last year, but well above the volumes in 2018 and 2019.
The number of condos available for sale at the end of the month, or active listings, was down 44% over last year.
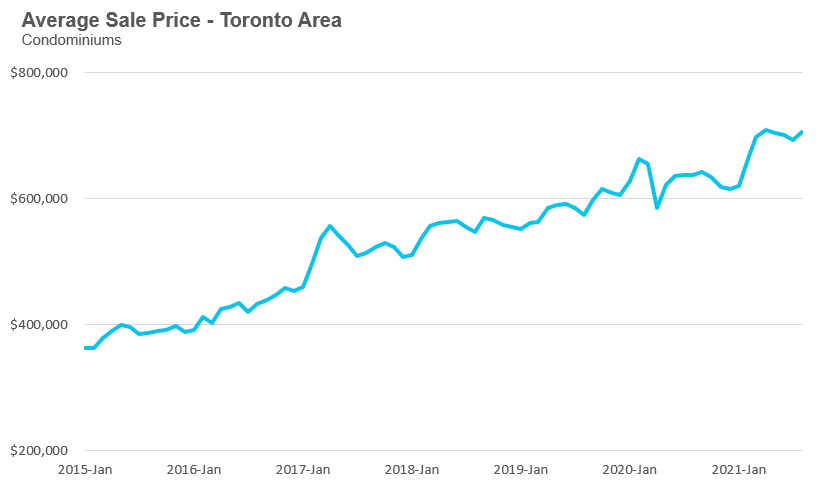
The average condo price in August was $705,968 while the median was $640,000, up 11% and 9% respectively over last year.
By Move Smartly Editor, Urmi Desai
As we head to the polls this September for the federal election, housing policy is, for once, a big ticket issue as the number of Canadians worried about unaffordability has reached a critical mass.
And it’s no surprise why — Canada has far outpaced the rate of growth in house prices in the rest of the developed world as shown in this chart from the Financial Times (see below).
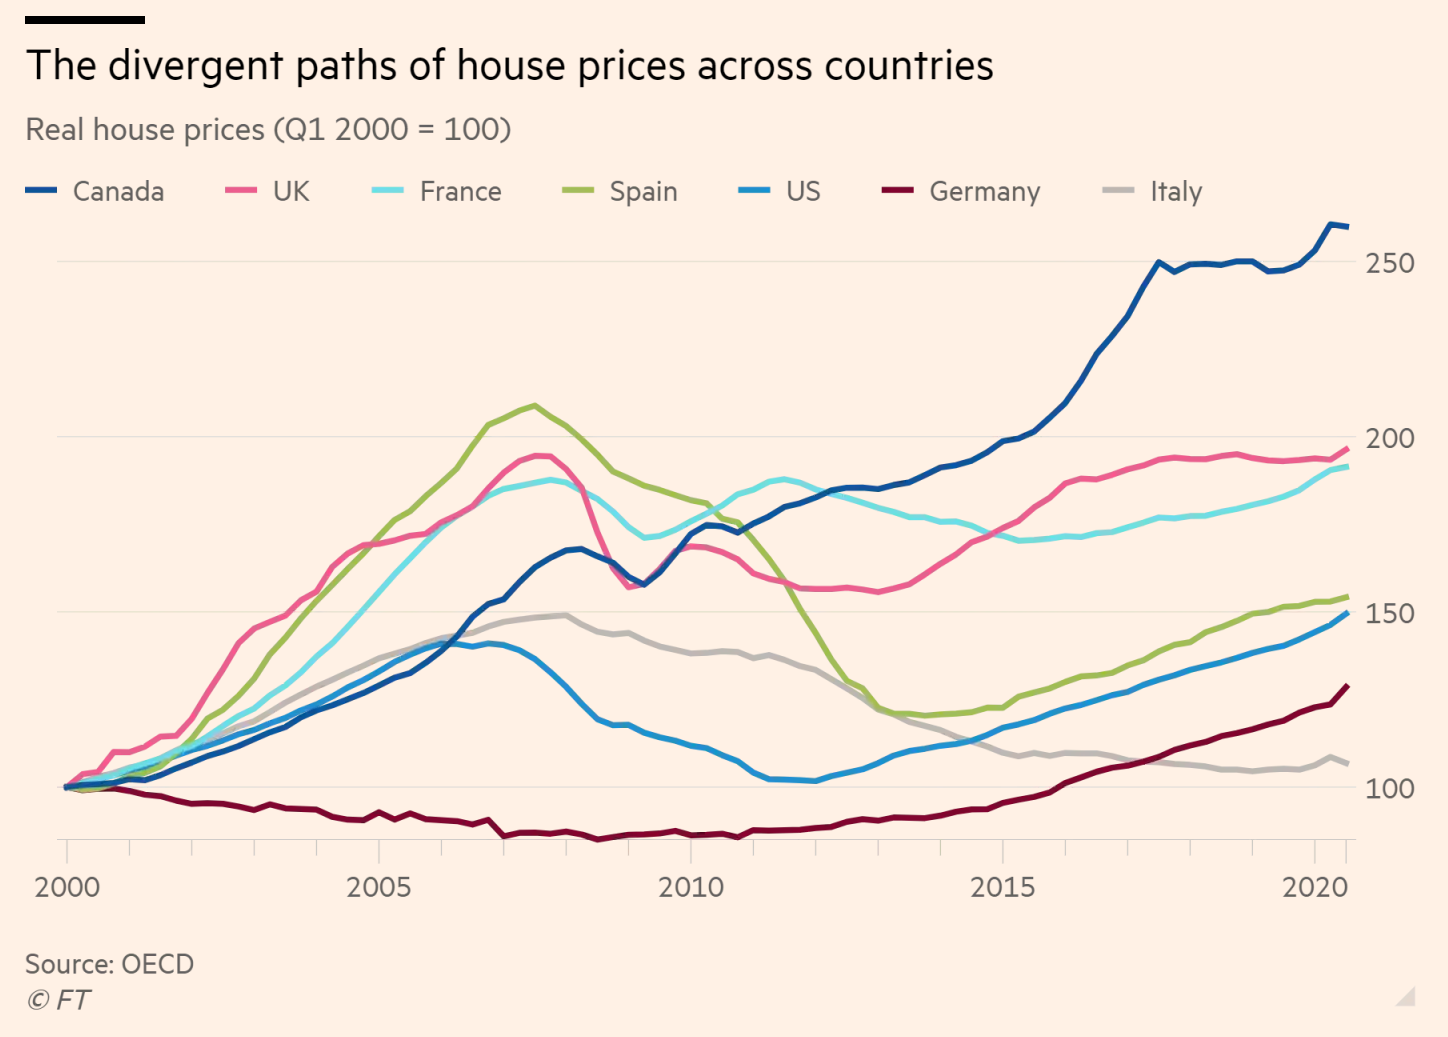
Bringing home prices down is the obvious solution, but with home ownership at over 60% in Canada, a notably high figure it would not be a popular move with voters and it’s a risky prospect for the potential fallout for our economy as a whole as it feeds on rising home prices and household debt.
Given this, it’s perhaps not surprising that what the parties have instead presented are plans that ignore key drivers of housing demand, propose a slew of measures that drive even more demand and propose supply side solutions that are lofty in their ambitions, but unlikely to result in any meaningful change in the short term.
Lead Move Smartly contributor, John Pasalis, Realosophy President, notes that one other option is to stall the rate of growth in house prices for a number of years to allow incomes to gradually catch up with house prices. However, the parties have generally focussed more on lofty and ambitious supply-side solutions unlikely to result in any meaningful change in the short-term, and ignored critical demand-side measures, such as the need to better coordinate immigration and housing policy. Similarly, Move Smartly mortgage and financing commentator, David Larock, notes that almost all of the mortgage-change proposals being made by our three main parties will stoke more demand, which will only exacerbate the problem.
To help you navigate through the flurry of pitches being thrown at us as voters, we’ve assembled this at-a-glance comparison chart of housing policy proposals in official party platforms (note that some parties have made additional announcements, some of which are noted below as well (click on each header to link to actual party platform).
Below, our top contributors assess how likely each proposal will improve housing affordability.
|
Liberal Party of Canada (Liberal) (Incumbent) |
New Democratic Party (NDP) |
|
|
Housing Supply |
||
|
Build 1.4 million new homes by 2025-26:
|
Build 1 million homes in the next three years:
|
|
|
Renting |
||
|
|
|
|
Buyer Protection |
||
|
||
|
Speculation & Money Laundering |
||
|
|
|
|
First-Time Buyers |
||
|
||
|
Mortgages |
||
|
|
|
|
Taxation |
||
|
|
|
|
Homelessness |
||
|
|
|
Housing Supply
John notes that when hearing political leaders promises of millions of new homes being built, it’s important to put these numbers into context. Over the past twenty years Canada has seen an average of 180,000 housing starts per year.
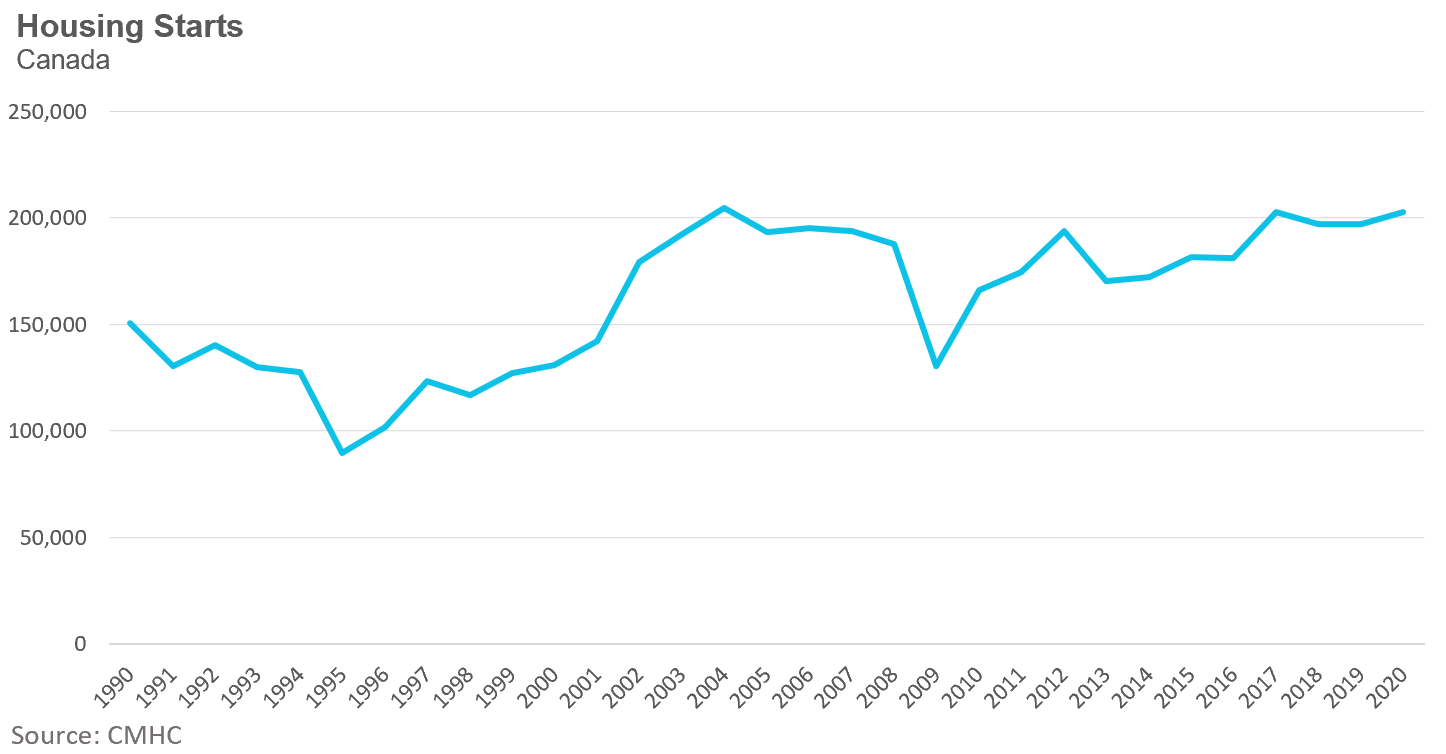
The Liberal’s are promising 1.4 million new homes by 2026 (but the fine print clarifies that these “new homes” includes renovated and preserved homes — so not entirely new).
The Conservatives plan to start the construction of 1 million new homes over the next three years. Even if their plan includes the roughly 180,000 housing starts we normally expect to see in Canada, it’s unclear how the Conservatives will nearly double the rate of housing construction in Canada —- in just three years. While some ideas, such as the use of “Community Land Trusts”, which would allow for corporations and individuals to donate land to develop housing, mirroring an existing program to do this for ecological reserves, seem more original, there is still very little in concrete details — how much actual take up of this program is realistically expected?
The NDP plan to build 50,000 affordable houses per year is more modest, but even meeting this target would need to be over and above our historical housing start numbers and it’s unclear how the NDP will achieve this goal, much less make it affordable.
Overall, all parties fail to clearly outline how they plan to increase housing starts above Canada’s historical trends. There are many provincial and municipal frictions when it comes to increasing housing supply and while all parties have proposed measures to try to encourage more cooperation with provinces and municipalities, these proposed policies are unlikely to have any impact in the short term.
Renting
John notes that one area in which the incumbent Liberal Party has succeeded is increasing the supply of purpose built rental apartments. This is something that the Liberals have succeeded at doing as purpose built rental constructions starts are the highest they’ve been in decades.
He doesn’t like the Liberal’s “rent-to-own” plan as much as the Conservatives approach to finding new ways to boost affordable housing through new ideas like Community Land Trusts: “The former continues to build on the obsession and glorification of homeownership while the latter aims to make renting an affordable long-term housing option for families.”
Buyer Protection
The Liberals alone have put forward a number of proposals for Buyer Protection, including banning the practice of ‘blind bidding’, the practice in which home buyers make offers on homes without knowing what other parties are bidding.
However, most of the policies proposed by the Liberals here actually fall under the provincial government’s jurisdiction. And some of the proposals, such as requiring agents to disclose when they are on both sides of a sale to all participants in a transaction are already in place in Ontario.
Move Smartly legal expert, Bob Aaron agrees that “the proposals to regulate the real estate market in Ontario are clearly beyond the constitutional jurisdiction of the federal government,” noting that “voters should not be misled by these empty policy proposals.”
Furthermore, Bob notes that regulatory changes should be approached with caution in general: “Every time any level of government interference in the real estate market, they seem to mess it up.”
Speculation & Money Laundering
As recently first reported by a Chinese news source, a 1996 Canada Revenue Agency report that found “rich migrants made more than 90 per cent of luxury purchases in two Vancouver municipalities while declaring refugee-level incomes” has made it clear what many Canadians have long suspected — that foreign capital has played an important role in inflating house prices in Canada.
But John notes that plans to ban and/or tax foreign investors from all three parties have come 25 years too late. These proposed policies are unlikely to have any meaningful impact on the market because there are likely to be a number of exemptions to the tax which will limit their effectiveness. “We can’t forget that several months ago the Liberal party’s parliamentary secretary for housing said: “We have a very good system of foreign investment creating a lot of new housing in Canada.” I’m not convinced that any of the parties want to crack down on this “very good system.”
Mortgages
Move Smartly’s mortgage and financing expert David Larock notes that proposals range from those that are “a statement full of sound and fury that signifies nothing” to a “disaster in the making.” Overall, David argues that many of the proposals just stimulate demand amongst various subgroups, making the problem of housing affordability worse.
Among the proposals that David feels are most risky is the Liberal proposal to require mortgage lenders to defer payments for up to six months. “This proposal would appeal to at-risk borrowers in the short term but it would end up being a nightmare for all of the other borrowers over the long term,” as it would eventually result in increased rates for all borrowers as investors would ask for higher risk premiums to off-set deferrals. He notes that other Liberal proposals for Canadian Mortgage and Housing Corporation (CMHC) insurance changes would only increase demand.
David finds the Conservative proposal to introduce new seven to ten year mortgages potentially a good one, but notes that it’s unclear how the market, currently heavily geared towards 5-year terms, could be incentivized to do this, noting there is a lot of room for errors in trying to implement this. While other proposals are either vague or serve to increase demand, David is happy to see the proposal to remove the requirement for a ‘stress test’ when switching lenders, which is “highly anti-competitive.”
While the NDP proposal to increase access to CMHC mortgages for co-housing and co-ownership is a good one if combined with increasing affordable housing on the supply side, David notes that the introduction of 30-year terms would only stoke demand.
First Time Buyers
Echoing David’s comments on mortgage measures, John also notes that the one challenge with policies aimed at first time buyers is that they are effectively designed to stimulate more housing demand, which of course will only serve to push home prices up even higher.
Taxation
John notes that the anti-flipping is a policy that sounds great but is unlikely to have much of an impact. The tax is unlikely to apply to builders and renovators who are investing in homes and contributing to the economy. The number of investors who simply flip a home within a year without making any material changes to it is a small fraction of sales.
Looking Back On The Real Impact of the Justin Trudeau Government on the Canadian Housing Market
Justin Trudeau has been prime minister for just under six years and with a federal election around the corner the time is right to look back at how Toronto’s housing market has evolved during his time as prime minister.
I’ll be comparing the rate of change in house prices under Trudeau’s government against former prime minister Stephen Harper’s government.
This analysis will be based on changes to the Benchmark Home Price for the Toronto area as provided by the Canadian Real Estate Association at the beginning and end of each prime minister’s term. Because the latest housing data available is for July 2021, I’ll be using this as the end date for Trudeau’s term.
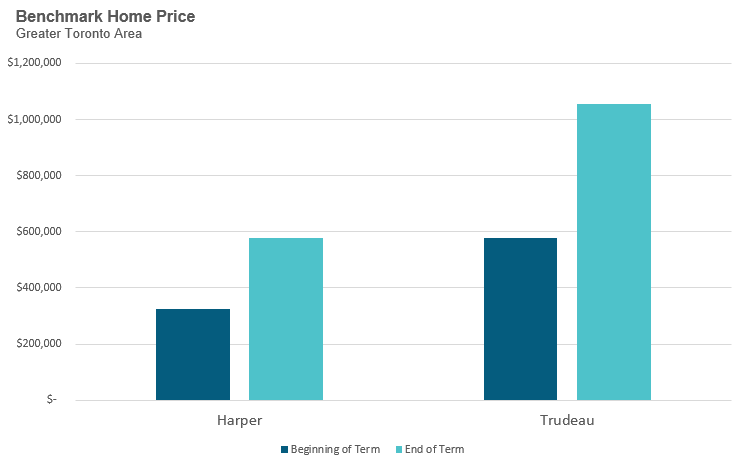
The one thing not captured in this chart is the fact that Stephen Harper’s term was just under 10 years compared to under 6 years for Justin Trudeau.
When we look at the annual rate of appreciation in house prices, we find that prices on average had appreciated by 6% per year under Stephen Harper compared to 11% under Justin Trudeau.
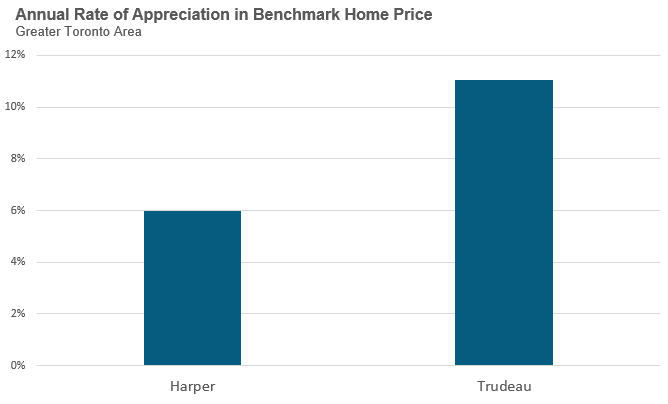
Now let’s look at how quickly home prices were rising in dollars each year, since this is ultimately what impacts households. When we convert the dollar appreciation under each prime minister to an average annual number we find that home prices were rising by an average of $25K per year under Harper compared to $83K under Trudeau.
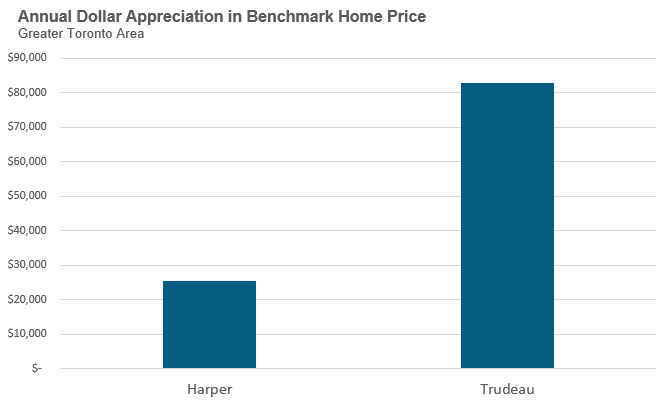
Now the big problem with the explosive growth in house prices under Justin Trudeau’s government is that household incomes have not been rising nearly fast enough to keep up with home prices which means every year that passes houses are becoming less and less affordable.
How much do household incomes need to rise to keep up with house prices?
To answer that, we’re going to consider how quickly home prices were rising each year in dollar terms and assume households are saving 10% of that increase which would be used as a down payment and are able to get a mortgage for the other 90%.
For example, under Harper’s government house prices were rising by $25,536 per year which means households would need to save $2,553 for the down payment and would need to be able to borrow an extra $22,982 to cover the difference.
How much do incomes need to be increasing to afford an additional $22,982 in debt each year?
If we assume a household can borrow no more than 4.5X their household income, we can see that household incomes under Harper’s government would need to increase by $5,107 a year in order for households to qualify to take on that additional $22,982 in mortgage debt each year.
Following the same approach under Trudeau’s government, households would need to save $8,299 per year to ensure their savings are keeping up with home prices and their incomes would need to be rising by $16,598 per year in order to qualify for the additional debt that would be required to keep up with house prices.
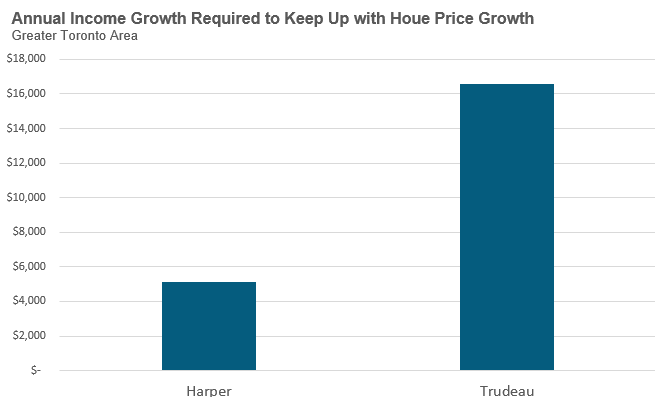
The millennial demographic who are in their prime home buying age is the group that has been most impacted by the rapid acceleration in house prices under Justin Trudeau’s government.
Households earning an income in the low $100K range (well above the median household income in Toronto) with a $100K+ down payment effectively stand no chance of buying a 3 bedroom home to raise a family in the Toronto area in 2021, as I discussed in this post. At the start of Justin Trudeau’s term in 2015 this same household would have had plenty of options to buy a family home.
Under Stephen Harper’s government, housing was affordable for the average middle class family that worked hard to save their own down payment.
In Justin Trudeau’s Canada, buying a home in Toronto is reserved for the most wealthy households with wealthy parents who can offer their kids six figure financial gifts to help contribute to their down payment. I don’t think this is the vision millennials signed up for when they helped give Justin his previous two election victories, but with Justin’s millennial support in freefall it’s become clearer that they’re not going to be duped a third time.
Number of Active House Listings Continues to Decrease As Condo Competition Cools Slightly
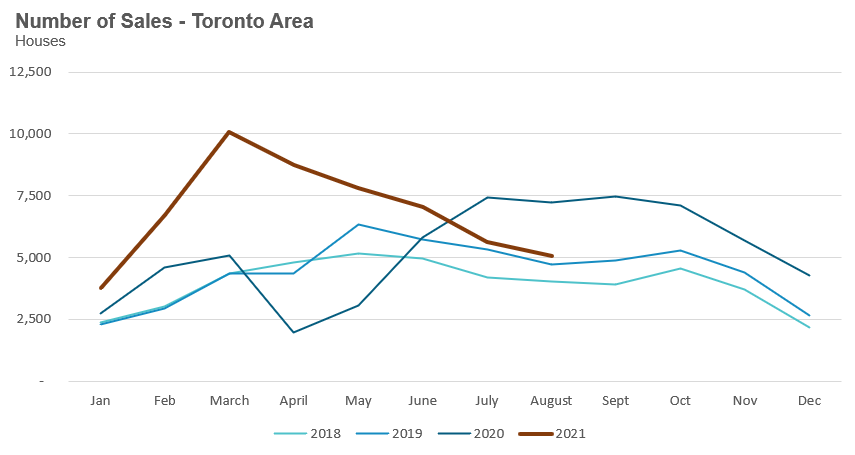
House sales (detached, semi-detached, townhouse, etc.) in the Toronto area in August 2021 were down 30% over the same month last year.
Sales will likely continue to be negative on a year-over-year basis until at least the first quarter of 2022 since we’ll be comparing against a period that saw a sudden shock in demand for houses following the initial COVID lockdowns. But it’s worth noting that sales in August were above levels for the same month in 2018 and 2019.
New listings in August were down 46% over last year, and much like the sales numbers, new listings are also showing a month-over-month decline since March. But unlike the sales figures, new listings in August were well below the listings volume seen in 2018 and 2019.
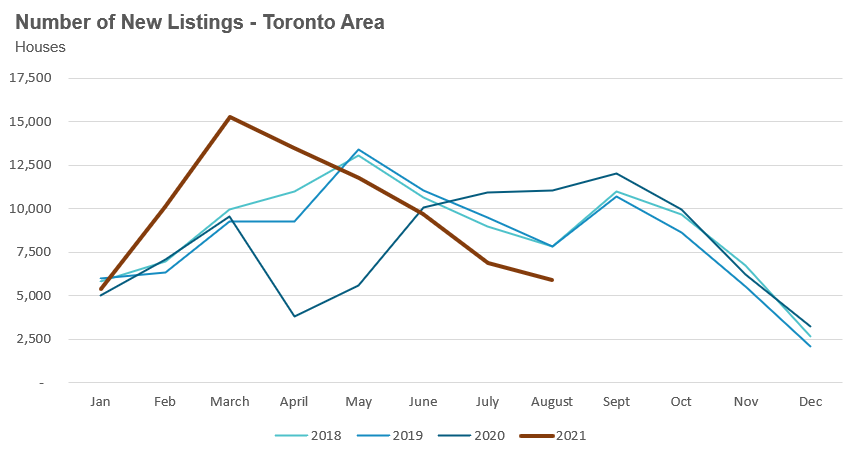
What’s behind the decline in new listings we’ve been seeing recently?
As I mentioned in last month’s report, I suspect there are two primary factors driving this. Firstly,with the provincial Ontario government easing lockdown restrictions this summer, many households are in vacation mode and in no rush to spend more time in their home to get it ready for sale. Many of these homeowners are pushing off their sales to the fall.
The other key factor that might be driving this is a desire from many homeowners to not sell their current home when upsizing or downsizing to another property. Real estate has been a strong performing asset over the past twenty years and with interest rates below 2% homeowners are motivated to hold on to their properties if they have the financial means to do so.
Our brokerage is in the process of quantifying these investors to better understand their impact on the housing market.
The number of houses available for sale (“active listings”) was down 57% when compared to the same month last year and 64% below the inventory levels seen in 2019.
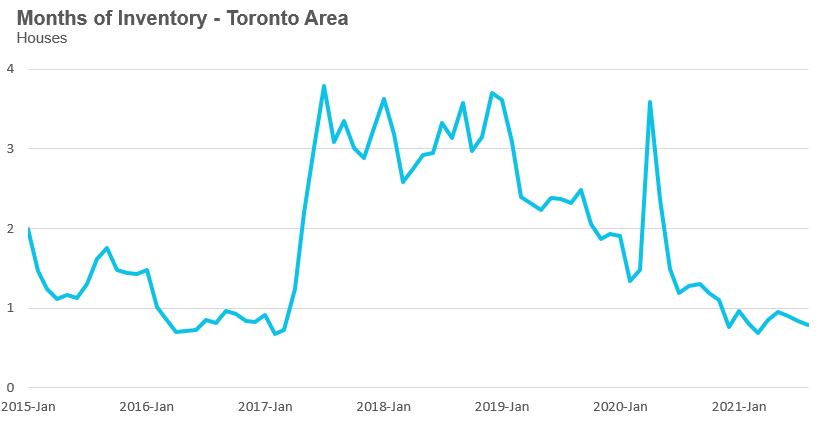
The Months of Inventory ratio (MOI) looks at the number of homes available for sale in a given month divided by the number of homes that sold in that month. It answers the following question: If no more homes came on the market for sale, how long would it take for all the existing homes on the market to sell given the current level of demand?
The higher the MOI, the cooler the market is. A balanced market (a market where prices are neither rising nor falling) is one where MOI is between four to six months. The lower the MOI, the more rapidly we would expect prices to rise.
This August, the market remained very competitive with an MOI of under 1.
While the current level of MOI gives us clues into how competitive the market is on the ground today, the direction it is moving in also gives us some clues into where the market may be heading. The MOI has remained relatively stable at or below 1 MOI for the past eleven months.
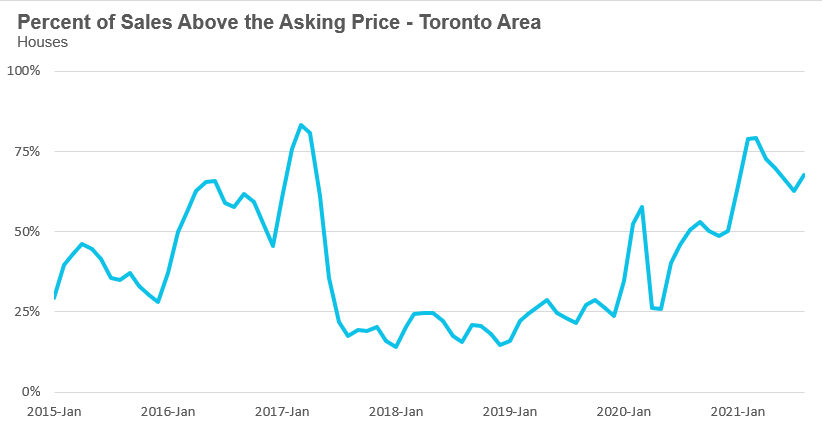
The share of houses selling for more than the owner’s asking price climbed from 63% in July to 68% in August.
The average house price in August was $1,319,214 while the median was $1,168,000, up 20% and 25% respectively over last year.
While average house prices are up significantly over last year, house prices have plateaued in 2021 with average prices remaining relatively constant in the $1.3M range since the start of the year.
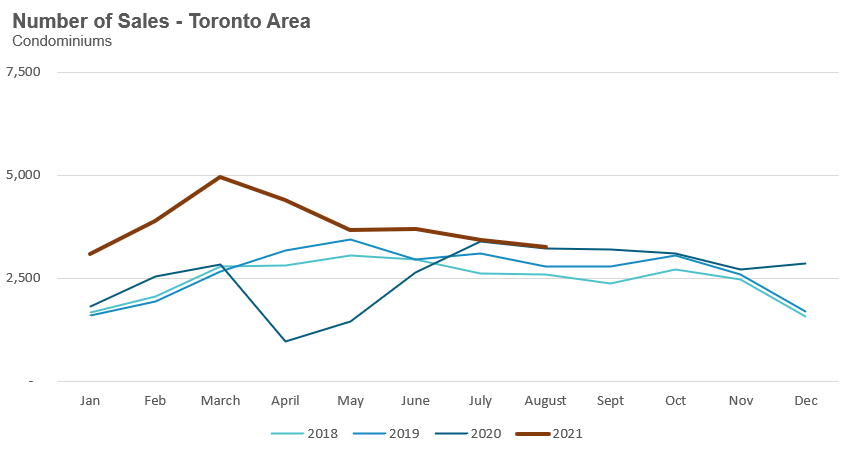
Condo (condominiums, including condo apartments, condo townhouses, etc.) sales in the Toronto area in August were up by 1% over last year and above volumes in 2018 and 2019.
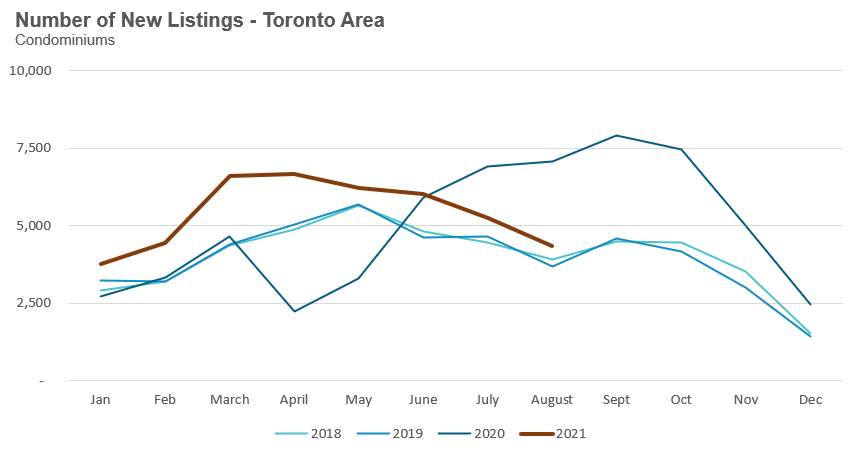
New condo listings were down by 38% in August 2021 over last year, but well above the volumes in 2018 and 2019.
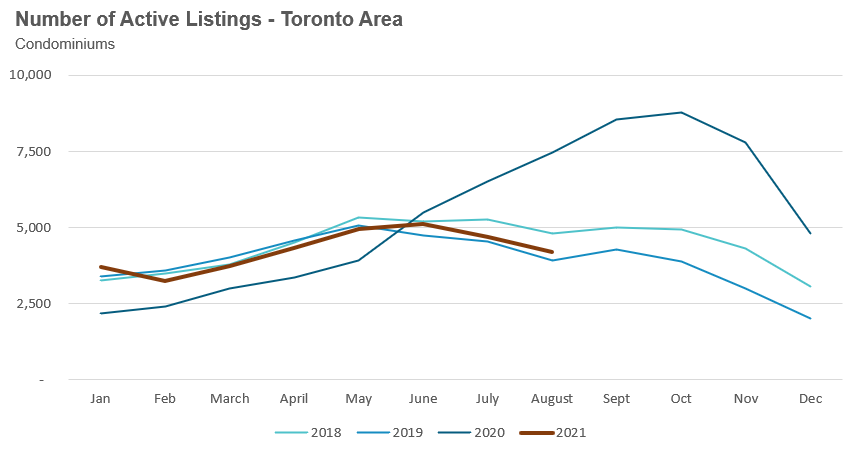
The number of condos available for sale at the end of the month, or active listings, was down 44% over last year, a period that saw a surge in condo listings due to declining prices, falling rents and rising vacancy rates.
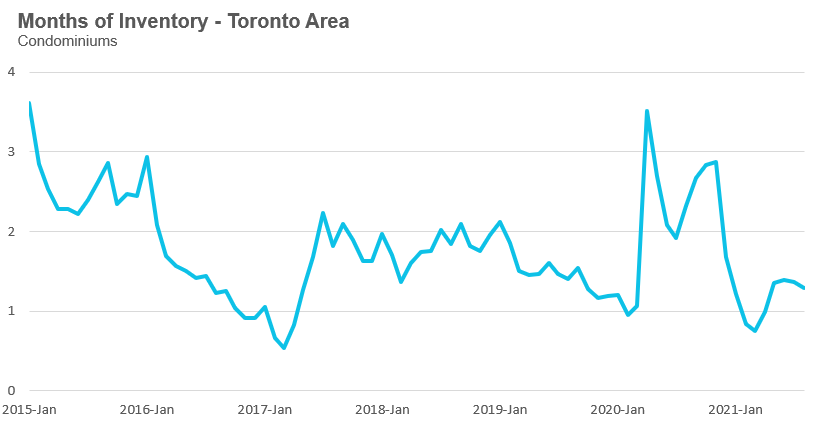
The relatively strong demand of new listings (supply) helped keep the MOI at 1.3 for the month of August, up from 0.8 MOI in March.
The competition for condos is easing slightly with the share of condos selling for over the asking price falling from 63% in April to 45% in August.
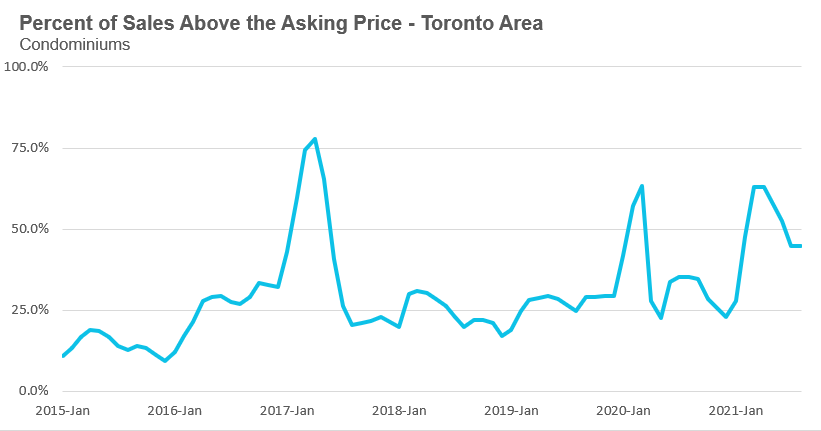
The average condo price in August was $705,968 while the median was $640,000, up 11% and 9% respectively over last year.
Average condo prices were in the low $600K range during the fourth quarter of 2020 and after a rapid acceleration during the first quarter of 2021 to approximately $700K, now appear to be plateauing.
Houses
Sales across all five regions in the GTA were down in August while average prices were up on a year-over-year basis. The decline in new listings helped keep the market competitive with MOI at or below 1 across the entire GTA, indicating a strong seller’s market.

Condos
Toronto and Peel saw condo sales up on a year-over-year basis while the other regions saw a decline in sales. Average prices were up double digits across the suburban regions and up by 7% in the City of Toronto. Also indicative of strong market conditions, current MOI levels are below last year’s levels for all five regions.

Greater Toronto Area Market Trends
All Market Performance by Neighbourhood Map, Toronto and the GTA
GET MORE DATA
The Move Smartly monthly market report is powered by Realosophy Realty. Get the same up-to-date Toronto area market information on realosophy.com plus additional information on every home for sale, including building permit history, environmental alerts and more when you buy a home with Realosophy Realty.