John in Toronto Real Estate News, Toronto Neighbourhoods
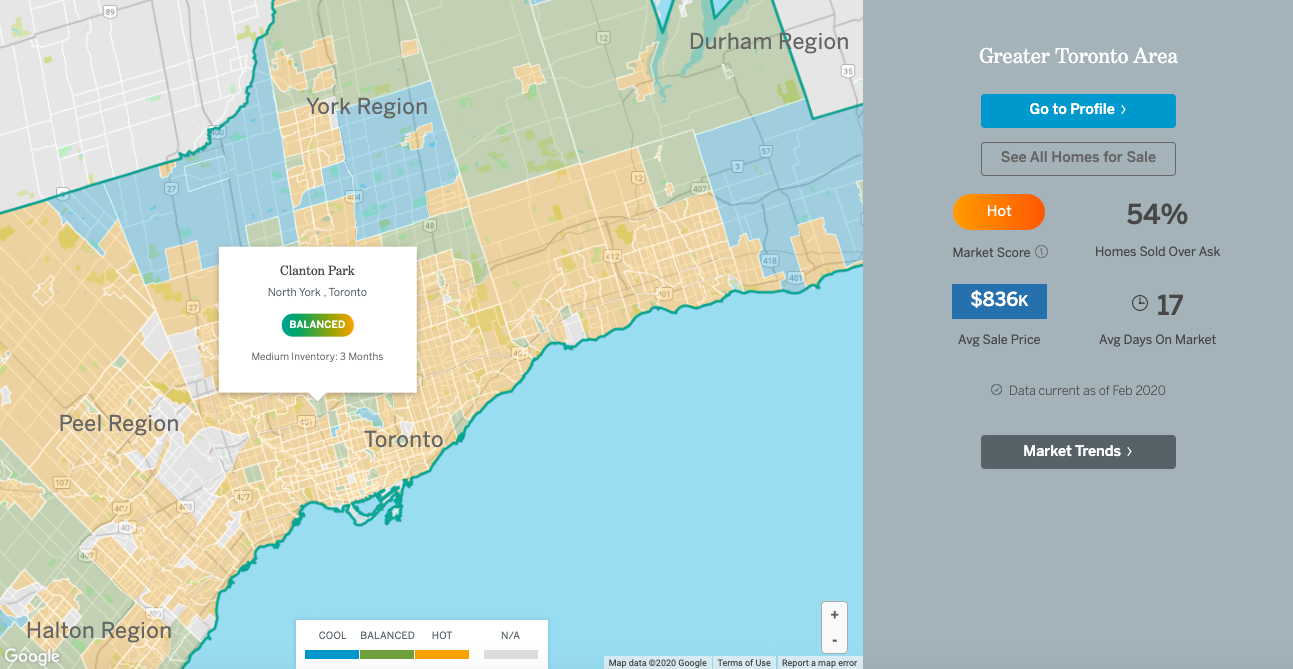
The slowdown in Toronto's real estate market continued in May with sales actually dropping by 1% over the same month last year.
New listings were up 38% to 18,940 and the average price for a home in the GTA was up 13% to $446,593.
But not all neighbourhoods are moving in the same direction.
In last week's post (Is Toronto's Housing Market a Bubble?) I talked about the risks of using national real estate statistics and forecasts to assess what's happening in Toronto's real estate market. I showed how real estate prices appreciate and depreciate at very different rates across cities and made the case for putting more emphasis on local real estate statistics over national statistics.
We can take this same basic idea and extend it to Toronto's real estate market. It's important to look at the overall statistics for Toronto's real estate market to get a general sense for where the market is heading, but city wide statistics don't tell you what's going on in a particular neighbourhood.
While prices are down 1% and inventory is up 38% on average across the GTA, that doesn't mean every neighbourhood is experiencing a similar surge in supply and decline in demand.
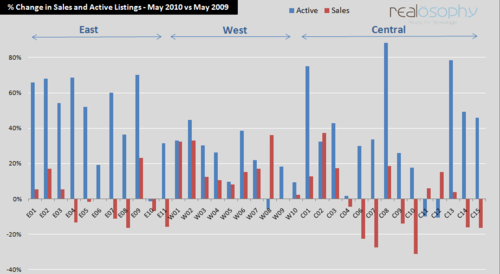
The above chart shows the percentage change in the number of active listings and sales from May 2009 to May 2010 by City of Toronto MLS districts.
We can see that east end neighbourhoods have seen the biggest and most uniform increase in the number of active listings. The Riverdale, Beaches and Danforth areas (E1-E3) have all seen an increase in the number of sales over last year whereas the majority of the neighbourhoods in Scarborough (E4-E11) have seen a decline in the volume of sales.
If we look at the west end of the city, the increase in the number of new listings is roughly half of the increase we saw in the east end. The west also stands out because not a single district experienced a decline in sales. In fact, sales in the west end of the city were actually up 18%, a significant difference from the 1% decline for the city as a whole.
In the central area of the city, we are seeing a little more volatility across the different MLS districts. Roughly half of the MLS districts experienced a decline in the number of sales and three of the districts saw little to no increase in the number of active listings. C2 (The Annex, Seaton Village, Hillcrest etc.) is only one of two MLS districts where the increase in the number of sales exceeded the increase in the number of active listings.
Like stock market watching, watching every new housing stat come out can be addictive. It's important to remember that while statistics will change quickly over the short term, most buyers are buying for the long term. Focusing in on neighbourhood trends can help you make smarter real estate decisions.
John Pasalis is the Broker owner of Realosophy Realty Inc in Toronto. Realosophy focuses on researching Toronto neighbourhoods to help their clients make smarter real estate decisions. Email John
Published: June 03, 2010