Research over 500+ Toronto Area neighbourhoods to see which fit your lifestyle needs - and offer the best return on your financial investment.
When our team gathered around the table earlier this year to discuss how to update our neighbourhood profiles at Realosophy.com, one overriding goal emerged - we wanted to help time-poor and aspiration-rich consumers wade through all the real estate noise spit out via agent flyers, industry press releases and media stories every day to be able to assess a neighbourhood in the most systematic and inspiring way possible.
Because buying, selling, renting or selling a particular home can be one of the most impactful decisions on your lifetime finances you'll ever make, we've put our trademark easy-and-vital-to-understand market trend data front and centre.
Key Market Trends
One of the key market trends we track in real time (all stats are refreshed on the first day of the month) is Months of Inventory (MOI), a metric that gives us some insight into how well supplied the housing market is given the current demand.
If no other homes came on the market for sale next month, how long would it take the current inventory to sell?
A neighbourhood with a Hot Market Score (per the example of the Leslieville, Toronto neighbourhood in the screenshot above) is competitive and favours sellers and has a low MOI (under 3 months). A Balanced Market Score has a medium level MOI (3 to 6 months) and a Cool Market Score is typically slower and favours buyers and has a high MOI (over 6 months).
Next, we spotlight median - not average - sales prices because it gives us a better indication of what a middle-of-the road-budget is for this neighbourhood, so that half of home buyers are spending above this amount and the other half below it - and we show the long-term trends going back over 10 years so you can get a sense of what the neighbourhood has been changing.
(Average prices, while also an important metric, are less useful for budgeting purposes because it can be distorted by an abnormally high number of high or low priced properties being sold in a given period of time.)
Other key metrics (such as percentage of sales by price, percentage of sales by number of beds and housing type) help you understand whether the neighbourhood you're looking at has the type of housing you are interested in (see screenshot above). This breakout also gives you a real sense of what type of housing you are most likely to find on offer in a neighbourhood - and because the numbers are refreshed every month, you keep on top of the latest changes, like more condos coming into a particular area.
Schools
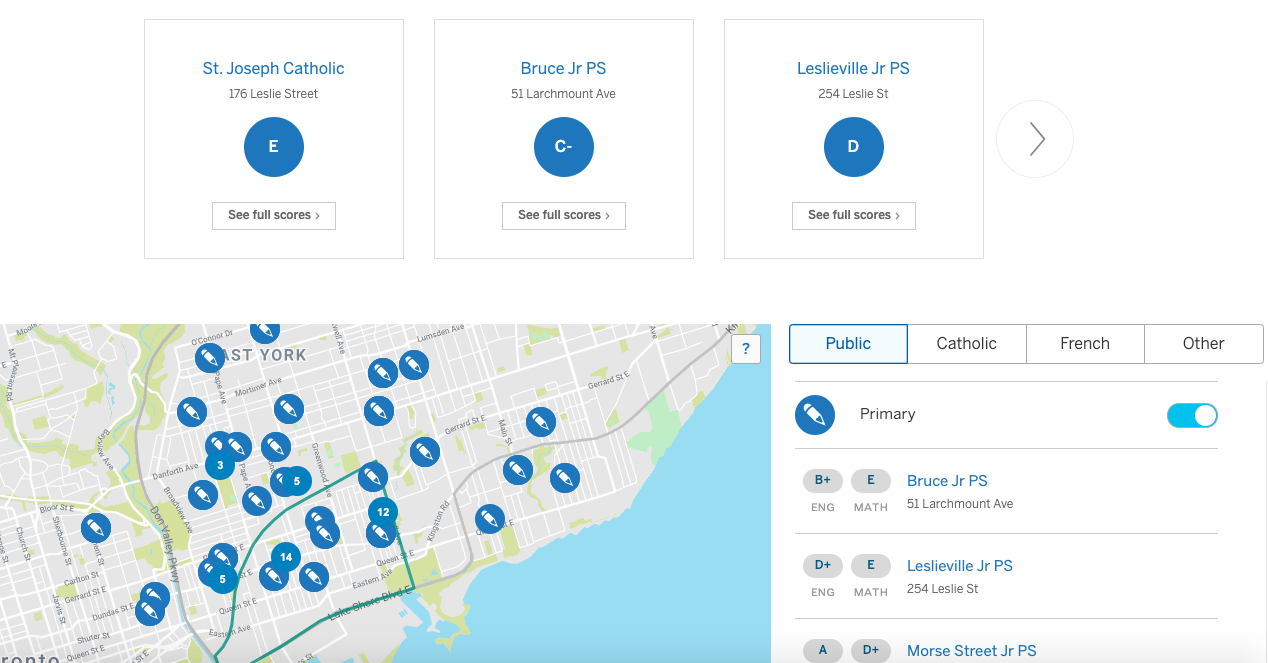
Of all local data, school data is perhaps one of the most important when you are buying a home, particularly if you have children, but even if you do not, - because it is something that many buyers will be interested when and if you ever come to sell your property.
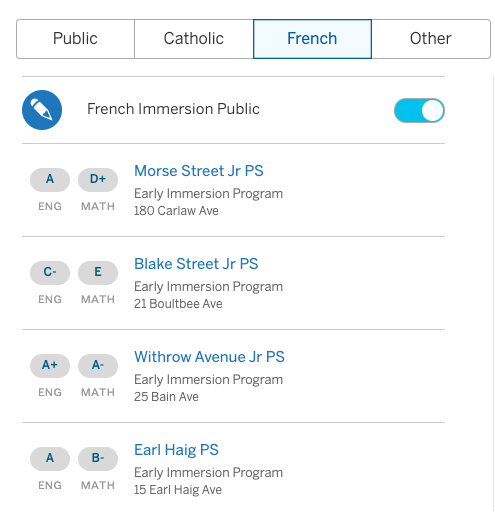
Our profile shows all schools in and around the neighbourhood in the Public and Catholic Boards at the elementary, middle and high school level, and shows you which of these schools offer French Immersion Programs and Alternative Curriculum programs. Every school is displayed with its school quality score which we base on standardized government test scores.
Local Amenities
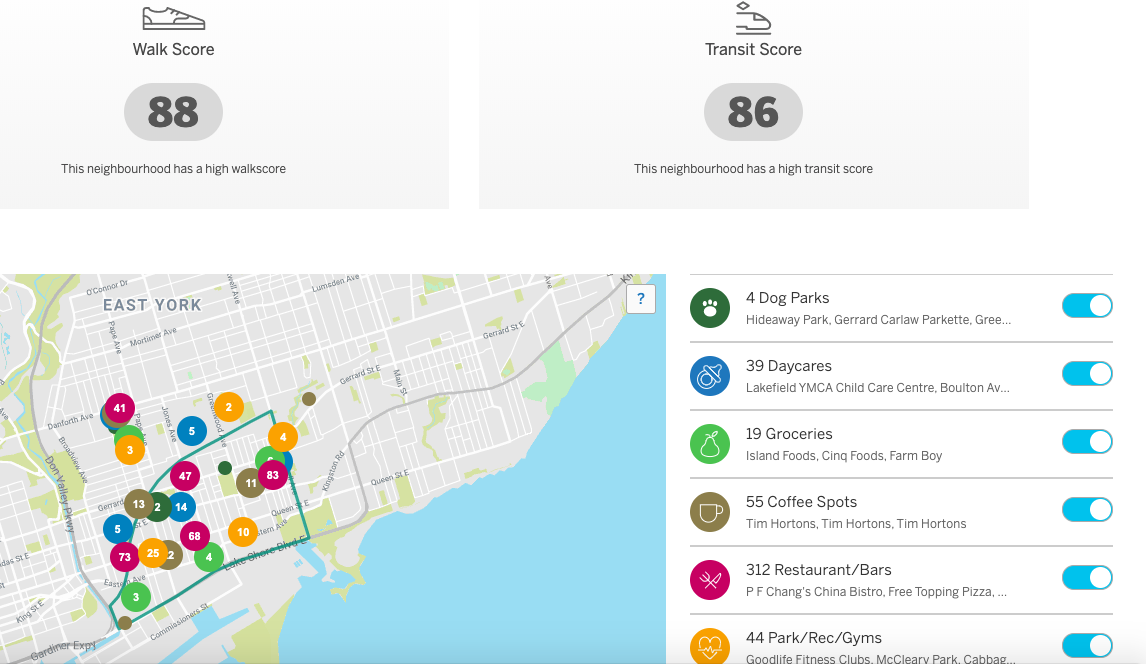
Other local amenities data allows you to quickly assess how good the neighbourhood is at the things that actually matter to you - like schools, walkability, transit, dog parks, daycares, groceries, coffee, restaurants and more (yup, you can go ahead an toggle off gyms if they aren't your thing ;).
Demographics
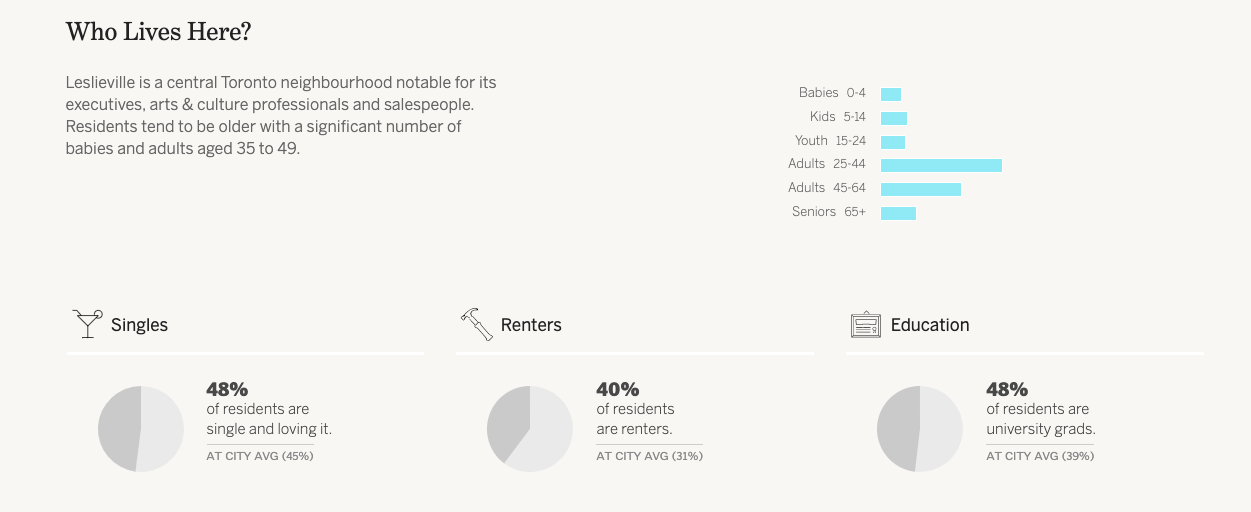
Our demographic data for each neighbourhood, which merges data from multiple sources including Statistics Canada and local municipalities, similarly reflects our considered approach to presenting data.
Here, we do not just dump as much data as we can get our hands on, but have instead carefully processed the data so that it is of most use to consumers making actual where-should-we-live? decisions. We benchmark qualities like age, family status, income, profession and foreign languages spoken against the average in the Greater Toronto Area so that our demographic information tells you what actually makes this neighbourhood feel different on the ground - or in other words, its lived experience.
Available Properties
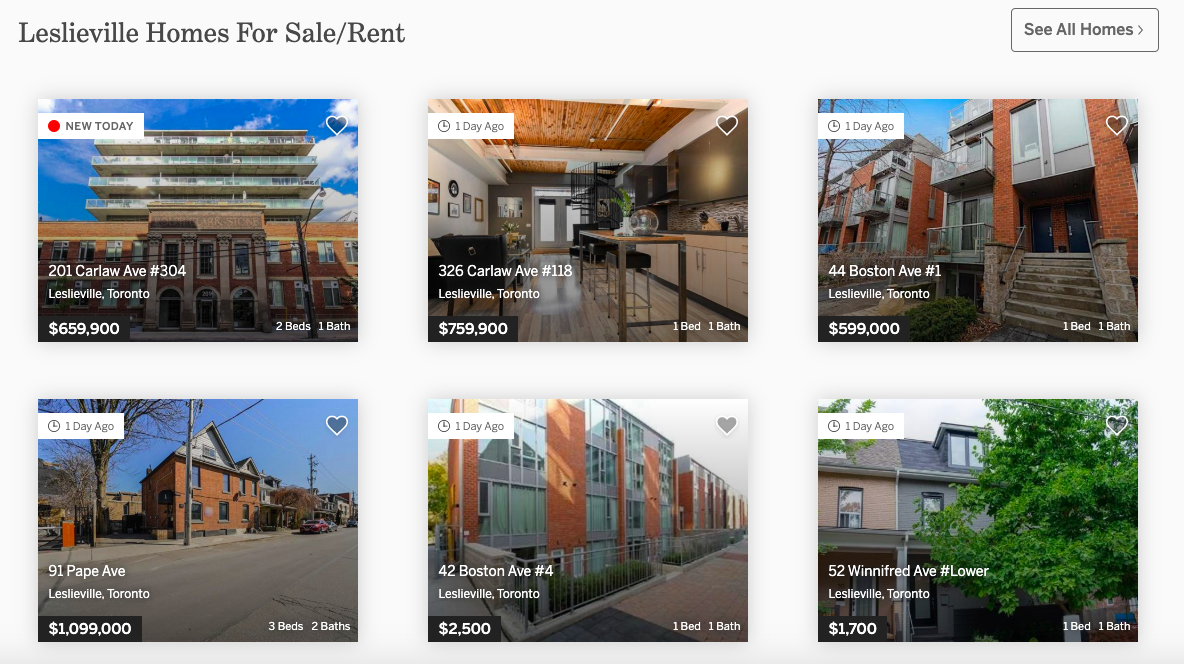
Rounding out every profile is a real-time, at-a-glance look at every property for sale or rent in the neighbourhood, educating every consumer actively looking to rent, buy, invest or sell in the current market - and those of you just starting your research.
Because when it comes to really getting a sense for a place, photos really do convey what mere words and numbers can't.
Get Started
Our neighbourhood profiles can be accessed from our interactive Toronto & GTA map by neighbourhood (read our detailed blog walk-through of the map here).
Want to see even more numbers? In our next post, we’ll walk you through our new market trend pages at Realosophy.com which give you a real time, deep dive into the real estate data you've been craving - from supply and demand to affordability metrics - for every neighbourhood, municipality and region in the Toronto and Greater Toronto Area.
Realosophy Realty Inc. Brokerage is an innovative residential real estate brokerage in Toronto. A leader in real estate analytics, Realosophy educates consumers at Realosophy.com and MoveSmartly.com and helps clients make better decisions when renting, buying, selling or investing in a home in Toronto and the Greater Toronto Area.
Email Realosophy


