Purchasing power parity is an economic theory that helps us understand how overvalued or undervalued currencies are by comparing their currencies purchasing power for identical products. A common example of purchasing power parity is the Economist Magazine's annual Big Mac index where they compare the price of a Big Mac internationally to see how overvalued or undervalued different currencies are. The theory is that if a Big Mac costs $4 Canadian, I should be able to convert my $4 into any other currency and have exactly enough money to afford a Big Mac in that country.
Last week we stumbled across a series of posts from mortgage rate website Ratehub where they extended this concept to Canada’s real estate market. Ratehub decided to look at the cost of a typical home (detached, 3 bedroom, 2 bathrooms) across a number of different cities in Canada and compare the sale price in each city to the national average.
We decided to do the same to what we know best, Toronto neighbourhoods.
Tip: Click the green arrow to minimize the legend
To calculate the implied purchasing power parity for each neighbourhood we divide the average price for a typical home (detached, 3 bedroom and 2 bathroom) in each neighbourhood by the city average for the same type of house.
For example, the average price for a typical home in Riverdale is $681,103 compared to the city average of $498,270. When we divide the average Riverdale home price by the city average we get an implied purchasing power parity of .73.
This means that houses in Riverdale are overvalued relative to the city average and that your dollar doesn’t stretch as far in Riverdale as it would in an area where the implied purchasing power parity is higher.
We loaded all the data into the above heatmap so you can play around with the map and see the implied purchasing power parity for each neighbourhood. Neighbourhoods in dark red are where you’ll find the best bang for your buck. (Remember that we aren't factoring in things like neighbourhood stability, school quality and so forth.)
Top 5 Neighbourhoods
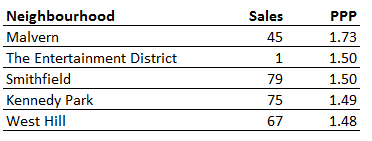
Here are the Top 5 Neighbourhoods with highest PPP (Best bang for buck):
Bottom 5 Neighbourhoods
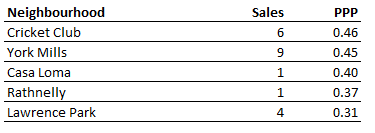
Here are the 5 Neighbourhoods with lowest PPP (Worst bang for buck):
Editor's appeal: In today's world, you’re nobody till facebook likes you. So if you enjoy reading the Move Smartly blog, please scroll to the right column of this blog and click on the facebook "like" button just under the the subscribers box. And thanks for the love!
John Pasalis is the Broker Owner of Realosophy Realty Inc in Toronto. Realosophy focuses on researching Toronto neighbourhoods to help their clients make smarter real estate decisions. Email John


