
During a turbulent year, these GTA neighbourhoods stood out for how well - or badly - their home prices held up.
As Featured in the monthly Move Smartly Report:
FREE MONTHLY WEBINAR: The Market Now with John Pasalis
Join John Pasalis, report author, leading market analyst and Move Smartly contributor, and President of Realosophy Realty, and in a free monthly webinar as he discusses key highlights this month's report and answers your questions. A must see for well-informed Toronto area real estate consumers.
Register now to get recording of latest session and access to future sessions.
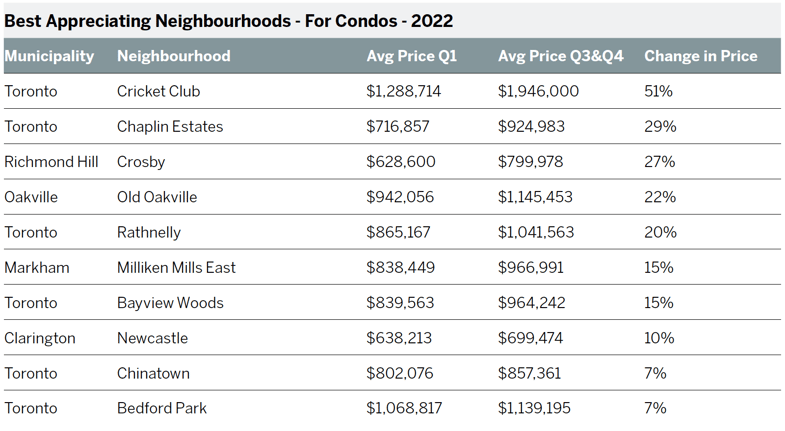
In a normal annual list looking at neighbourhood appreciation, we would typically compare the annual average home sale prices in each neighbourhood for the target year (2022 in this case) against the previous year to see how home prices have changed over that period.
But 2022 was a crazy year — given that home prices peaked during the first quarter of 2022 and then fell dramatically after that, a traditional comparison is less relevant.
What’s more interesting is to compare how home prices have changed since the peak in the first quarter of 2022.
Which areas in the Greater Toronto Area (GTA) saw the biggest decline in home prices this year and which areas saw more stability?
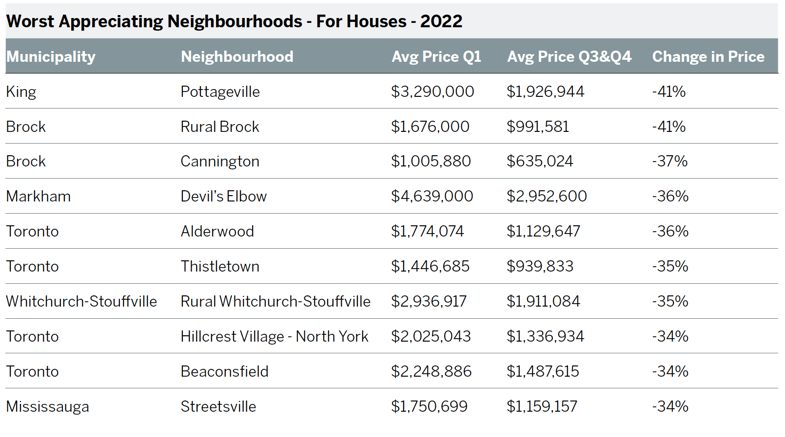
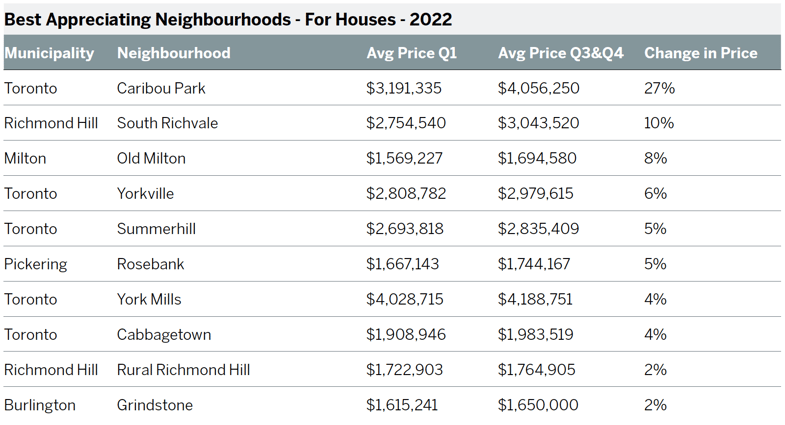
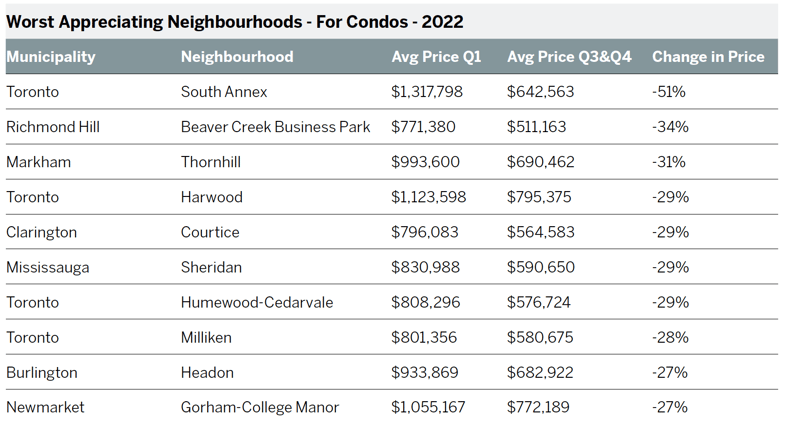
The Method
This analysis compares average prices during the first quarter of 2022 against the average during the last two quarters of 2022. The second quarter was excluded because prices were trending down during those three months before plateauing at the start of the third quarter. I decided to use the last two quarters of 2022, rather than just the fourth quarter, because prices started to flatten July onwards and because, given record lows, the number of sales were very low during this entire period so having an extra quarter of data would help increase the number of transactions for each neighbourhood. Neighbourhoods needed at least five sales in each period to have been included in the analysis.
Finally, it’s important to note that these results do not mean that all homes in a given neighbourhood declined (or increased) by the percentage indicated in this list. Neighbourhood price trends over short periods of time can always be vulnerable to shifts in the types of homes selling from one period over another (e.g., such as when a new condo is completed, etc.) which can dramatically skew the results. You should consult a real estate professional to determine how the value of your particular home may have changed over the past year.
We generate separate lists for houses and condos because different mixes of housing (i.e., lower priced condos vs. higher priced houses) will screw average price numbers, so it’s useful to look at these separately. Houses here represent all detached, semi-detached, townhomes and linked homes while condos include condo building apartments and townhomes.
The one noteworthy trend from the worst appreciating list is that the top three neighbourhoods for houses are small communities on the outskirts of the GTA. These types of communities saw a big surge in demand for homes during the Covid-19 pandemic, as movers sought out more space during lockdown and work-from-home protocols, and a resulting spike in prices, are now adjusting down faster than other areas.
In the worst appreciating list for condos, it’s noteworthy that the list contains a mix of neighbourhoods from all five of the GTA regions, again suggesting that when it comes to condos, it’s important to consider each building, complex and area carefully.
Similarly, the best appreciating lists for both houses and condos are a real mix of neighbourhood types throughout the GTA, including many that we often see on these types of lists, such as Caribou Park and Yorkville. Also, unlike the worst appreciating list, the best appreciating neighbourhoods for houses, except for one or two exceptions, saw very modest appreciation gains when compared to gains in neighbourhoods for condos.
Top Image Credit: Getty/iStock
The Move Smartly monthly report is powered by Realosophy Realty, an innovative residential real estate brokerage in Toronto. A leader in real estate analytics, Realosophy educates consumers at Realosophy.com and MoveSmartly.com and helps clients make better decisions when buying and selling a home.
John Pasalis is President of Realosophy Realty. A specialist in real estate data analysis, John’s research focuses on unlocking micro trends in the Greater Toronto Area real estate market. His research has been utilized by the Bank of Canada, the Canadian Mortgage and Housing Corporation (CMHC) and the International Monetary Fund (IMF).
Published: January 27, 2023


