Author John Pasalis is the President of Realosophy Realty, a Toronto real estate brokerage which uses data analysis to advise residential real estate buyers, sellers and investors. He is a top contributor at Move Smartly, a frequent commentator in the media and researcher cited by the Bank of Canada and others.

See John's Full Bio

Contact John 

Move Smartly Report - Jan 2023_Cover-1
Download a PDF version of this guide.
Download Report

Chapters

1

The Market Now: December Number Recap

2

Key Issue: A Look Back at Toronto’s Housing Market in 2022

3

Key Issue: Trends to Look for in Toronto’s Housing Market in 2023

4

Key Issue: Canada’s Immigration Policies are Driving Up Housing Costs

5

Data Dive: Best and Worst Appreciating GTA Neighbourhoods in 2022

6

Monthly Statistics: December 2022

Get Our Monthly and Special Reports in Your Inbox.

FREE PUBLIC WEBINAR: WATCH REPORT HIGHLIGHTS & Q/A - Thurs Jan 12th 12PM ET

Public Webinar Social – Jan 2023_MoveSmartly_ 600x300-1

Join John Pasalis, report author, market analyst and President of Realosophy Realty, in a free monthly webinar as he discusses key highlights from this report, with added timely observations about new emerging issues, and answers your questions. A must see for well-informed Toronto area real estate consumers.

Sign Up Now >


The Market Now

After a tumultuous year, the Greater Toronto Area (GTA) saw 74,559 home sales in 2022, a 38% decline over 2021. The average price for a home in 2021 reached $1,197,481, up 8.7% over 2021. But the annual average sale price is a misleading metric and is being skewed up by the extremely high number of sales during the first quarter of 2022, even though prices have declined by over 20% since then (see 2022 Review in report below).

Looking at the most recent monthly statistics for the Greater Toronto Area (GTA) market available for December 2022, we’re seeing that even as sales numbers remain extremely low, home prices have stabilized since July in part because there are relatively few homes available for sale.

The average price for a house was $1,307,513 in December, down 22% from the most recent peak of $1,679,429 in February, and down 12% over the same month last year. The median house price in December was $1,100,000, down 26% from $1,485,000 in February, and down 17% over last year.

House sales in December were down 46% over last year while new house listings were down 25% compared to last year. The number of houses available for sale at the end of the month, or active listings, was up 179% over last year, when demand was notably high; excluding that year, the active listings number today is well below historical norms for the month of December. 

The Months of Inventory (MOI) which is a measure of inventory relative to the number of sales each month (see Monthly Statistics section below for more information on this measure) was unchanged at 2.4 MOI in December, indicating tight supply conditions.

The average price for a condo fell to $721,885 in December, down 14% from the most recent peak of $840,444 in March, and down 2% over last year. The median price for a condo in December was $645,000, down from $777,000 in March and down 4% over last year.

Condo sales in December were down 52% over last year and below pre Covid-19 pandemic sales volumes for the month in 2019. New condo listings were down 19% over last year while the number of active condo listings was up 140% over last year. The MOI increased slightly to 3.3 MOI in December, indicating that supply is slightly less constrained for condos than for houses.

For detailed monthly statistics for the Toronto Area, including house, condo and regional breakdowns, see the final section of this report.


I like to start the new year by reviewing the past year in Toronto’s housing market and to identify the key trends that I believe ended up mattering the most.

In addition to data on average prices, sales and listing inventory, I take note of what was sentiment on the ground and how did it evolve over time?

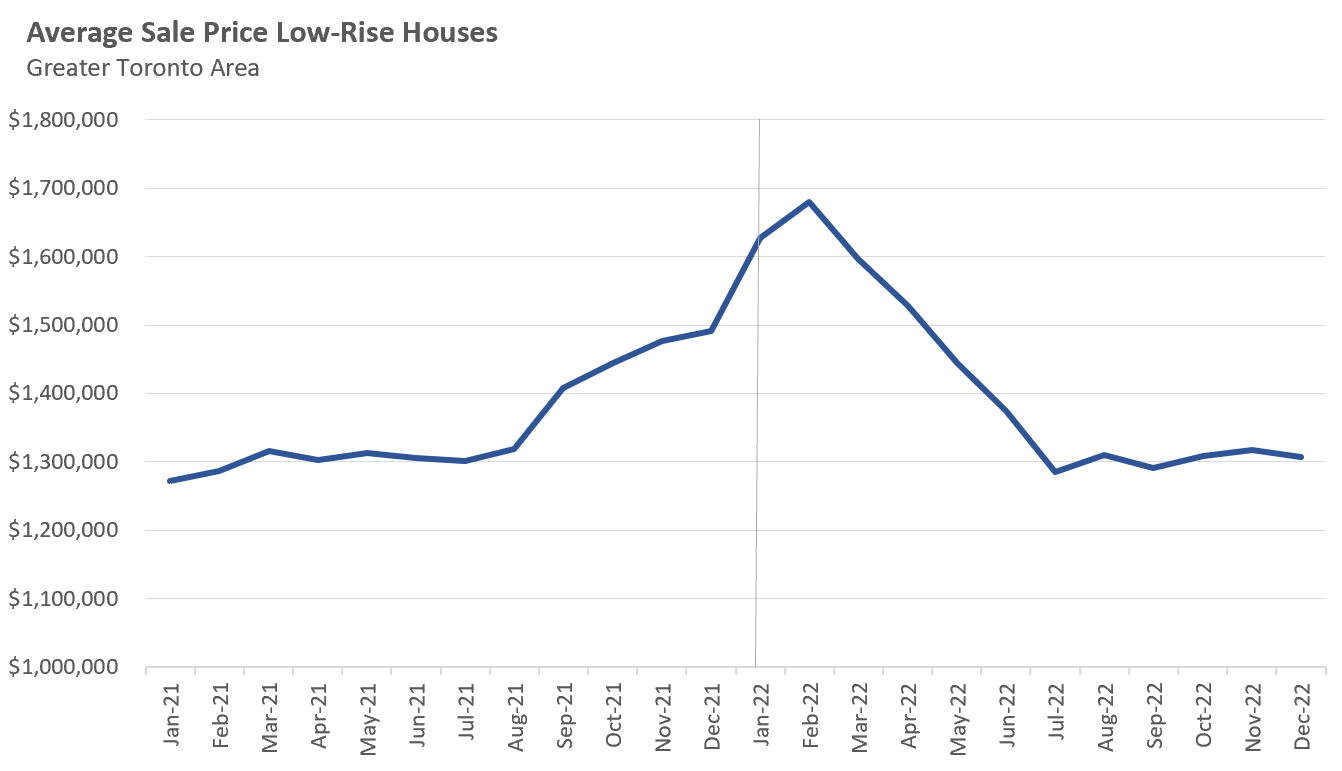
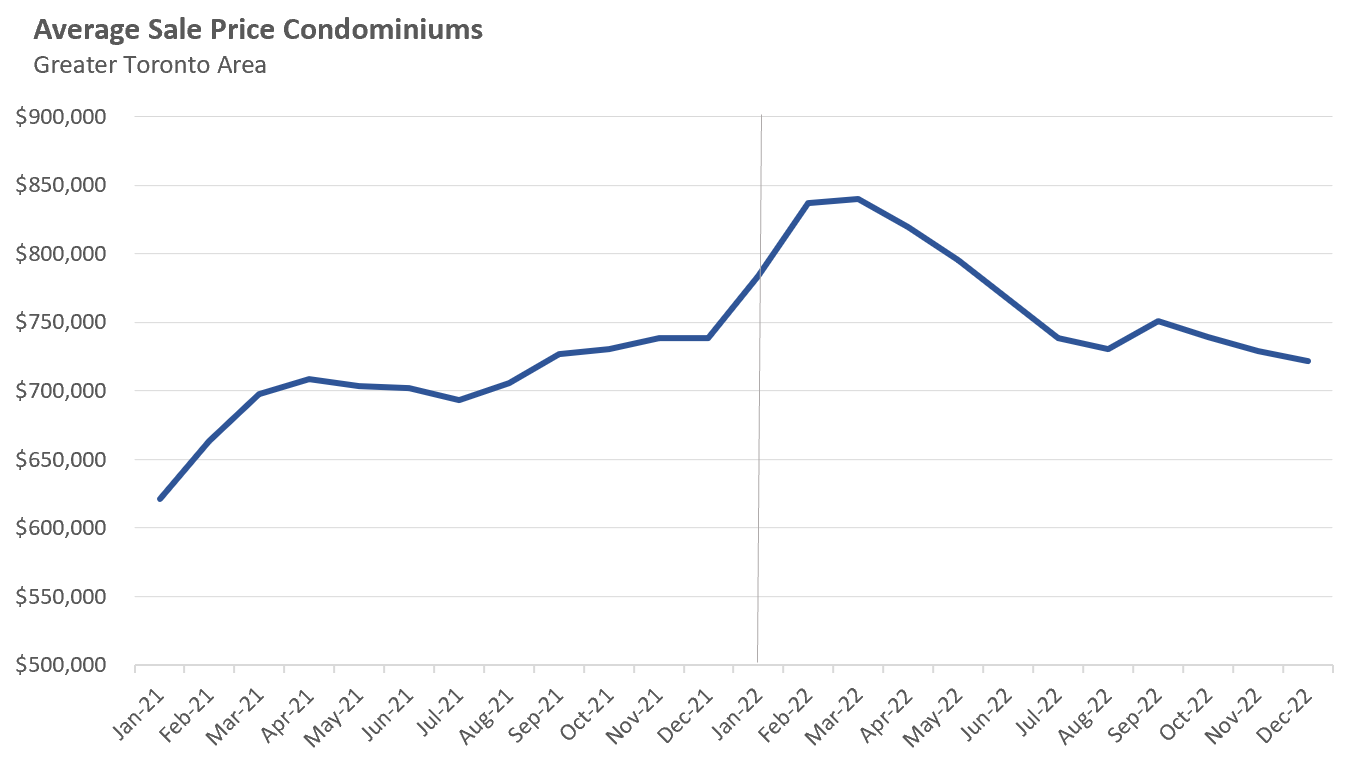
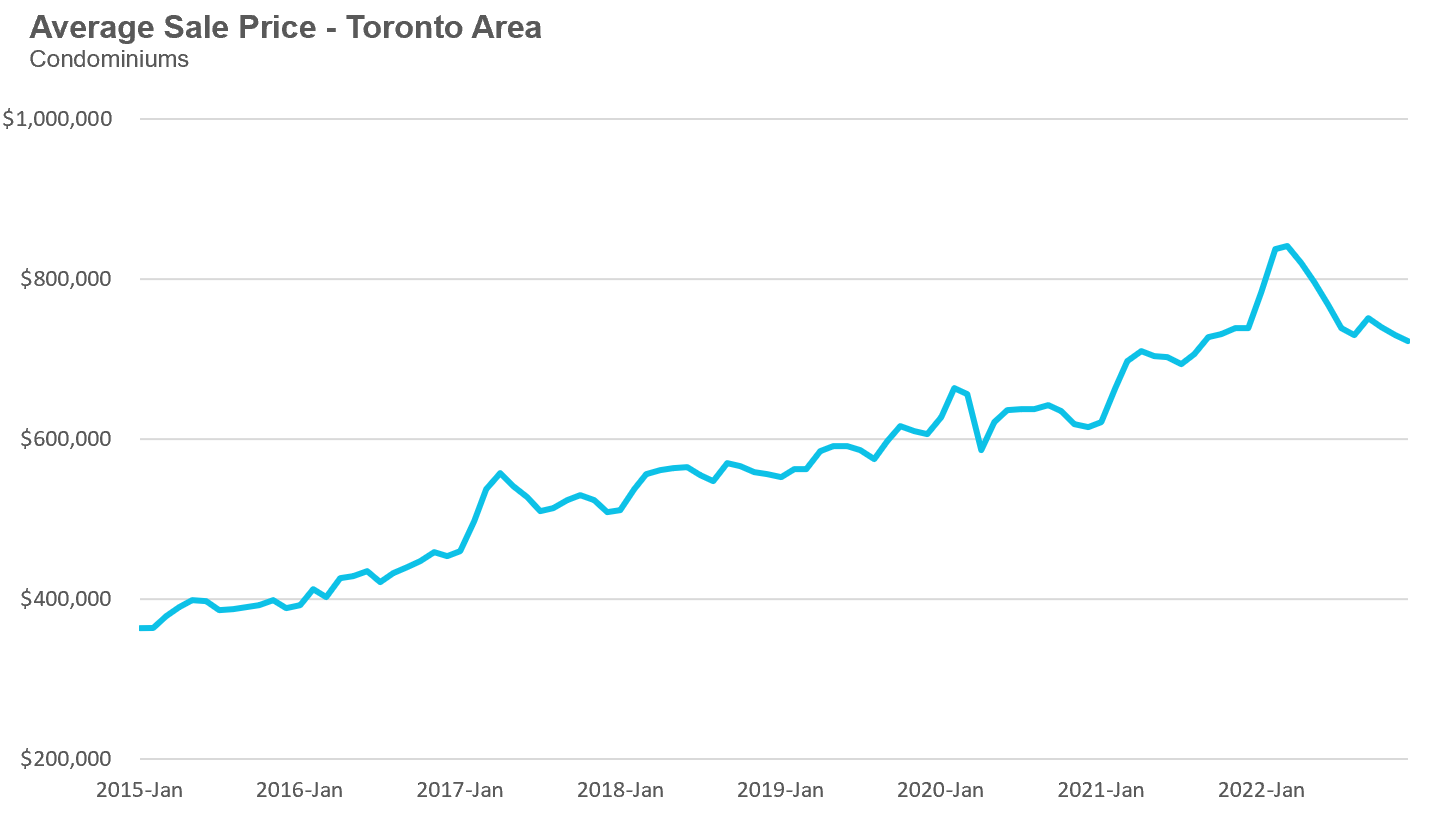
Since trends in the first quarter of a year are a continuation of the quarter preceding it, I start by looking back to the end of 2021. The following two charts show the average price, first for low-rise houses and then for condominium buildings and townhouses (condos) in 2021 and 2022, with a vertical line marking the start of 2022. 


From these charts, we can see that both low-rise houses and condos saw prices begin to accelerate in 2021. 

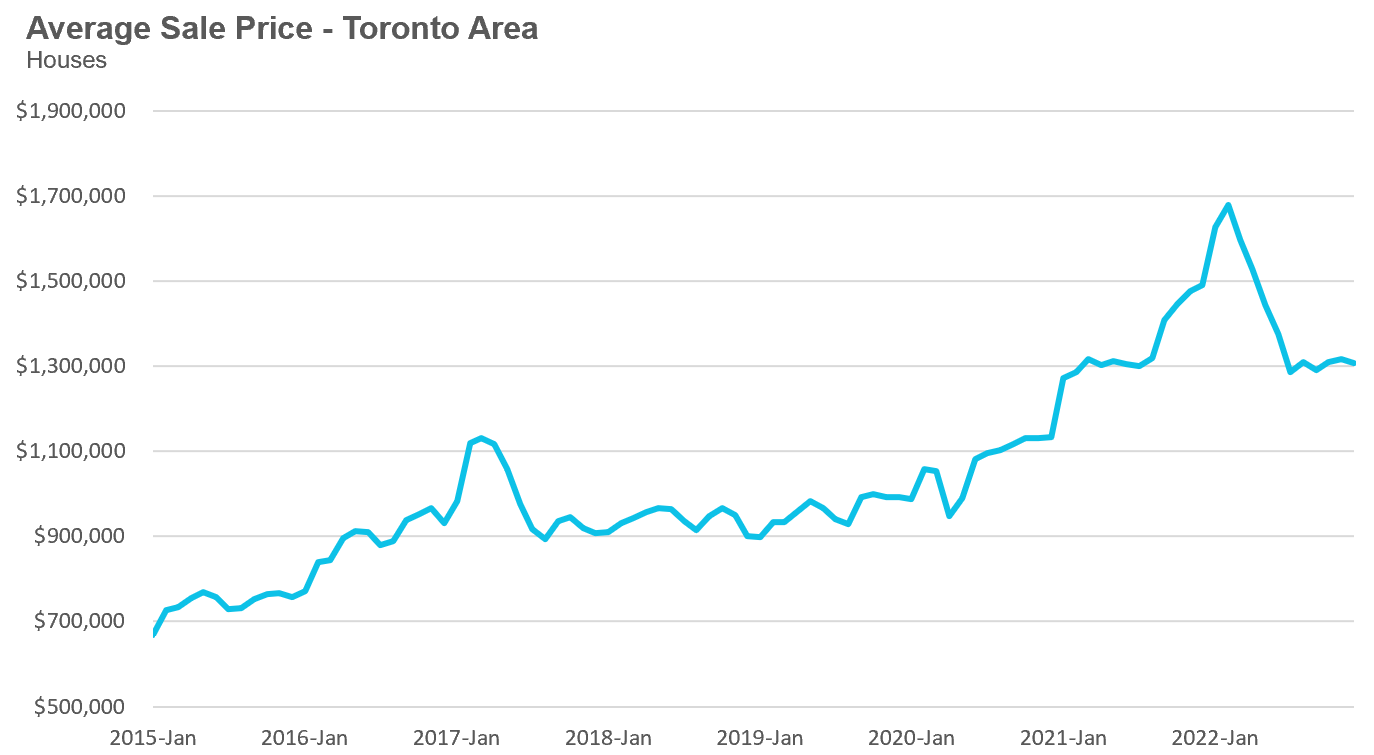
The low-rise market in particular was quite interesting because from January to August of 2021, prices were flat and the market was very balanced, before average prices took off, climbing from $1.32M in August 2021 to a peak of at $1.68M in February 2022, a 27% increase in just 6 months. 

Condo prices accelerated 19% over that same period. 

There’s no concrete explanation for why the market went from being relatively calm during the first half of 2021 to a frenzied one, other than an irrational exuberance leading to bubble conditions that peaked in early 2022. 

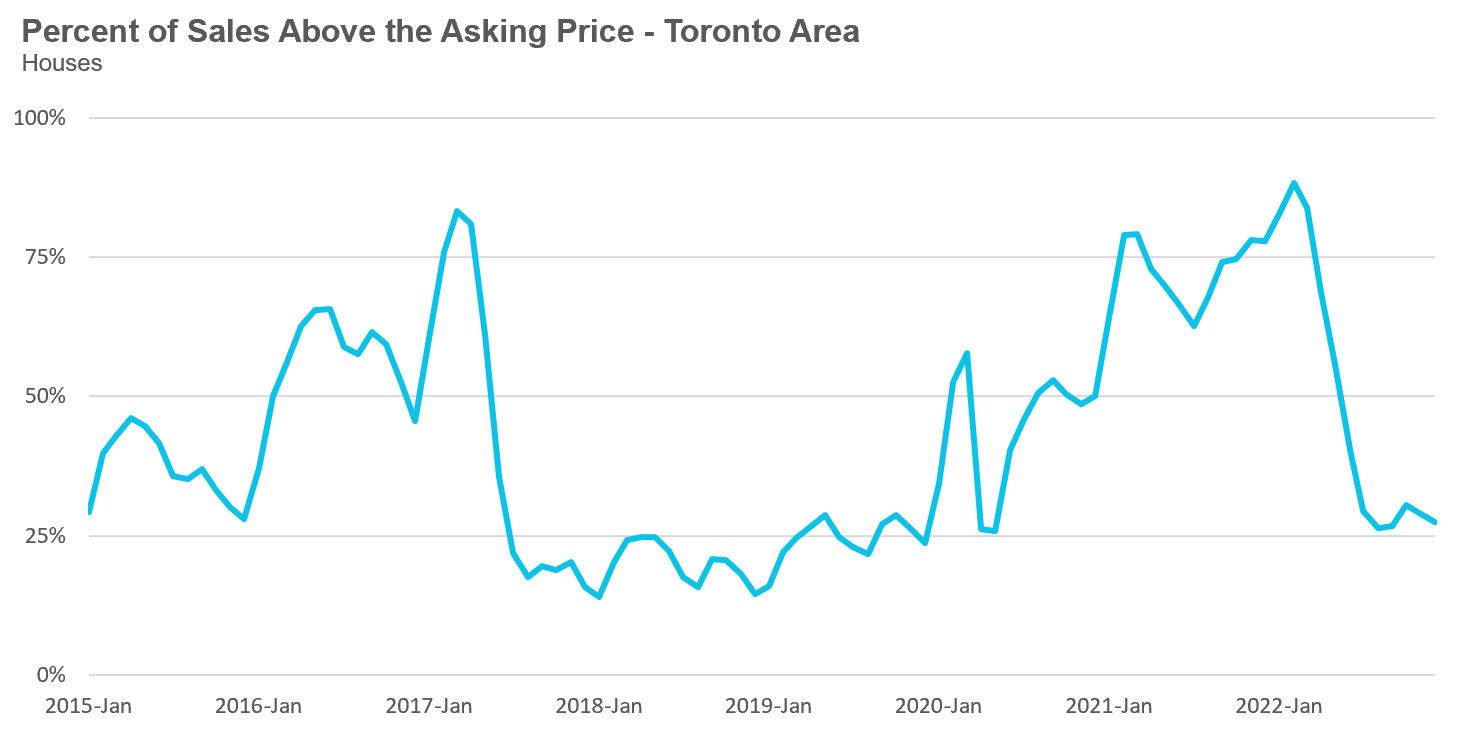
In the first two months of 2022, the market was unbelievably competitive with 9 in 10 low-rise houses (and 8 in 10 condos) receiving multiple offers and selling for more than the property’s list (or asking) price. In many cases, low-rise houses were receiving upwards of 50 offers on their offer nights from desperate buyers eager to buy a home. 

While sellers and their agents often list homes with artificially low asking prices to generate more buyer interest and multiple offers, this strategy rarely works on almost every home listed for sale. For example, for most of 2018 and 2019, fewer than 25% of homes received multiple offers and sold for more than the seller’s asking price. During the first quarter of 2022, 9 in 10 homes were receiving multiple offers because buyers were buying anything, they were desperate.

But towards the end of February 2022, I started to notice some early signs of the housing market cooling, which I wrote about in my March 2022 report here. The earliest signs were homes receiving fewer showings, getting fewer offers on offer nights and in some cases not even selling on their offer night because it didn’t attract a price the seller was happy with. 

So why this sudden decline in demand?

This again is very hard to say with any certainty, but I think there were two primary reasons. 

Firstly, after such a frenzied market, buyers who kept losing out on multiple offers week after week gave up and moved to the sidelines as buyer fatigue set in. The other big factor was that the media headlines turned more pessimistic, with the message that the Bank of Canada was likely going to raise rates aggressively to cool Canada’s high inflation rate which would likely result in a chill in house prices. No buyer wants to be caught out buying at the peak of a market. 

Many of the sellers who had bought homes in January or February 2022 and still needed to sell their current home started to panic when they found that demand had cooled and they were getting far fewer showings than they expected. Every week that passed, more sellers were willing to sell for less than what their neighbours sold for the week earlier for the security of having a firm sale agreement in place in order to get a mortgage on the home they had purchased. 

After average low-rise home prices peaked at $1.68M in February, they fell to $1.29M by July, a $394K or 23% decrease in just five months. I discuss the dynamics during this period in more detail in my September 2022 report

As we moved towards the summer months of 2022, the volume of monthly sales hit 20-year lows, a decline that was largely driven by the surge in interest rates which made it harder for buyers to qualify for a mortgage. By July, the Bank of Canada had increased rates from 0.25% to 2.5% and most analysts were expecting more hikes in the future. 

But in spite of sales hitting these 20-year lows, something unexpected happened — rather than home prices falling further as would be expected, prices stayed flat or plateaued from July till the end of 2022. 

One of the primary reasons that prices plateaued is because the decline in sales was accompanied by a decline in the number of new homes coming onto the market as sellers were becoming more stubborn and unwilling to reduce their price and sell in a slower market. In my September 2022 report, I showed that there was a big increase in the number of homes that were simply being taken off the market by sellers or were being rented after the owner was unsuccessful at selling for their desired price.

And this is how 2022 ended with six consecutive months of low sales, low listings and relatively flat prices. 

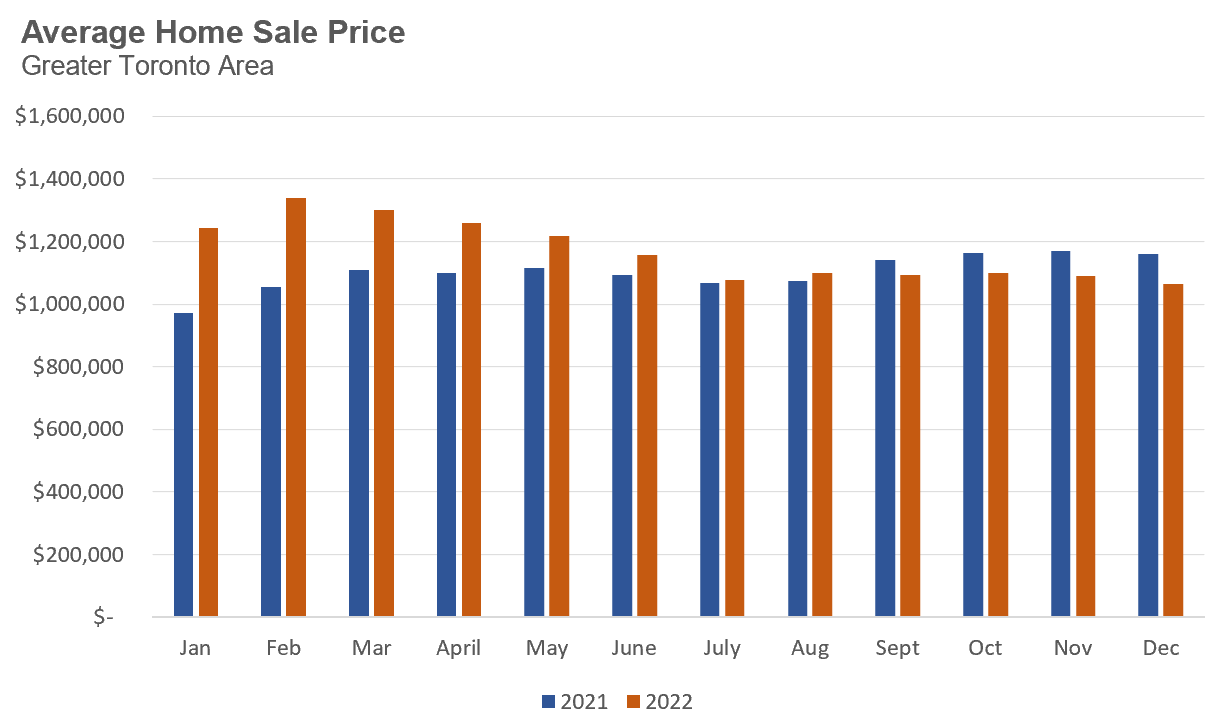
Before wrapping up my year in review, it’s worth highlighting one odd statistic that some might stumble across when looking at annual statistics comparing 2022 and 2021. Even though total sales transactions were down 38% when compared to 2021, the average price for all homes was up 8.6% in 2022 over the previous year. 

Just how can annual prices be up given the dramatic decline in sales caused by one of the fastest rate hiking cycles ever?

Firstly, if we compare sale prices by month in 2021 and 2022 we see that even though average prices today are well below the peak reached in February 2022, average prices were up from January to August 2022 when compared year-over-year to corresponding months in 2021.


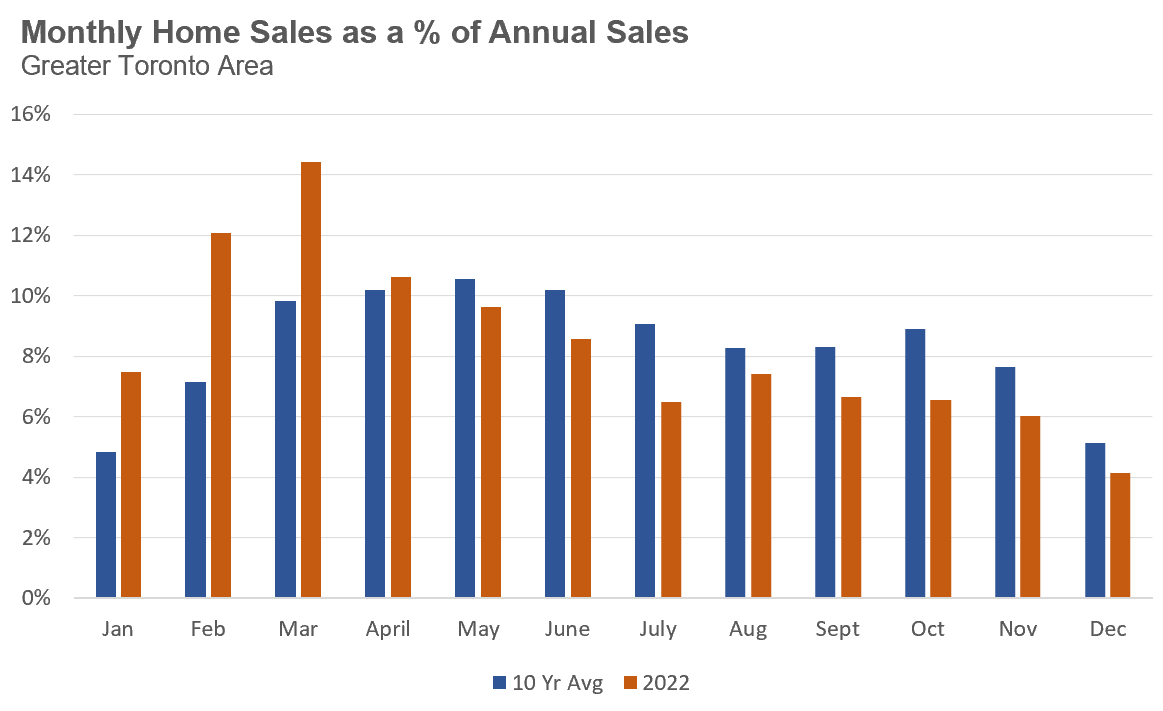
Furthermore, a disproportionate number of sales in 2022 occurred during the first quarter, when prices were at their highest, and before sales fell dramatically.


Looking at sales each month as a % of annual sales for 2022 over the previous 10 years in the above chart, we can see that a far greater share of sales in 2022 occurred during the first quarter, which is helping to skew the annual average price for homes in 2022 up. 

While the average sales price in 2022 is technically up for the year, it’s the notable downward trend that marked the last six months of 2022 that has mattered most as we enter 2023.


Each new year, we see predictions about the future path of home prices over the next twelve months. But I learned first-hand a long time ago that forecasting Toronto home prices is a ‘mug’s game’, especially during periods of economic uncertainty. 

Toronto’s housing market has taken many dramatic turns over the past few years. 

The demand for homes and home prices surprisingly accelerated in late 2020 in the early days of the COVID pandemic. Prices then flattened out for most of 2021, before an irrational exuberance picked up toward the end of 2021 and into the first quarter of 2022 pushing home prices to record highs (as discussed above in this report). In the second quarter of 2022, buyer fatigue and rapidly rising interest rates then resulted in prices falling over 20% in five months from March onwards and staying flat from July onwards. 

Every one of these changes was unpredictable. 

For example, the Covid pandemic itself was a surprise, as was the market’s sudden take-off after an initial slowdown (just listen to our Move Smartly summit experts back in July 2020 to see how different many thought the rest of 2020 would look). And while it’s not surprising that rising interest rates (and mere talk of it) would cool the market, nothing suggested why the market should have become so frenzied just before, to the point where buyer fatigue was starting to cool down the market even prior to rate increases. And the rapid interest rates introduced by central banks around the world were also the result of a persistent inflation remaining long after most experts thought transitory inflation would recede as Covid-19 pandemic effects receded. 

While we can normally make educated guesses about the future path of home prices in the short-term, it’s obviously a lot harder to do this when the market has been as volatile as it’s been over the past three years. 

Given this, rather than make a single forecast about the future, I find it’s more helpful to consider the different potential paths for home prices, the factors that might lead prices to move one way versus another and how likely it is that prices will move in those directions.


Will Prices Rise, Stay Flat or Fall Further? 

Let’s consider a simple model with three possible outcomes: 1) home prices remain relatively constant, 2) home prices decline and 3) home prices increase. While it’s technically possible that we’ll see home prices rise in 2023, the likelihood of that happening is extremely low when compared to the other two options — prices remaining relatively flat or falling. 

Below I’ll highlight the factors that might make the difference between prices remaining flat versus falling over the next twelve months.


Macro Economic Factors

The most important metric that will drive the future path of home prices is the inflation rate, which will largely dictate where interest rates will go.

While most economists expect interest rates to remain high in 2023, there is the question of how long? If the inflation rate remains stubbornly high then we will be stuck with elevated interest rates for a longer period of time which could have a big impact on the housing market in 2024 as well, and the number of home owners who may struggle to keep up with mortgage payments may increase (more on this next).

Given the impact of rising rates, there is also the risk of a recession in 2023. How a potential recession impacts the housing market will depend on how deep and prolonged the recession is — job losses resulting from a wider economic slowdown obviously are strongly linked to poor outcomes from the housing market.


Financial Distress

It’s been less than a year since the Bank of Canada started to raise interest rates and we have yet to see much financial distress from home owners or real estate investors. While some of course are already feeling the impact of inflation on food and other prices, the impact of today’s higher rates has not yet been felt by those locked into a mortgage with fixed monthly payments.  

This will change as more and more households renew their mortgages over the next twelve months and face a big increase in their monthly mortgage payment when they renew at today’s much higher interest rates.

While we know that there will be distressed households over the next year who will need to sell their homes, the important question will be whether the number of distressed sellers will be high enough to materially impact the supply of homes coming onto the market. 

I’m not entirely convinced that we’ll see enough distressed sellers in the low-rise house market to materially impact home prices. 

Mortgage insurers and banks appear to be willing to allow existing home owners to extend their amortization period when renewing their mortgages in order to lower the payment shock they would otherwise experience. (As a reminder, extending the amortization period from 25-years to 30-years, lowers an owner's mortgage payments by spreading their payments over a longer period.) This is not an optimal solution for households who are eager to pay down their mortgage sooner rather than later, but some will find themselves forced into this position in order to reduce their monthly mortgage payment. In addition, the majority of low-rise house owners are end-users (i.e., those who live in the homes themselves) who, experience has shown, will cut back on all other expenses to keep up their mortgage payments.

The one segment of the market where we are more likely to see financial distress is in the condo sector since a far greater share is owned by investors as opposed to end-users. Investors tend to be more leveraged than the average household and if they want to reduce their monthly debt obligations, they are going to sell their investment property before selling their family home. 

While this is an important vulnerability I’ll be keeping an eye on, I’m not convinced it’s going to be a material risk in 2023. Investors have been flocking to condos (and even houses) over the past 5 years in the GTA and have seen significant appreciation on their properties, allowing many to be able to refinance or handle rising costs with relative ease due to the built-up equity they have realized. 

However, within this group, there is a segment that may be more vulnerable, which I discuss next. 


Pre-Construction Condos

There are a couple of important risks in the pre-construction (pre-con) condo market that we’ll need to keep an eye on. 

Firstly, the Toronto area has a record over 32,000 condominiums scheduled for completion in 2023, with more than 18,000 of those scheduled for the first half of the year. 

The vast majority of these condo units were bought many years ago, so in most cases, investors have seen the value of their units increase since they bought. But even if the value of their units are up, once it’s time to take possession of their completed condos, some investors are going to find that it’s a lot harder to get a mortgage when they need their incomes to qualify them at an over 7% ‘stress-test’ interest rate. While there will be some investors who will be unable to close on their units, forcing them to sell them, it’s hard to say if these numbers will be high enough to materially impact the market in terms of significantly lower prices.

The other challenge these investors are facing is that even if they can close on their units and get a mortgage, their mortgage is going to be at today’s high interest rates which will materially impact the monthly cash flow of their units. Even in the best of times, when interest rates were well below 3%, the high prices of pre-con condos have made them negative cash flow investments, which means that any rental income they generate isn’t high enough to cover the mortgage payments and expenses for the unit. As I’ve explained frequently, these investors were ok with losing money each month in the belief that their units would see good price appreciation year after year.

At interest rates above 5%, I suspect many of these investors will be losing more cash each month which is going to be harder to accept when the likelihood that the value of their unit will rise in the near term has now come down given current market conditions. 

Given this, I would not be surprised if we see an above average share of investors sell their newly completed condominiums shortly after completion — so this is one segment that I will be tracking most closely. 


Ask a Canadian why home prices are so high and you’ll certainly get a whole host of answers from foreign buyers to greedy investors and, up to recently, a long period of low interest rates. 

But the most common answer you are likely to hear is that a lack of supply of new housing in Canada is the primary cause for the high cost of housing. 

The lack of supply narrative has been the dominant explanation for high home prices in Canada over the past five years. Every level of government in Canada cites a lack of supply as the primary cause for high home prices and countless academic and bank economists have made the same argument. Scotiabank’s chief economist went so far as to argue that a lack of supply was the underlying cause “for rising prices and diminished affordability”. When an economist says A causes B they mean that the relationship is a statistical fact rather than an opinion. 

The debate regarding the key drivers of high home prices has been so one-sided it led Howard Anglin, former Deputy Chief of Staff under Stephen Harper, to write a column in the Hub in 2021 titled, The one factor in the housing bubble that our leaders won’t talk about

What’s the one factor not talked about? How Canada’s immigration boom is impacting the demand for housing and, by extension, increasing the cost of housing.

Over the previous decade, Canada admitted roughly 275,00 new immigrants each year. In 2022, Canada saw a record 431,645 new permanent residents and this number is expected to reach 500,000 annually by 2025.  


An Unequal Two-Sided Problem

When considering these two demand and supply factors alone, demand for homes due to changes to Canada’s immigration level and the lack of supply of new homes to meet this demand, we see an interesting phenomenon. One factor, the lack of supply, has been discussed for many years, and year after year, political efforts to mitigate this issue have failed. The other factor, immigration, is one that policy makers have far more control over.

Policy makers don’t have any direct control over the number of new homes developers launch and complete each year, a number that has always been hard to achieve due to labour shortages and other factors, and is only expected to decline in the years ahead due to higher interest rates and the current economic uncertainty. 

So why has the debate about the high cost of housing focused on a solution that policy makers have no direct control over, building more homes, as opposed to addressing the demand for housing from changes in our immigration level, something policy makers have direct control over?

I’ll highlight what I believe are the two primary reasons.


The False Lure of the Zoning Panacea 

A popular area of academic research has been to explore the role that local zoning policies have on the supply of new housing and home prices, and the academic conclusions on the surface sound very intuitive. 

Municipalities that have relatively few zoning restrictions on the supply of new housing tend to have more affordable homes and experience more moderate growth in house prices because builders can more easily adjust to changes in demand by building more homes. Academics also argue that these cities with few zoning restrictions have fewer and shorter housing bubbles. 

I’ll admit, it’s a wonderful story! If cities simply remove zoning barriers to new housing, builders will flood our market with new homes putting an end to years of rapid price growth and leaving us with an affordable housing market for all.  

Unfortunately the academic theories don’t hold up very well in the real world. Many of the cities that economists cite as having relaxed zoning policies which, in theory, should see modest price growth, such as U.S. cities like Houston, Atlanta and Charlotte, have all seen a significant surge in home prices over the past decade. Cities like Phoenix in the U.S. and Dubai more globally that have relatively relaxed zoning policies experienced housing bubbles during the first decade of the 2000s because the supply of housing wasn’t able to keep up with the sudden surge in demand from investors.  

The fact is that even with relaxed zoning policies, it’s very hard for the construction sector to respond to a rapid surge in demand for housing.

A report by the Bank of Montreal found that countries with higher rates of population growth also saw the most rapid increase in home prices, a result that is intuitively obvious, and one we are seeing in Canada. While it’s very easy for our government to double the number of immigrants moving to Canada each year, it’s extremely hard for them to double the number of homes being built to house these new Canadians. When housing completions don’t increase enough to match a country’s immigration goals, the result is what we are experiencing in Canada, a spike in the cost of housing. 

Despite the evidence, the solution to our housing crisis promoted by our policy makers and expert economists continues to be rooted in the delusion that housing supply can respond to any sudden surge in the demand for housing — if we simply reform zoning policies. 

This does not mean supply-side reforms that encourage more housing and more density are not important, they are. But supply-side policies alone are not the panacea to our housing crisis that some academics and economists make them out to be. 


A Politically Sensitive Issue

The other likely reason that many economists have argued that a lack of supply is the cause for high home prices is because any suggestion that Canada’s record high immigration levels may in fact be the bigger driver of home prices runs the risk of being called xenophobic. I’ve experienced this myself from self-described “housing advocates” who believe that with the right zoning reforms, there is no limit to how many homes Canada can build. 

But questioning what is the right level of immigration for our country, and whether the current level is doing more harm than good isn’t xenophobic at all. It’s a critical policy question that for a long time has been ignored out of fear that one might be called a racist for even raising the question.

But the times are changing.

Over the past month we have seen a significant shift in this discussion. More journalists, economists and editorials are questioning the goal of our federal government's immigration strategy and whether their current immigration targets are doing more harm than good?

After years of silence regarding the impact our government’s immigration policies are having on healthcare, housing and wages, more and more experts are starting to ask some very important questions. And not surprisingly, in virtually every column the author clarifies that they are not xenophobic or against immigration, but are noting some of the negative side effects from our country’s aggressive immigration strategy. 

Why are more experts starting to talk about our government’s immigration targets?

It’s becoming clearer that the federal Liberal government’s strategy to nearly double the number of immigrants admitted to Canada each year without making the necessary investments to support them is straining our housing markets and healthcare system


A Demand Crush that Further Hurts Renters

The other important factor is that many of the negative side effects of Canada’s immigration strategy are starting to be felt most by the poorest and most marginalized communities in Canada — including many of these immigrants themselves. 

While the discussion about Canada’s housing crisis often centres around the high price of homes and its impact on first time buyers, a bigger concern should be how our government's policies are driving up the cost of renting as renters typically have much lower household incomes as compared to home owners and unlike home owners they don’t benefit financially from the rising cost of housing.

To provide some context to the recent acceleration in rents, it is helpful to compare how average rents have changed before and after the current Liberal government took office in 2015. 

Under the previous federal Conservative government, the average rent for a Toronto condominium went from $1,570 in 2006 to $1,866 in 2015, a $297 or 19% increase in nine years. In contrast, average rents under our current Liberal government have climbed from $1,866 in 2015 to $2,657 in 2022, a $791 or 42% increase in just seven years. 

Am I suggesting that our current government’s change in immigration policy alone is responsible for this outsized increase in average rents in Toronto? Of course not, but of the most common explanations for the high cost of housing, from foreign buyers to low interest rates and even irrational exuberance, this one has the most direct impact on rents. 

Calculating the demand and price of a property is more complex as the source of capital and the cost of debt are all important factors, alongside the usual factors such as the number of households requiring housing. Rent, on the other hand, is simply the cost of housing services, a cost more closely linked to the demand and supply for housing services, and not as impacted by other factors.

It’s worth noting that the higher appreciation in condo rents since 2015 was not due to a lack of building. Average annual condo completions were 12% higher after 2015 when compared to the period before 2015. This additional supply didn’t cool condo rents because Canada’s population was growing faster than these housing completions. 


The Impact of — and on — Foreign Students 

The other aspect of Canada’s immigration policies that is often overlooked is the growth in the number of international students attending universities, which are not directly included in Canada’s immigration numbers today. An important part of Canada’s immigration pipeline, the number of foreign study permit holders in Canada has climbed from 352,330 in 2015 to 621,565 in 2021.  

The Globe and Mail’s Matt Lundy argues that there is a simple explanation for this boom in foreign students: money. 

The annual tuition for foreign students is five times what domestic students pay, so post-secondary institutions are doing what any profit maximizing corporation would do, they are admitting as many foreign students as they can. 

But unlike Canada’s program for permanent residents, there are no targets for foreign study permit holders — post-secondary institutions can admit as many students as they want each year. But while these institutions have the right to maximise their profits by admitting as many foreign students as possible, they have no obligation to ensure there is adequate housing for the students they are admitting. The lack of planning and investment from post-secondary institutions into the housing needs of their students means that the burden of Canada’s housing crisis has fallen in part on these often financially-stretched students who are moving to Canada for a better life, but are left feeling exploited. When foreign students are fighting for the most affordable rentals in their community, it also puts pressure on low-income households looking for the same.

It’s time to start asking harder questions about the negative side effects of Canada's immigration policy. As economist David Green wrote, immigration is not some magic pill for saving the economy


Who doesn’t like a Top 10 list to kick off  the New Year?

In a normal annual list looking at neighbourhood appreciation, we would typically compare the annual average home sale prices in each neighbourhood for the target year (2022 in this case) against the previous year to see how home prices have changed over that period. 

But 2022 was a crazy year — given that home prices peaked during the first quarter of 2022 and then fell dramatically after that, a traditional comparison is less relevant. 

What’s more interesting is to compare how home prices have changed since the peak in the first quarter of 2022. 

Which areas in the Greater Toronto Area (GTA) saw the biggest decline in home prices this year and which areas saw more stability?


The Method

This analysis compares average prices during the first quarter of 2022 against the average during the last two quarters of 2022. The second quarter was excluded because prices were trending down during those three months before plateauing at the start of the third quarter. I decided to use the last two quarters of 2022, rather than just the fourth quarter, because prices started to flatten July onwards and because, given record lows, the number of sales were very low during this entire period so having an extra quarter of data would help increase the number of transactions for each neighbourhood. Neighbourhoods needed at least five sales in each period to have been included in the analysis. 

Finally, it’s important to note that these results do not mean that all homes in a given neighbourhood declined (or increased) by the percentage indicated in this list. Neighbourhood price trends over short periods of time can always be vulnerable to shifts in the types of homes selling from one period over another (e.g., such as when a new condo is completed, etc.) which can dramatically skew the results. You should consult a real estate professional to determine how the value of your particular home may have changed over the past year. 

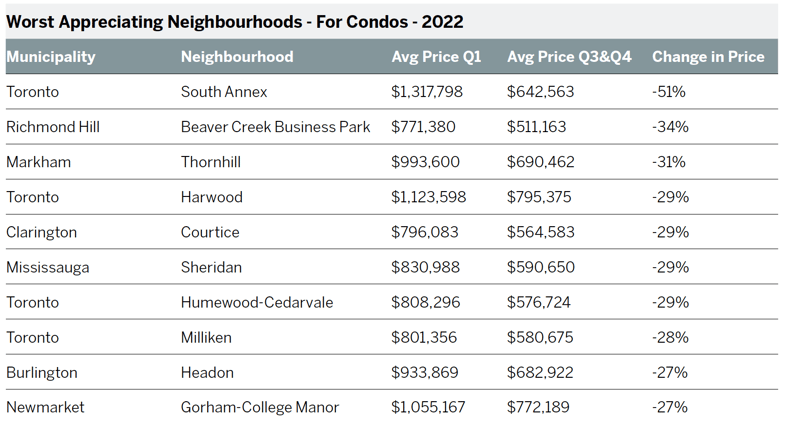
We generate separate lists for houses and condos because different mixes of housing (i.e., lower priced condos vs. higher priced houses) will screw average price numbers, so it’s useful to look at these separately. Houses here represent all detached, semi-detached, townhomes and linked homes while condos include condo building apartments and townhomes. 

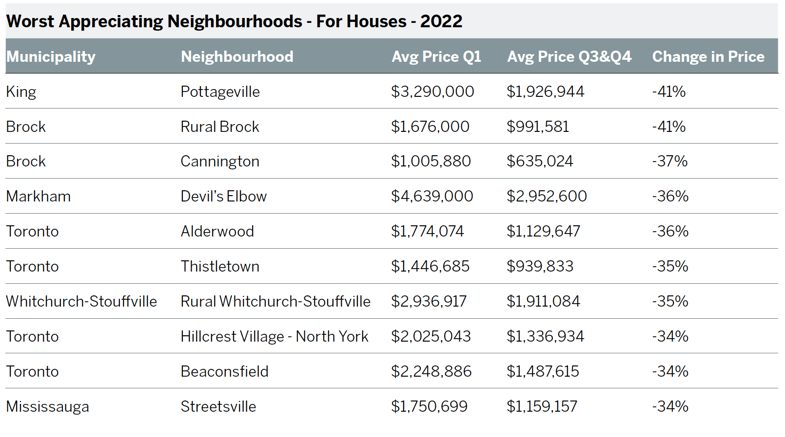
The one noteworthy trend from the worst appreciating list is that the top three neighbourhoods for houses are small communities on the outskirts of the GTA. These types of communities saw a big surge in demand for homes during the Covid-19 pandemic, as movers sought out more space during lockdown and work-from-home protocols, and a resulting spike in prices, are now adjusting down faster than other areas. 

In the worst appreciating list for condos, it’s noteworthy that the list contains a mix of neighbourhoods from all five of the GTA regions, again suggesting that when it comes to condos, it’s important to consider each building, complex and area carefully.

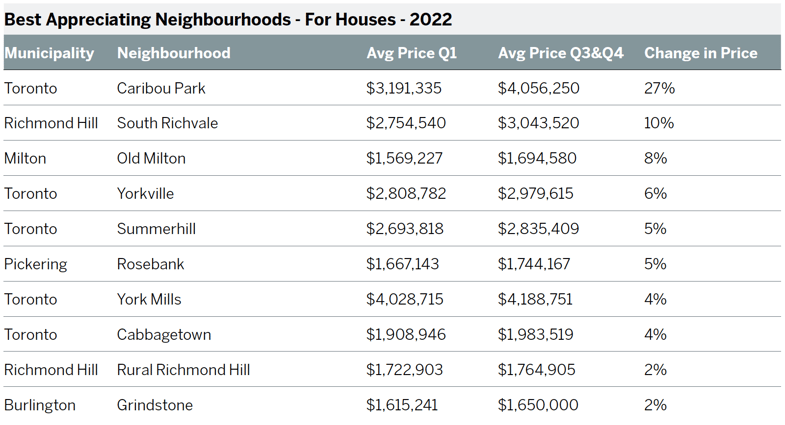
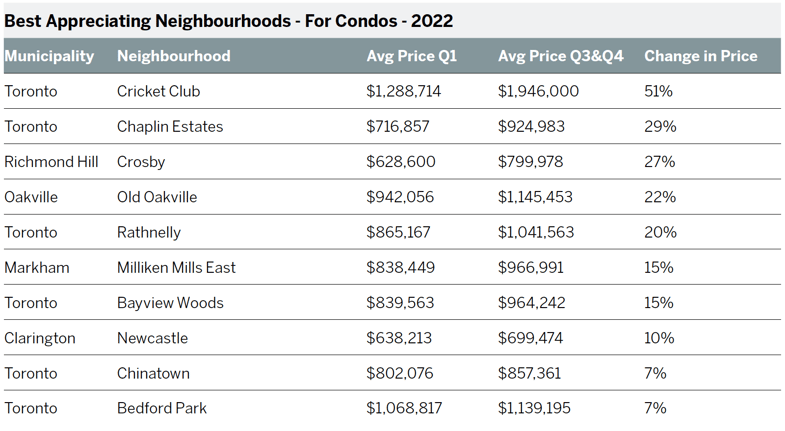
Similarly, the best appreciating lists for both houses and condos are a real mix of neighbourhood types throughout the GTA, including many that we often see on these types of lists, such as Caribou Park and Yorkville. Also, unlike the worst appreciating list, the best appreciating neighbourhoods for houses, except for one or two exceptions, saw very modest appreciation gains when compared to gains in neighbourhoods for condos.

Worst Appreciating Neighbourhoods - For Houses - 2022-1

Worst Appreciating Neighbourhoods - For Condos - 2022-1

Best Appreciating Neighbourhoods - For Houses - 2022-1

Best Appreciating Neighbourhoods - For Condos - 2022-1


House Statistics


House sales (low-rise freehold detached, semi-detached, townhouse, etc.) in the Greater Toronto Area (GTA) in December 2022 were down 46% over the same month last year and remain well below historical levels for the month. 


New house listings in December were down 25% over last year.


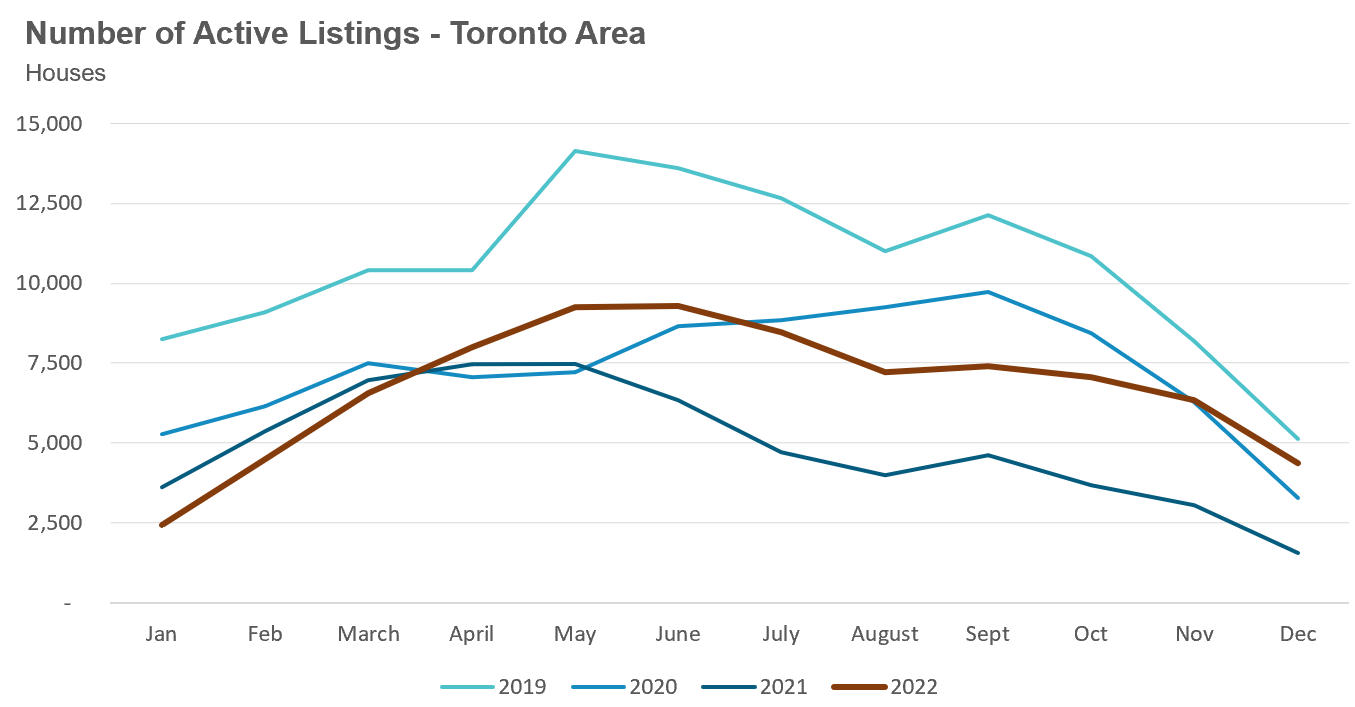
The number of houses available for sale (“active listings”) was up 179% when compared to the same month last year, but still well below pre-COVID levels for the month of December. It’s worth noting that the extremely low inventory levels in the second half of 2021 were due to a surge in demand as the market accelerated towards the peak in February 2022. 


The Months of Inventory ratio (MOI) looks at the number of homes available for sale in a given month divided by the number of homes that sold in that month. It answers the following question: If no more homes came on the market for sale, how long would it take for all the existing homes on the market to sell given the current level of demand?

The higher the MOI, the cooler the market is. A balanced market (a market where prices are neither rising nor falling) is one where MOI is between four to six months. The lower the MOI, the more rapidly we would expect prices to rise.  

While the current level of MOI gives us clues into how competitive the market is on-the-ground today, the direction it is moving in also gives us some clues into where the market may be heading. 

The MOI for houses remained relatively unchanged at 2.4 MOI in December.


The share of houses selling for more than the owner’s asking price dipped slightly to 27% in December.


The average price for a house in December was $1,307,513 in December 2022, well below the peak of $1,679,429 reached in February and down 12% when compared to the same month last year.


The median house price in December was $1,100,000, down 17% over last year, and below the peak of $1,485,000 reached in February.  

The median is calculated by ordering all the sale prices in a given month and then selecting the price that is in the midpoint of that list such that half of all home sales were above that price and half are below that price. Economists often prefer the median price over the average because it is less sensitive to big increases in the sale of high-end or low-end homes in a given month which can skew the average price.  

Condo Statistics


Condo (condominiums, including condo apartments, condo townhouses, etc.) sales in the Toronto area in December 2022 were down 52% over last year and well below pre-COVID sales volumes for the month of December. 


New condo listings were down 19% in December over last year and in line with historical listing volumes for the month of December.


The number of condos available for sale at the end of the month, or active listings, was up 140% over last year.


Condo inventory levels increased slightly to 3.3 MOI in December.


The share of condos selling for over the asking price decreased to 17% in December.


The average price for a condo in December was $721,885, down from the peak of $840,444 in March, and down 2% over last year. The median price for a condo in December was $645,000, down 2% over last year, and down from the March peak of $777,000.


Regional Trends


Houses 

Average prices were down over last year across all five regions with Peel and Durham seeing the biggest decline in prices. Sales were down significantly across all regions and inventory levels were well ahead of last year’s level.


Condos

Average condo prices were down over last year in Durham, Peel and Halton down, with Toronto and York seeing little change. Sales were down significantly across all regions and inventory levels were well ahead of last year’s level.


Browse Real-Time Market Trends on Movesmartly.com:


See Market Performance by Neighbourhood Map, All Toronto and the GTA

Greater Toronto Area Market Trends

City of Toronto Market Trends

York Region Market Trends

Halton Region Market Trends

Peel Region Market Trends

Durham Region Market Trends


Move Smartly Report - Jan 2023_Cover-1
Download a PDF version of this guide. 
Download Report

Buying or Selling a Home in the Toronto Area?

Get straight answers to your questions at Realosophy Realty's popular, personalized no-obligation consultation.

Learn more at Realosophy.com