Some markets in the Greater Toronto Area are showing signs of the type of slowdown that requires buyers and sellers to act carefully.
In Week 4 of our weekly look at the numbers during the current crisis, I'll be taking you through the latest real estate sales data for the week ending April 4th.
When analyzing real estate statistics weekly, we compare a given 7-day period this year (2020) against the same seven days the previous year (2019) to see how the market changed.
Click on the video below for this week's update.
Below the video, I've recapped some of the key takeaways in this blog post (but the video has more information on current on-the-ground realities for buyers and sellers so you should definitely watch it if you are actively in the market right now).
You can also access the same weekly video update on YouTube, Facebook and Instagram. And if you are into stats, check out my Twitter for more charts as part of my weekly update.
Send me your questions or comments on these weekly updates via the above social media channels or email me at askjohn@movesmartly.com
Greater Toronto Area (GTA) real estate sales in the last week of March were down 37% over last year and in the first week of April, they fell further, ending up down 58% over last year.
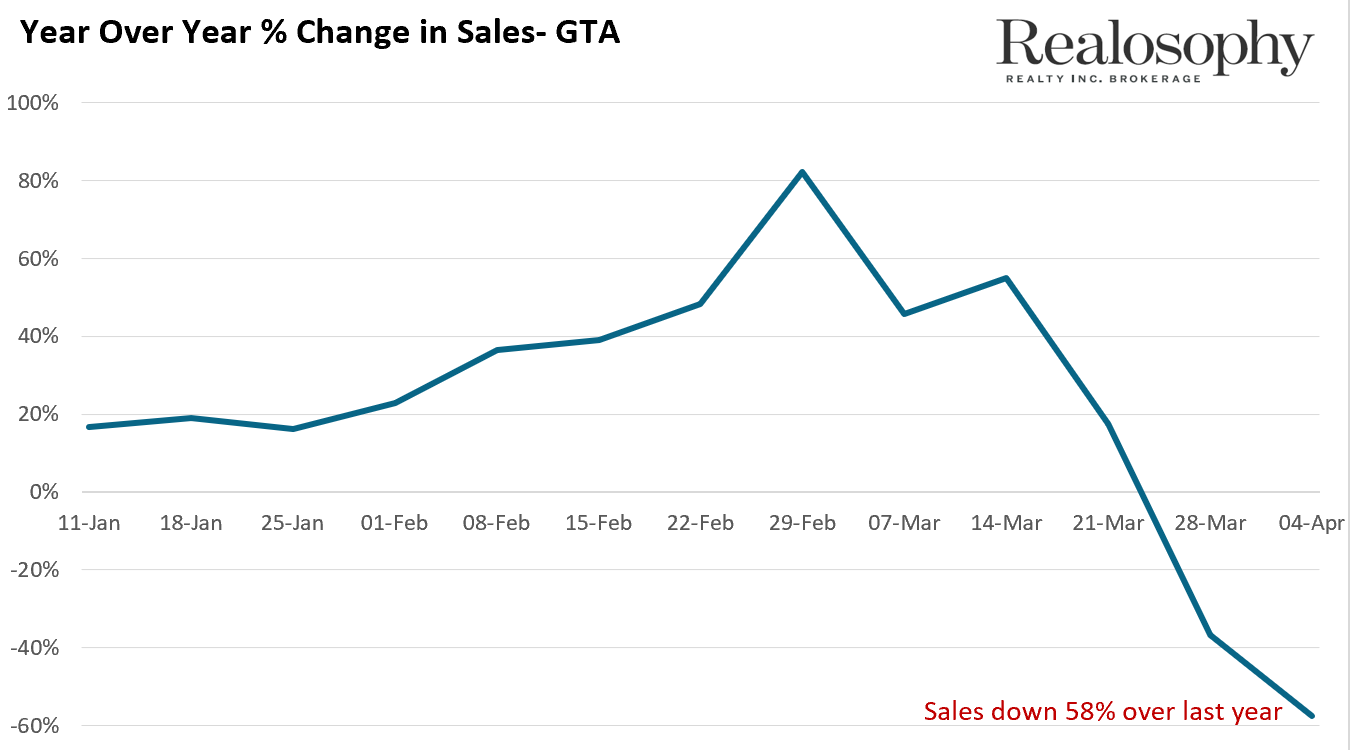
This is a big number which shows us that a significant number of buyers are hitting pause on their home search because of the current public health advice to stay at home. A lower number of buyers means fewer sales of homes are happening.
So how are house prices holding up?
Average GTA home prices are the same compared to last year, but are down roughly 10% from the average price we saw a month ago, in late February this year.
This month-to-month price decline may be due to the types of homes that are now selling rather than a decline in the prices homes are fetching on the market; as mentioned in last week's post, a closer look at the data reveals that there are more lower-priced homes (and fewer luxury properties) selling today than a month ago, which is pulling down the average home price.
When we see the other type of price drop happening - a drop in value of homes across the board of say 10% - we are seeing people selling their homes for less than what their home is currently worth (as determined by what comparable homes have sold for recently in the area). When this starts to happen, we normally see a handful of people selling for below market value, who are then joined by more and more sellers, eventually establishing a new average price for an area.
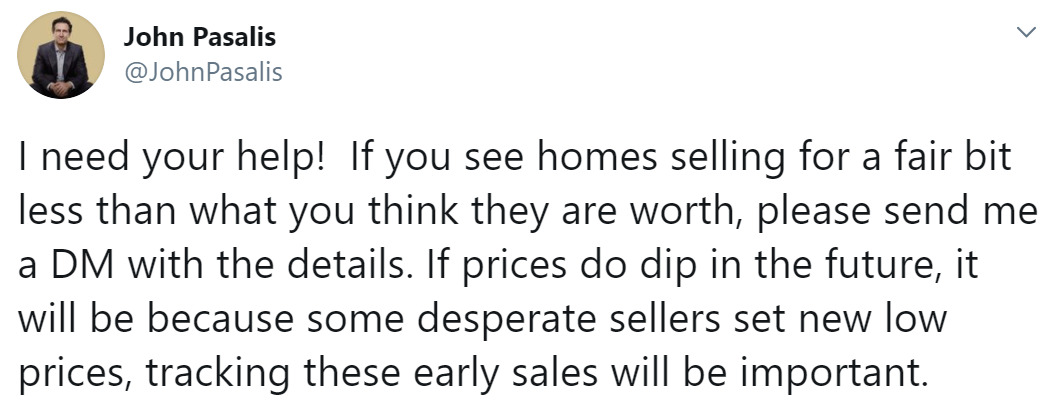
Because it's hard to see these first signs of sellers selling below market value in the numbers, I asked my followers on Twitter to send me examples of homes they think sold below market value. Of the 12 examples I received and checked out, only 1 appears to have sold for below market value.
So given the unprecedented nature of the crisis we are experiencing, including a near total shutdown of the economy, why are we not seeing more downward pressure on home prices?
For now, the main reason is because we are not seeing a surge in supply (i.e., new homes for sale coming onto the market). (This was different from the situation during the 2008 financial crisis which I wrote about two weeks ago.)
New listings in the GTA were down 58% over last year showing us that both buyers and sellers are hitting pause on their real estate transactions, which make sense given the nature of the public health crisis we are in.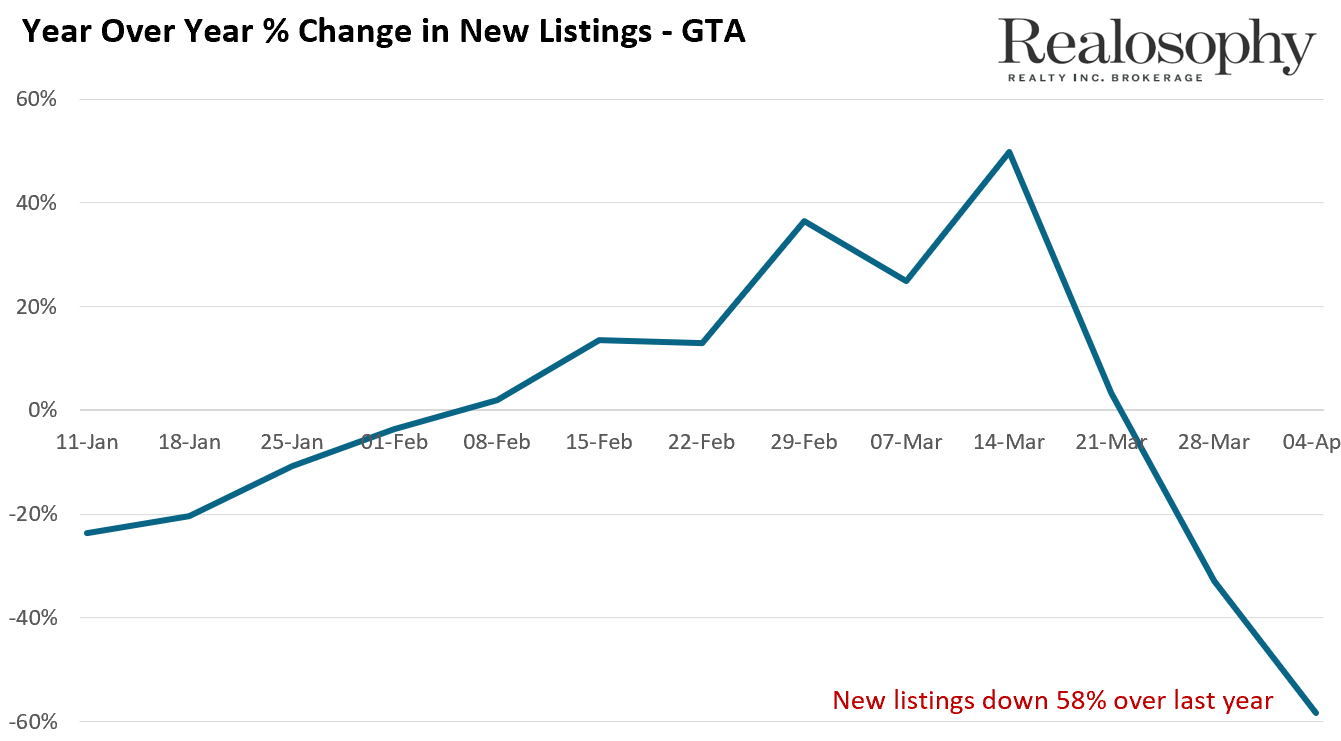
This has tightened up the supply of homes and helped keep prices stable.
Now, can we tell which GTA area may begin to see a drop in prices first?
Yes, but to do this, we don’t look at changes in prices because price changes are a lagging indicator - which means they change after we see changes in other metrics.
One key metric we look at is the relationship between the number of homes for sale - the inventory - and the number of homes selling. In short, the balance between supply and demand.
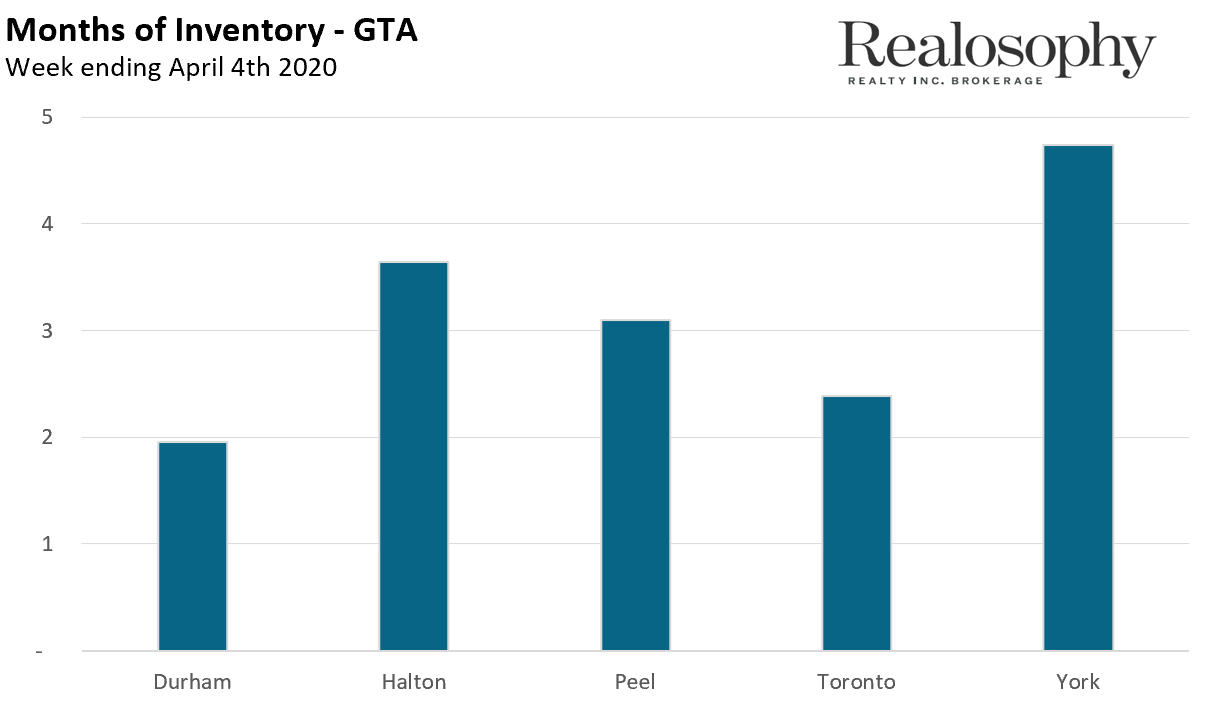
From the above chart, you can see that inventory levels are looking different across the GTA right now. Now, some of this difference is part of normal dynamics, as some areas always tend to have higher levels of inventory. However, as the weeks go by, we are going to want to keep a close eye on changes here.
To better understand this trend, let's take a closer look at Durham Region, which has the lowest inventory level right now and compare it to the one which the highest, York Region.
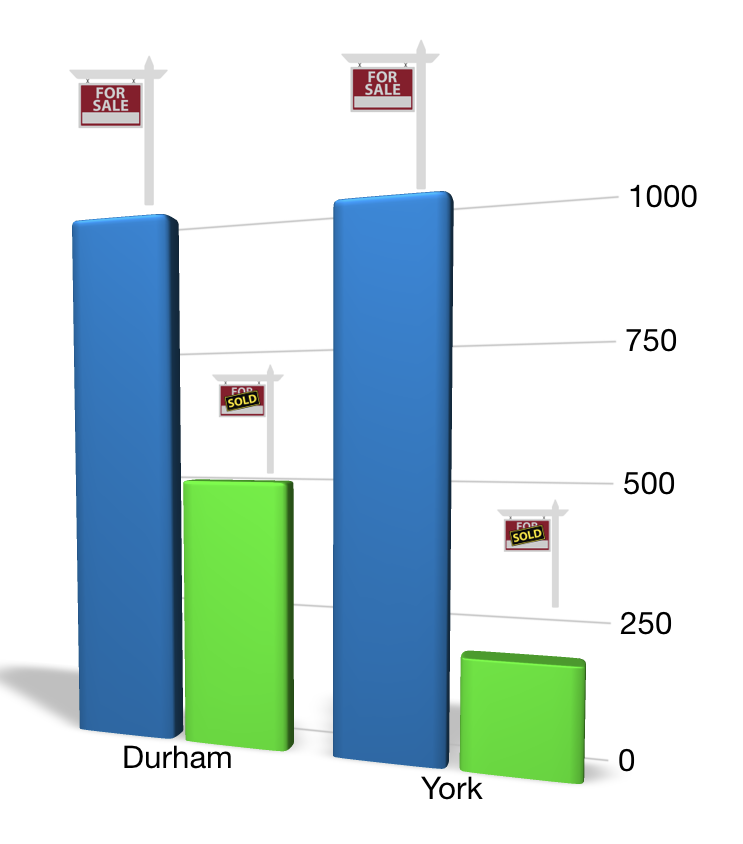
To understand how we get to these numbers, we are going to ask ourselves, for every 1,000 homes that are available for sale right now how many homes are selling in a given month?
In the case of Durham Region, for every 1,000 homes for sale roughly 500 are selling per month. So if no other homes came on the market for sale it would take roughly 2 months for all homes to be sold and we say that Durham has 2 months of inventory.
Now if we look at York Region, only 200 homes are selling for every 1,000 available for sale. If no more homes came on the market, it would take 5 months for all 1,000 homes to sell - which we refer to as 5 months of inventory.
In general, when you see a higher inventory, price declines tend to follow.
So what does this mean if you are a potential buyer or seller in these areas?
Well if you’re a seller in York Region, it’s going to take you longer to sell a home. And if you need to sell your home, and you get a decent offer for your house, it’s going to be a lot riskier to reject that offer in order to hold out for the same money your neighbours were getting earlier this year because the market is cooling down more rapidly in your area - the next offer you see may be even lower. You want to proceed carefully though, as you do not want to panic, but be realistic about your prospects.
All buyers should exercise a bit more caution right now - for you, the risk is that you may find yourself overpaying for a home from one week to the next. In particular, you need to know where inventory levels are rising quickly - so you should be looking at comparable sales from the past week or two, not just from a month ago (which is the more common practice). However, here again, you need to be doing this in a careful way, so that you are not precluding the chance that there may be a real opportunity for you to act to your advantage.
John Pasalis is President of Realosophy Realty, a Toronto real estate brokerage which uses data analysis to advise residential real estate buyers, sellers and investors.
A specialist in real estate data analysis, John’s research focuses on unlocking micro trends in the Greater Toronto Area real estate market. His research has been utilized by the Bank of Canada, the Canadian Mortgage and Housing Corporation (CMHC) and the International Monetary Fund (IMF).
Follow John on Twitter @johnpasalis
Published: April 07, 2020