
Colder weather has had no effect on Toronto’s red hot housing market which continued to show signs of heating up last month.
As Featured in the Move Smartly Report:
FREE PUBLIC WEBINAR: The Market Now with John Pasalis
Join John Pasalis, report author, leading market analyst and Move Smartly contributor, and President of Realosophy Realty, in a free monthly webinar as he discusses key highlights from this report, with added timely observations about new emerging issues, and answers your questions. A must see for well-informed Toronto area real estate consumers.
The Market Now
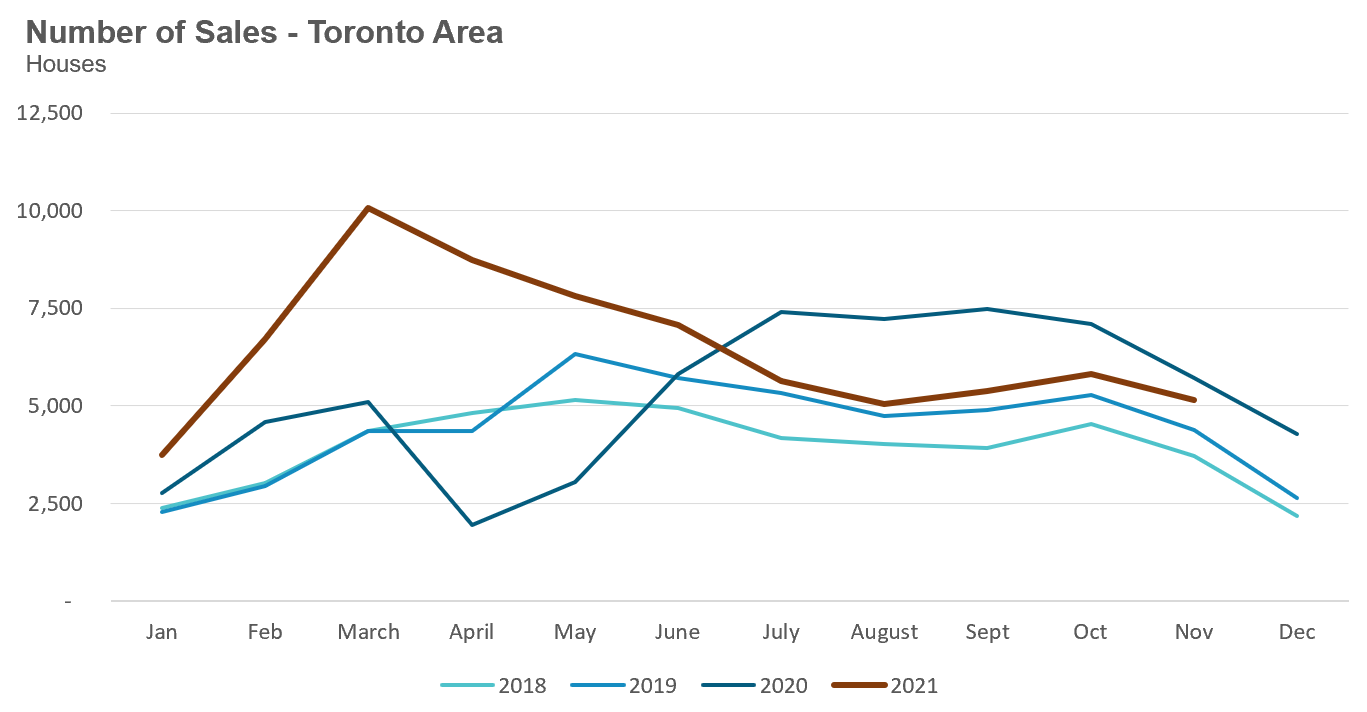
House sales were down 10% on a year-over-year basis in November, but well above pre-Covid 19 pandemic levels for November in 2018 and 2019.
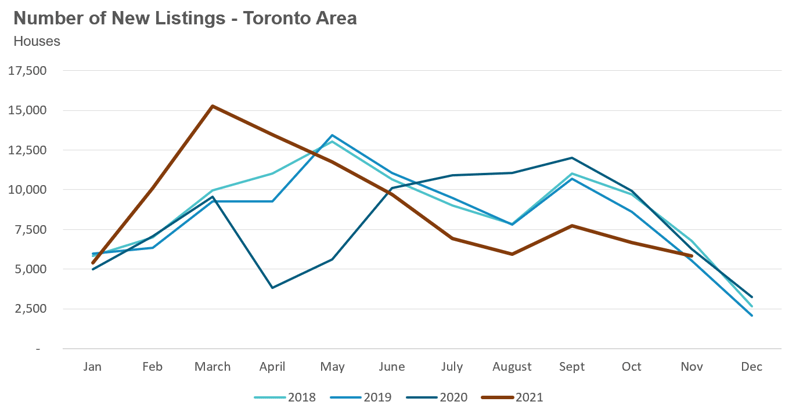
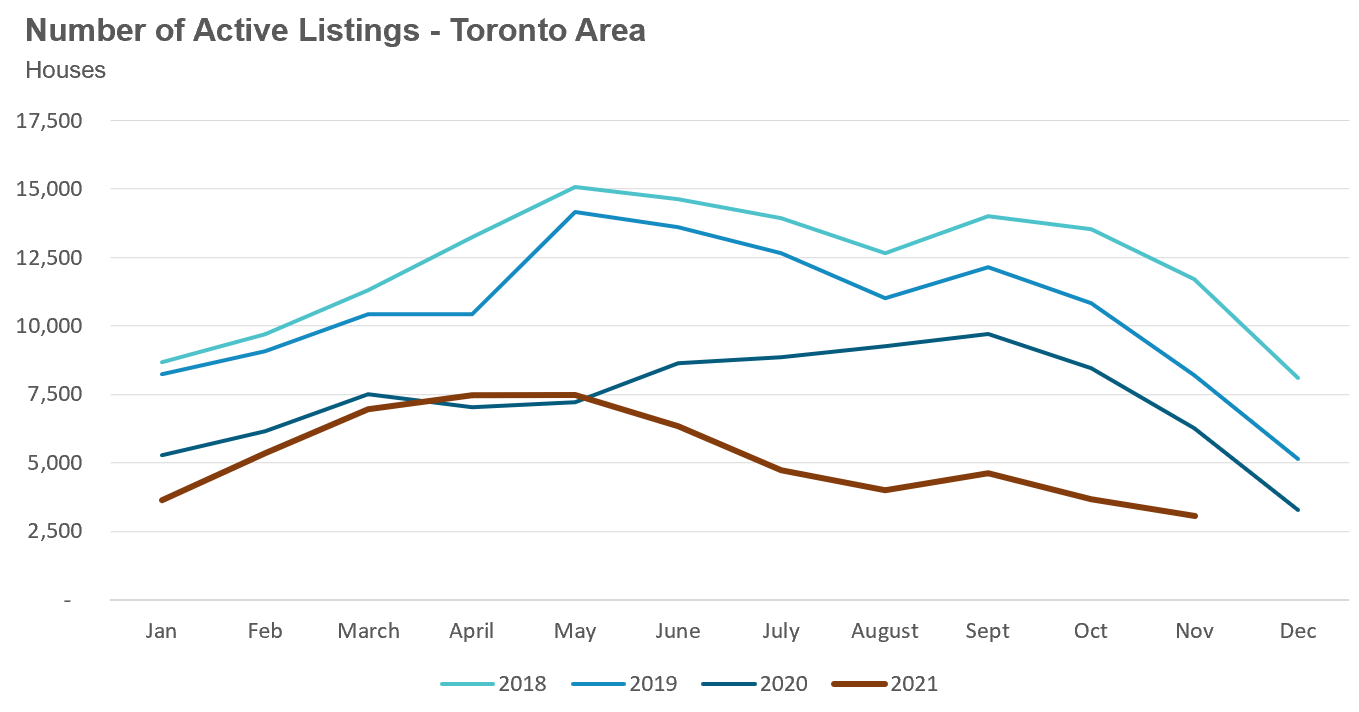
New listings in November were down 7% over last year while the number of active houses for sale at the end of November fell to just 3,060, a 51% decline over last year.
Why are there so few houses available for sale this year compared to last year?
The number of new listings so far this year is actually up 8% over the same period last year. But when we look at the number of sales, they are up 22%. This dearth of houses for sale is due to a surge in demand which has outpaced the growth in new listings.
The average price for a house in November was $1,477,133, up 31% over last year; the median house price in November was $1,300,000, up 35% over last year.
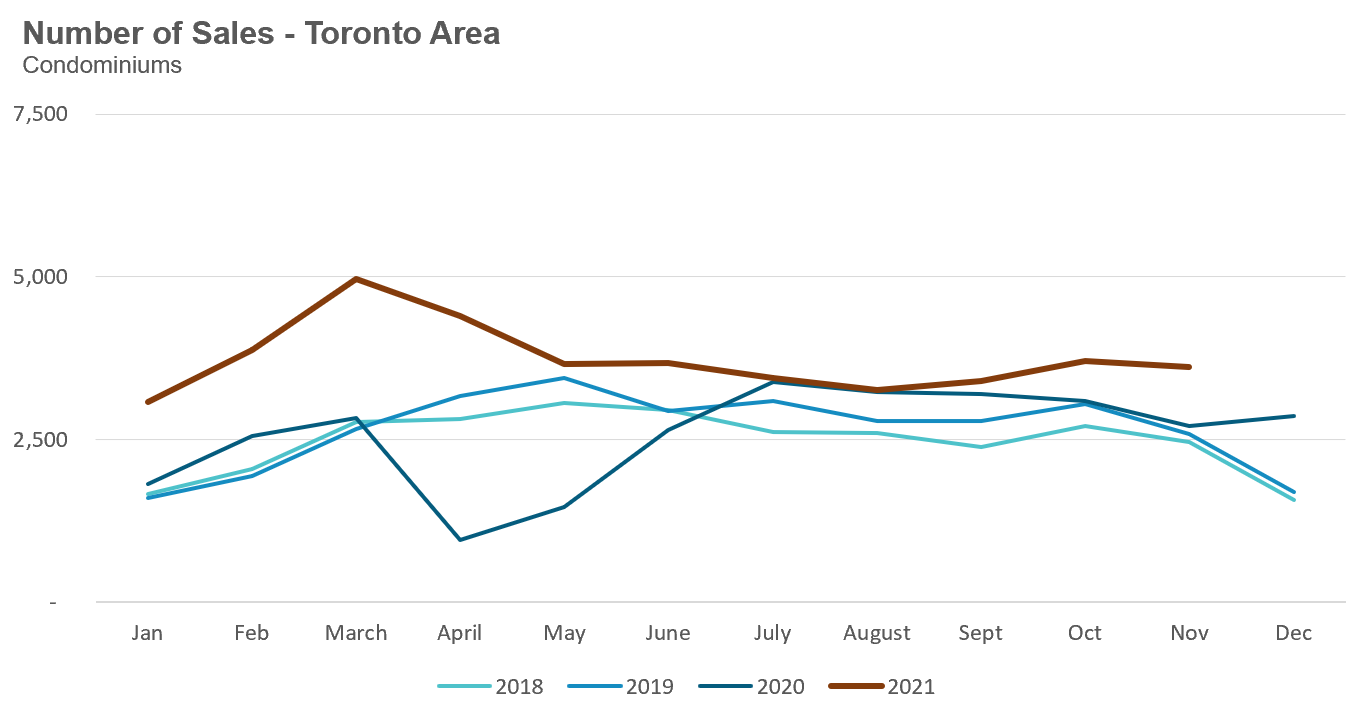
Condominium (condo) sales were up 33% in November over last year and well above the pre-Covid 19 levels for the same month in 2018 and 2019.
New condo listings were down by 20% in November over last year, but above the volumes in 2018 and 2019. The number of condos available for sale at the end of the month, or active listings, was down 60% over last year.
The average price for a condo in November reached $738,695, up 19% over last year; the median price for a condo in November was $665,000, up 17% over last year.
(For all monthly statistics for the Toronto Area, including house, condo and regional breakdowns, see the final section of this report.)
Monthly Statistics
House Statistics
House sales (detached, semi-detached, townhouse, etc.) in the Toronto area in November 2021 were down 10% over the same month last year.
Sales will likely continue to be negative on a year-over-year basis until at least the first quarter of 2022 since we’ll be comparing against a period that saw a sudden shock in demand for houses following the initial Covid-19 lockdowns.
But it’s worth noting that sales in November were above levels for the same month in pre-Covid 2018 and 2019.
New listings in November were down 7% over last year. But unlike sales volumes which were strong compared to pre-Covid levels, new listings in November were well below the listings volumes seen in 2018 and 2019.
The number of houses available for sale (“active listings”) was down 51% when compared to the same month last year and 62% below the inventory levels seen in pre-Covid 2019.
Why are there so few houses available for sale this year compared to last year?
The number of new listings so far this year is actually up 8% over the same period last year. But when we look at the number of sales, they are up 22%. So the dearth of homes for sale is due to a surge in demand which has outpaced any growth in new listings.
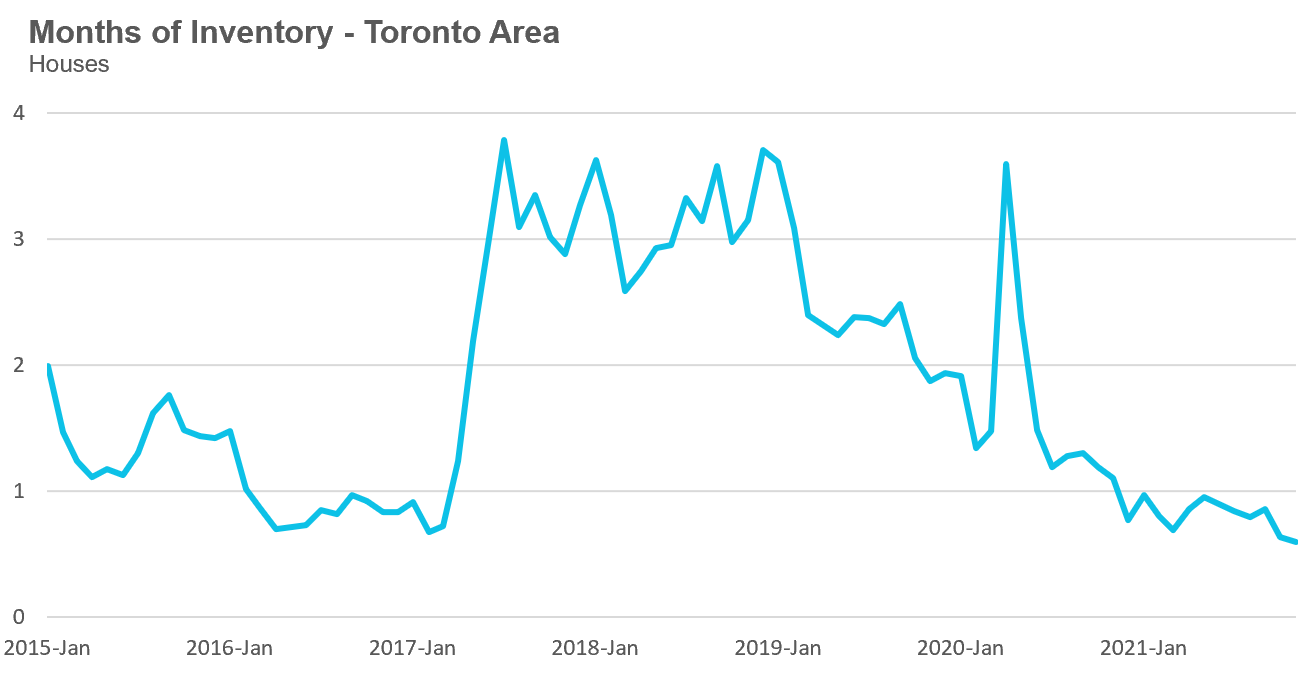
The Months of Inventory ratio (MOI) looks at the number of homes available for sale in a given month divided by the number of homes that sold in that month. It answers the following question: If no more homes came on the market for sale, how long would it take for all the existing homes on the market to sell given the current level of demand?
The higher the MOI, the cooler the market is. A balanced market (a market where prices are neither rising nor falling) is one where MOI is between four to six months. The lower the MOI, the more rapidly we would expect prices to rise.
This November, the market remained very competitive with the MOI at 0.6 months for the second month in a row.
While the current level of MOI gives us clues into how competitive the market is on-the-ground today, the direction it is moving in also gives us some clues into where the market may be heading. The MOI has remained relatively stable at or below a very competitive 1 MOI for the past twelve months.
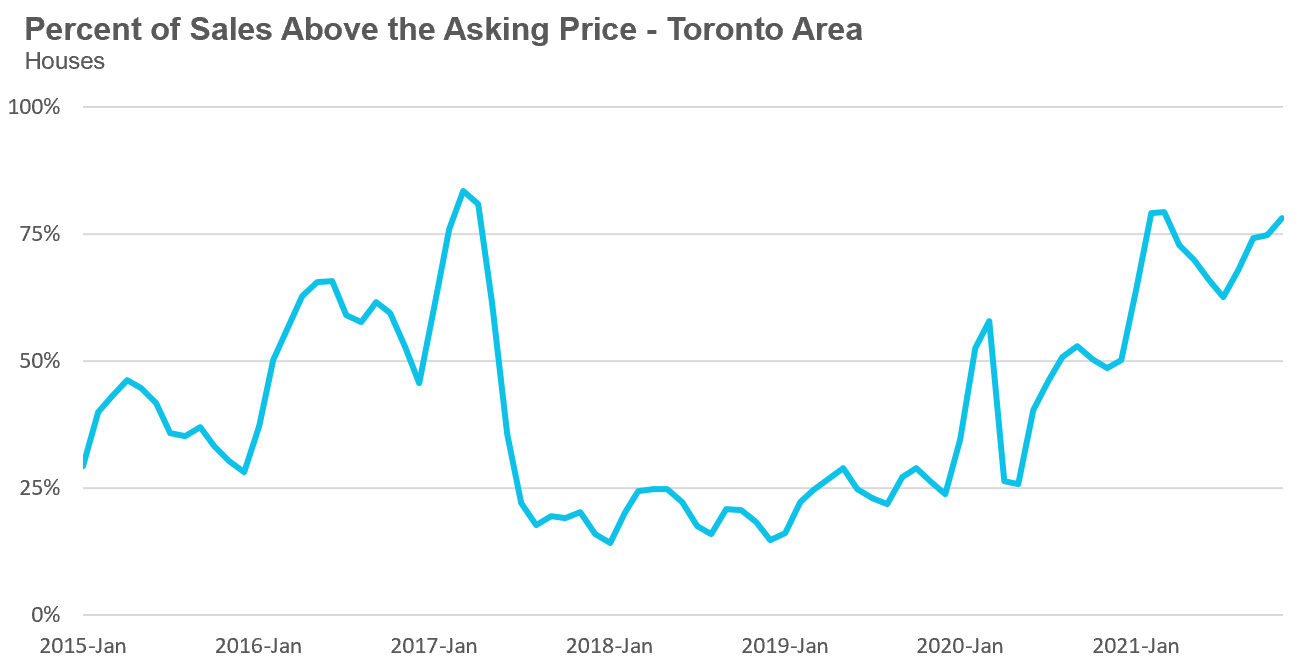
The share of houses selling for more than the owner’s asking price climbed from 68% in August to 78% in November.
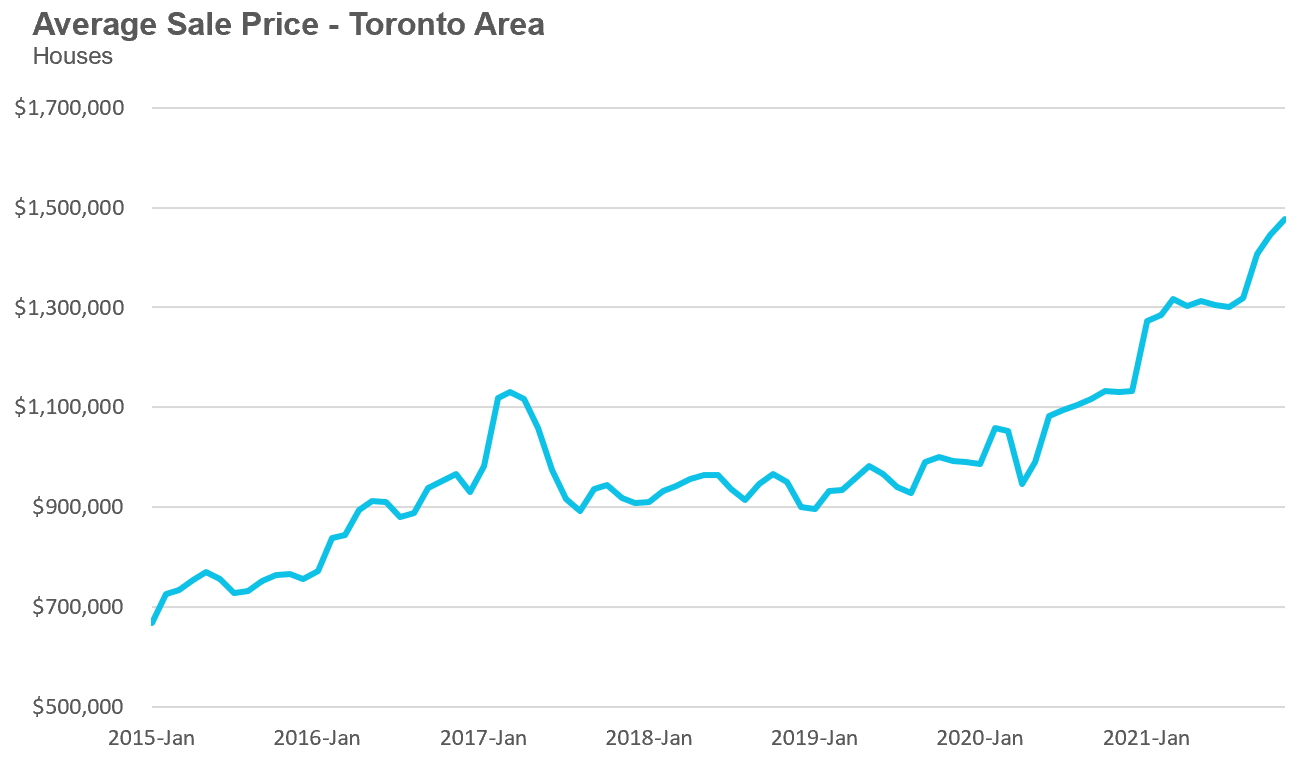
Average house prices had plateaued in 2021, remaining relatively constant in the $1.3M range since the start of the year, but that trend ended this September when average prices surged above $1.4M and average prices continued to climb in November to $1,477,133, up 31% over last year.
The median house price in November was $1,300,000, up 35% over last year.
Condo Statistics
Condo (condominiums, including condo apartments, condo townhouses, etc.) sales in the Toronto area in November were up by 33% over last year and up 40% compared to pre-Covid 2019.
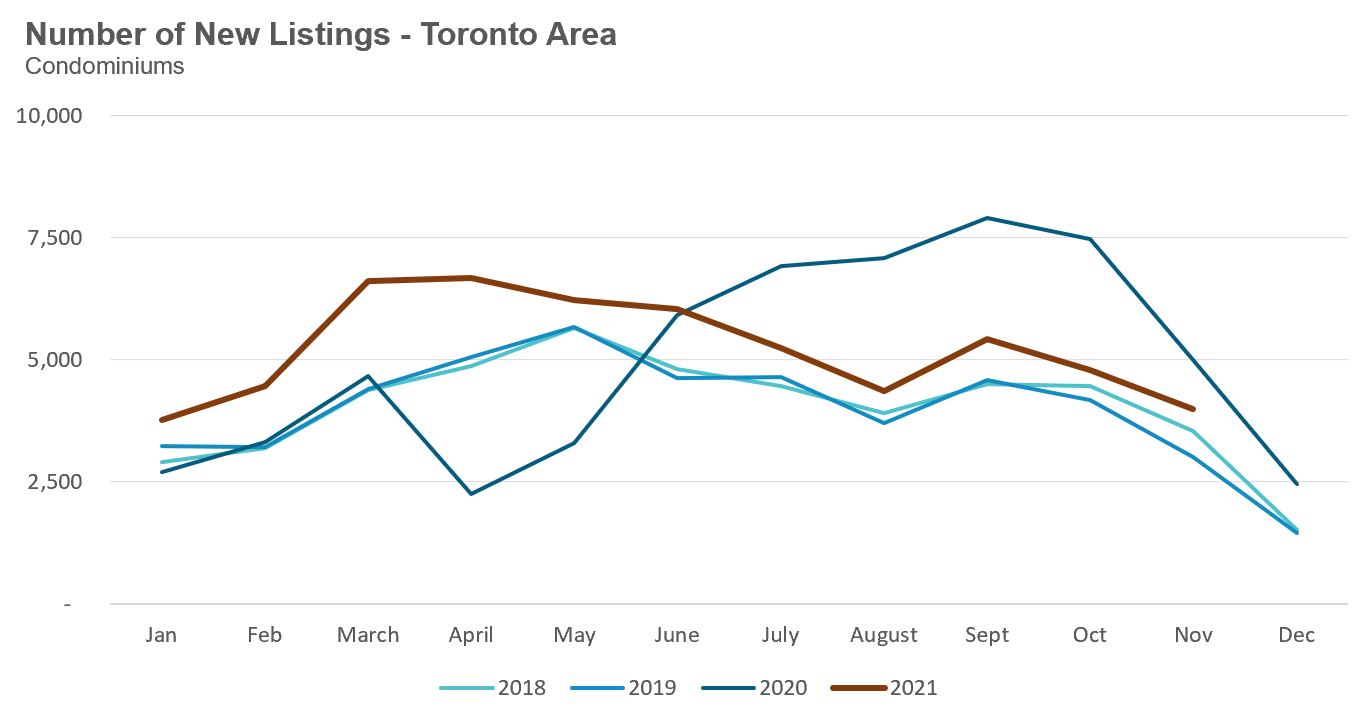
New condo listings were down by 20% in November 2021 over last year, but well above the volumes in 2018 and 2019.
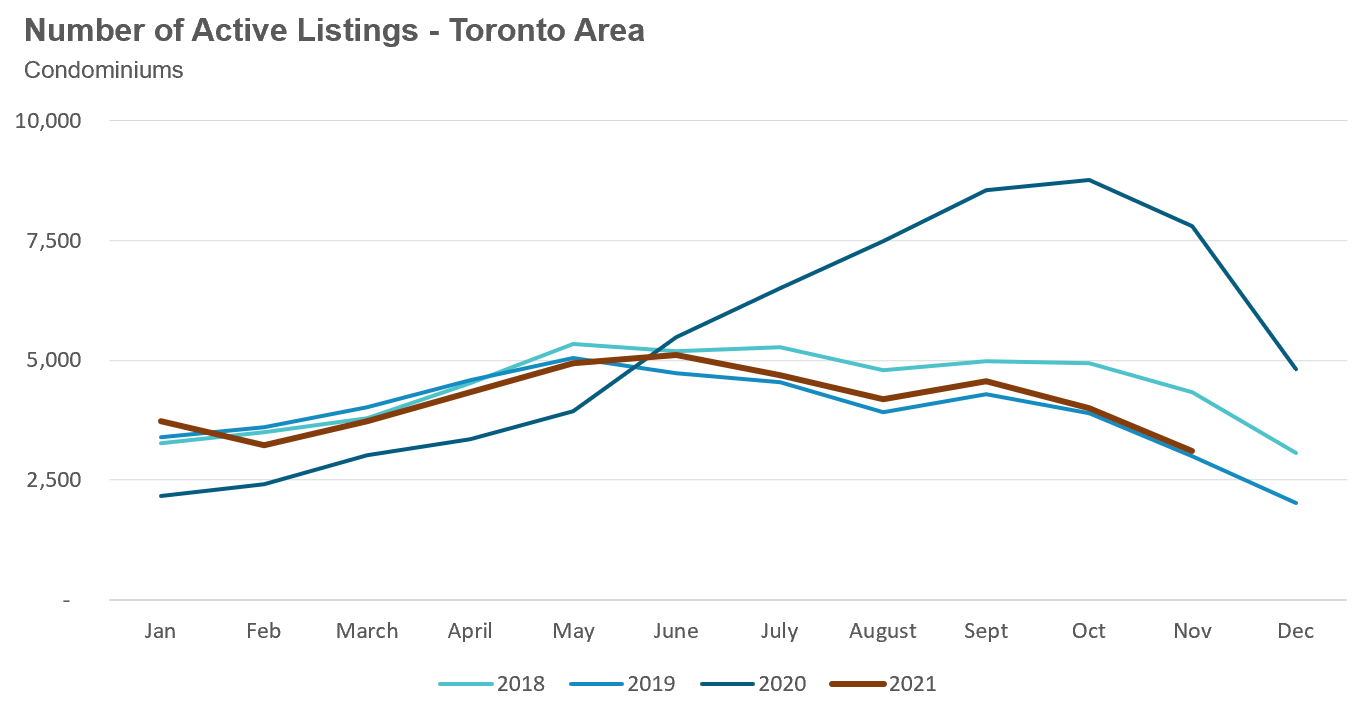
The number of condos available for sale at the end of the month, or active listings, was down 60% over last year, a period that saw a surge in condo listings due to declining prices, falling rents and rising vacancy rates.
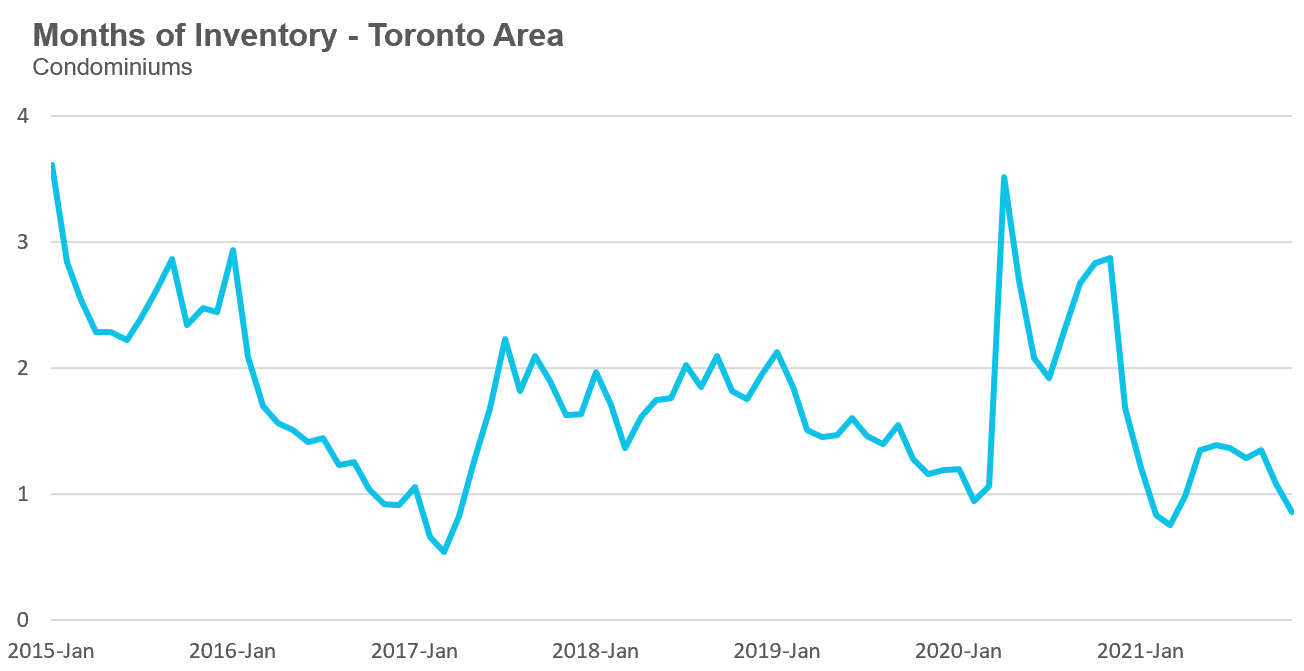
The strong demand helped push the MOI down to just under 1 MOI for the month of November.
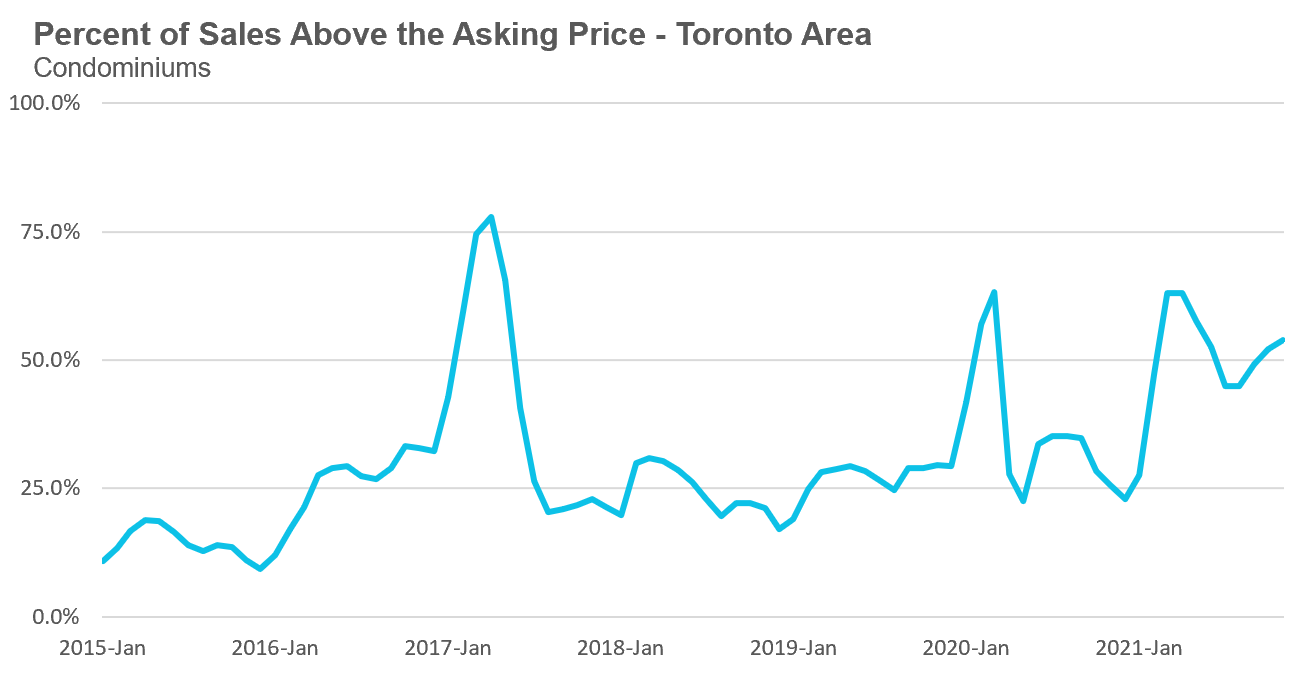
The competition for condos picked up very slightly with the share of condos selling for over the asking price rising from 45% in August to 54% in November.
Average condo prices plateaued at approximately $700K for most of 2021, but increases have started to resume over the past two months. The average price for a condo in November reached $738,695, up 19% over last year. The median price for a condo in November was $665,000 up 17% over last year.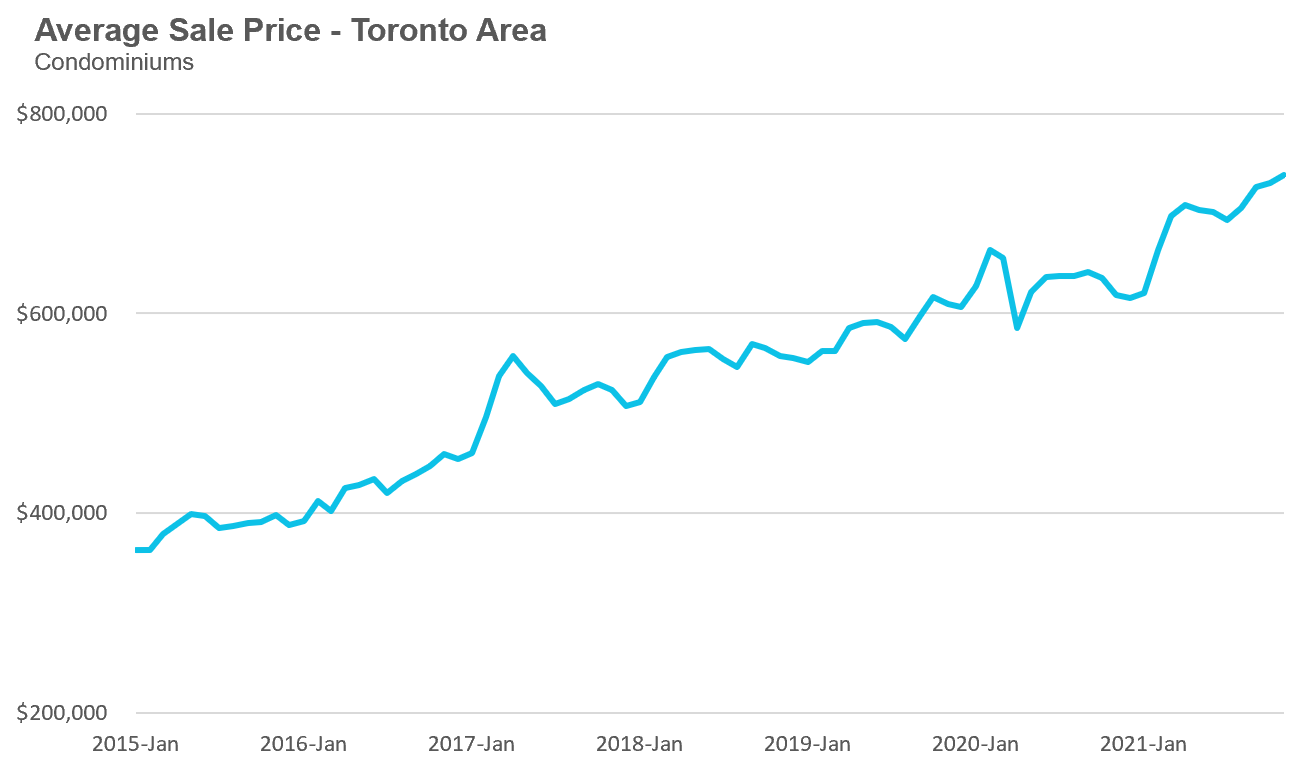
Regional Trends
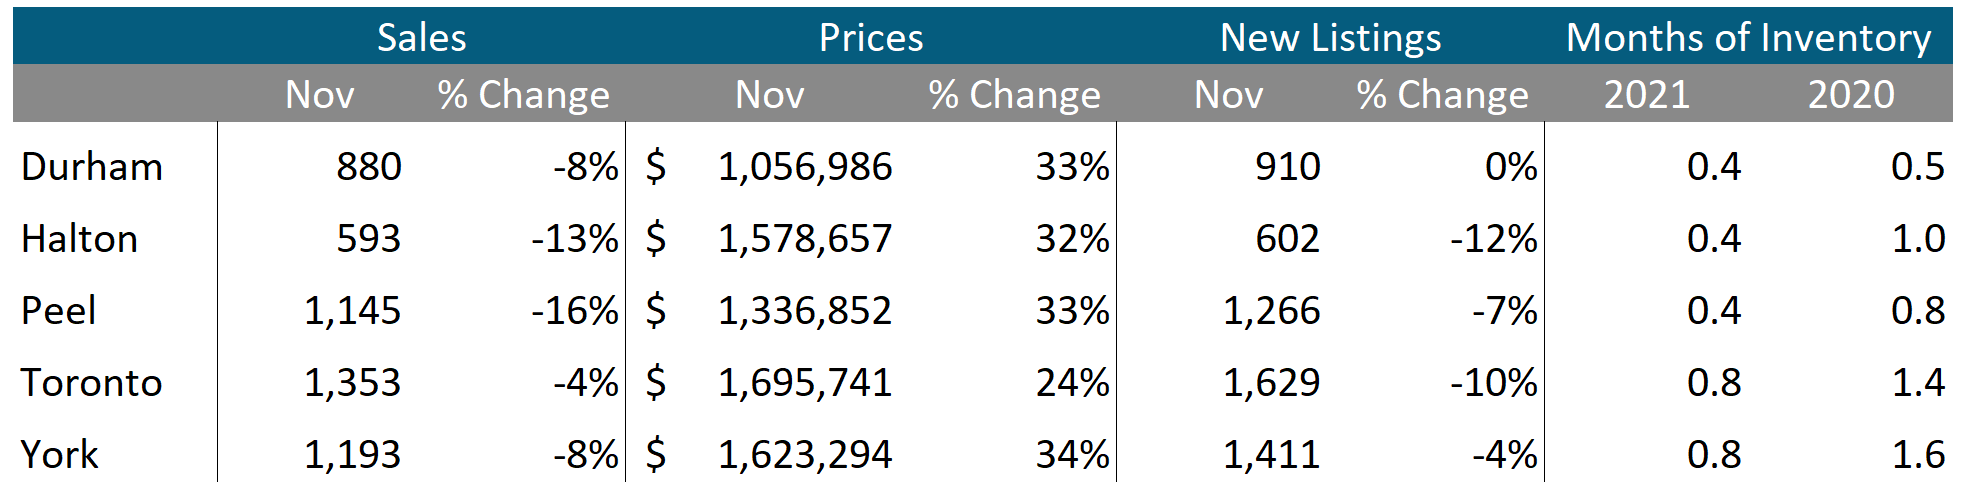
Houses
Sales across all five regions in the GTA were down in November while average prices were up on a year-over-year basis. The decline in new listings helped keep the market competitive with MOI below 1 across the entire GTA, indicating a strong seller’s market.
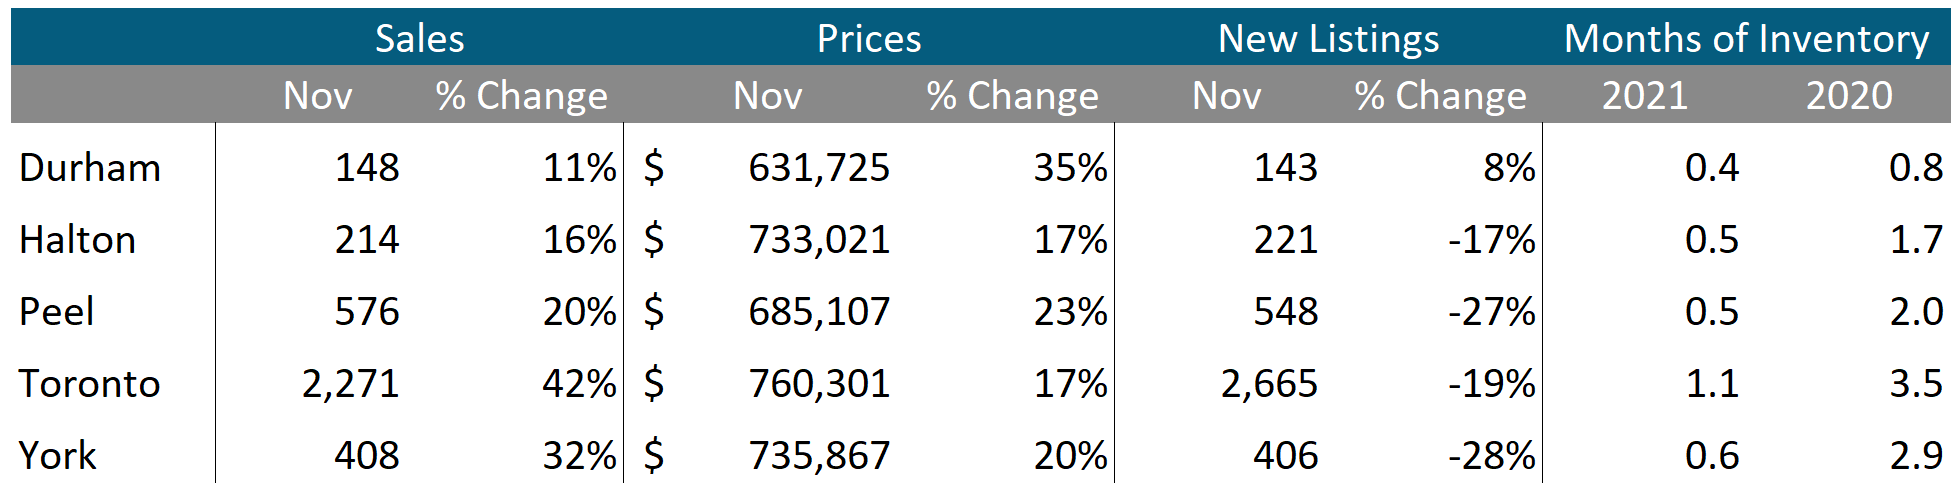
Condos
Condo sales were up across the GTA in November. Average prices were up double digits in all five regions. Current MOI levels are below 1 in the suburbs and just 1.1 in the City of Toronto signalling a strong seller’s market.
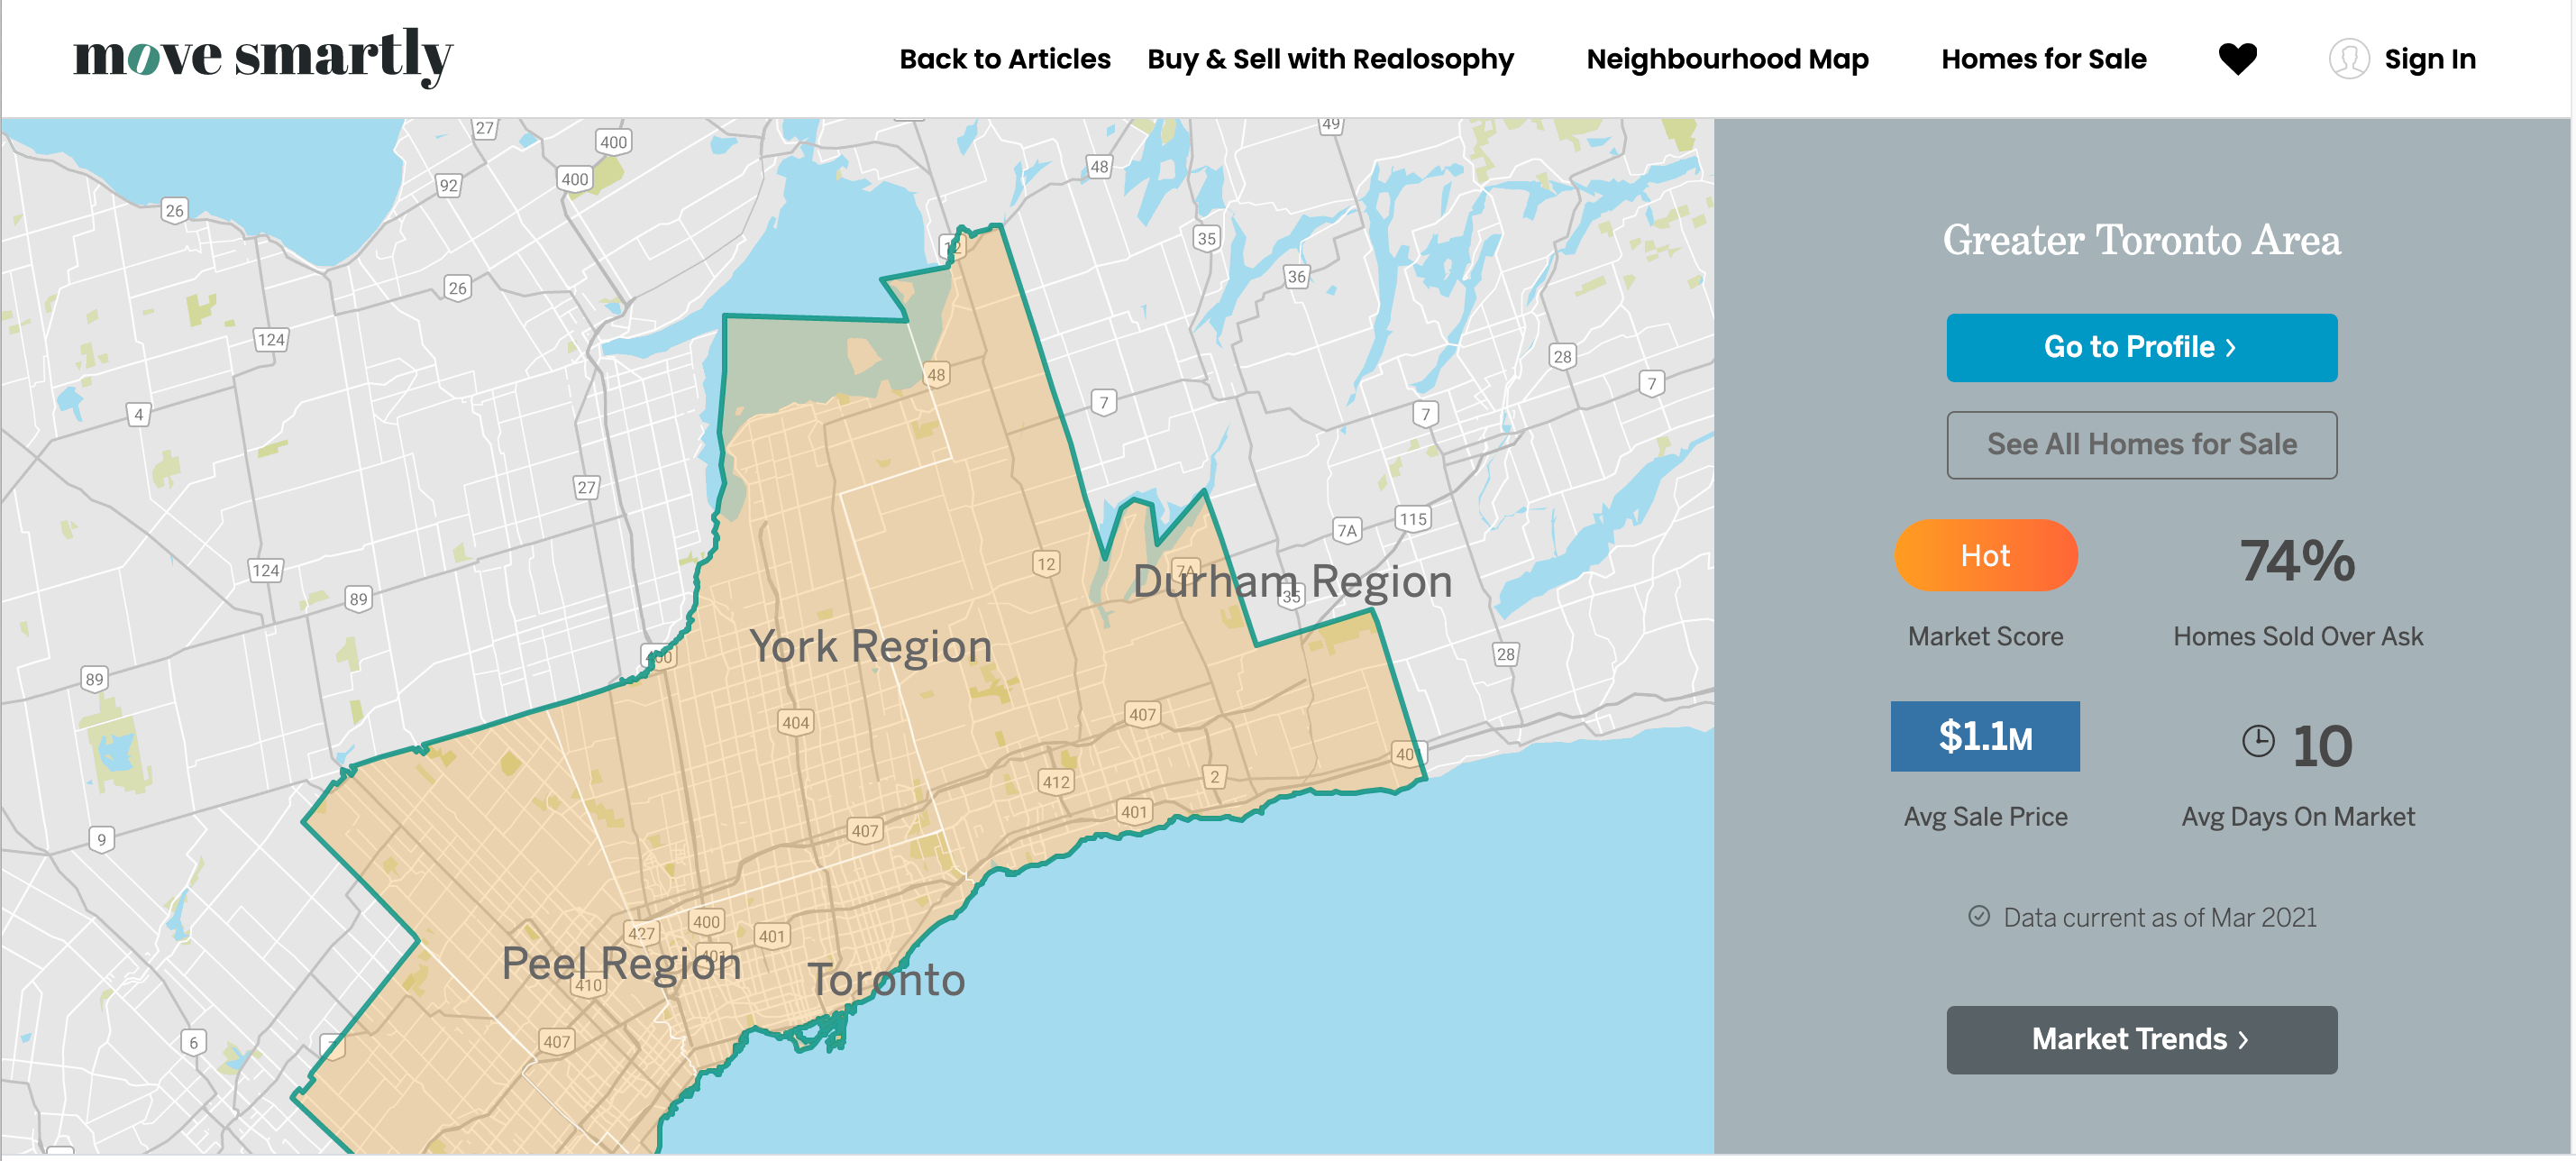
Browse All Real-Time Regional Market Trends on Movesmartly.com
Greater Toronto Area Market Trends
All Market Performance by Neighbourhood Map, Toronto and the GTA
Top Image Credit: Getty/iStock
The Move Smartly monthly report is powered Realosophy Realty Inc. Brokerage, an innovative residential real estate brokerage in Toronto. A leader in real estate analytics, Realosophy educates consumers at Realosophy.com and MoveSmartly.com and helps clients make better decisions when buying and selling a home.
Published: December 14, 2021


