
Is Toronto’s housing market turning another corner after being sluggish over the past few months?
It’s still too early to say, and while home sales in the Toronto area remain at historic lows and inventory is up over last year, some key numbers are moving in the opposite direction than many, myself included, were expecting.
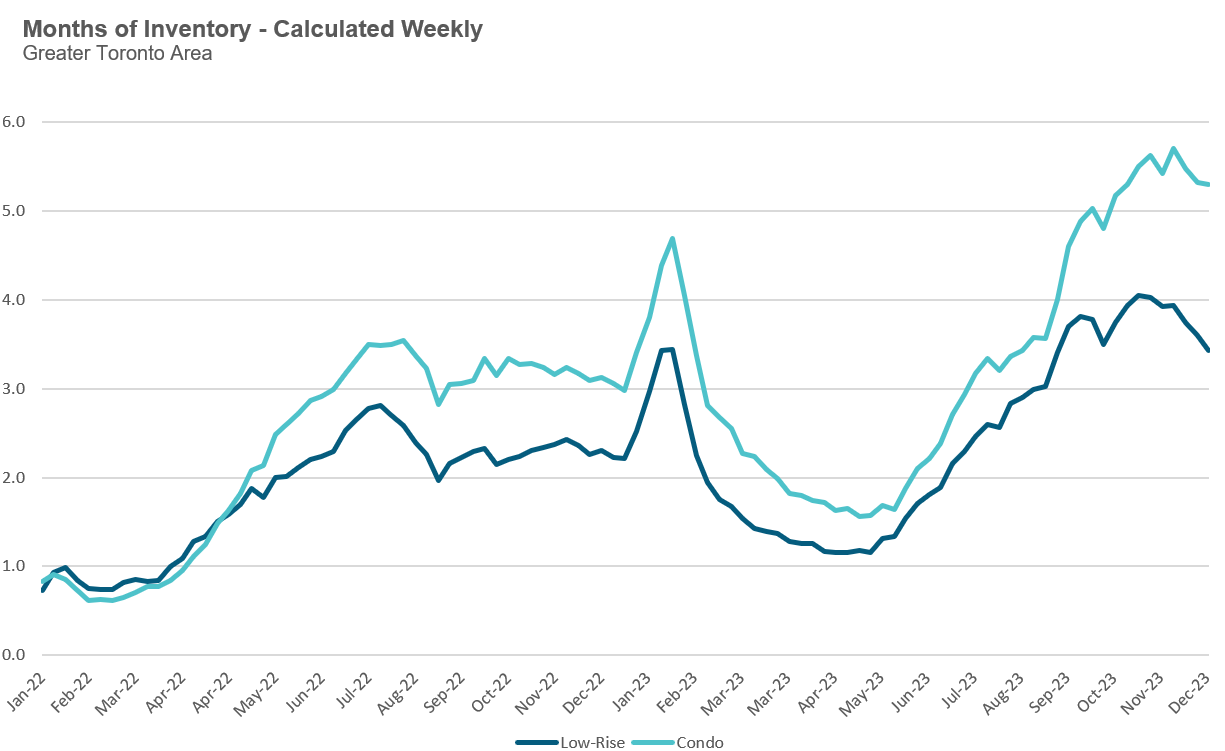
To get a sense of which way the market is heading, or its momentum, we need to look at the relationship between sales and inventory levels, referred to as the months of inventory (MOI). The MOI is the number of homes available for sale divided by the number sold over the previous month (for a more detailed explanation of this measure, see the final section of my monthly report).
When the MOI is trending up, it means that the number of listings coming on the market for sale is outpacing the demand from sales, causing inventory levels to increase in a slowing market. On the flip side, when the MOI starts trending down, it typically means that sales are outpacing the volume of new listings, causing the MOI to decrease gradually.
Looking at weekly MOI data, we can see that MOI levels have been trending down, particularly for houses, since peaking five weeks ago.
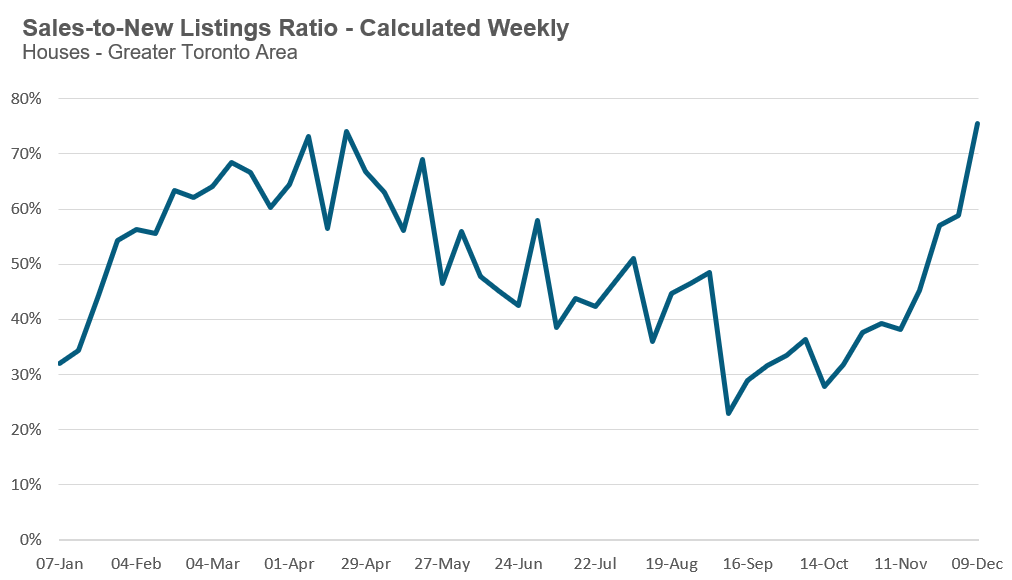
This gradual decline in the MOI is largely due to the fact that the number of sales each week relative to the number of new listings, also referred to as the sales-to-new listings (SNL) ratio, has been trending up.
This does not mean that the housing market is suddenly hot again. It just means that over the past five weeks, in response to very soft home buying demand, the volume of new listings coming on the market has cooled relative to sales, pushing the SNL ratio up. In the case of houses, the SNL ratio reached its highest level this year.
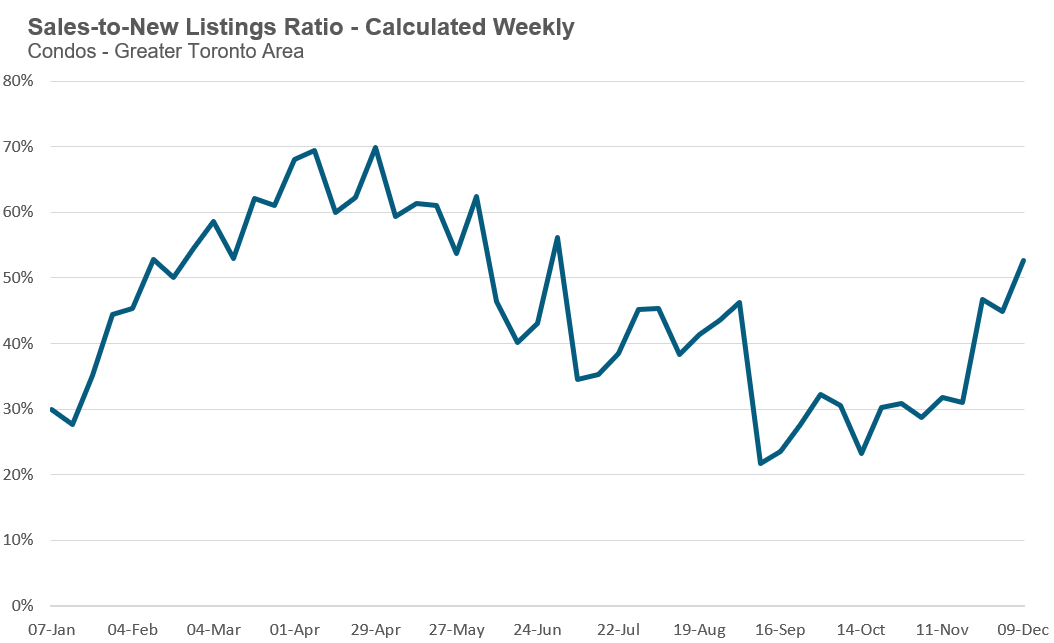
The condo market is seeing a similar trend, although the increase in the SNL ratio over the past five weeks is not as pronounced.
T
he other factor contributing to the decline in the MOI is the number of owners taking their homes off the market which has increased by roughly 56% over the same month last year. It’s worth noting that this increase is in line with the increase in active listings, which means the number of cancelled listings is roughly consistent with last year’s trend.
We do need to be cautious in interpreting these results, given that these trends only reflect five weeks of data. But as I noted above, this is not the direction we would have expected the market to go in as we move towards the holiday season. These numbers suggest that many sellers are deciding to pause and wait for what they hope will be a much busier 2024 housing market.
We’ll see if their hunch is right.

WATCH LIVE: The Market Now with John Pasalis - Thurs December 14th 2023 12PM ET
Join John Pasalis, report author, for key highlights of this month's report and responses to your questions. Sign Up Now >
By the Numbers: November 2023
Houses
Year-over-year, the average price for a house in the Toronto area was $1,309,650 in November, down 1% over the same month last year. Last month's median house price was $1,140,000, also down 1% over last year.
House sales in November were unchanged over last year while new house listings were up 22%.
The number of houses available for sale at the end of the month, or active listings, was up 61% over last year.
The current balance between supply and demand is reflected in the MOI, which is a measure of inventory relative to the number of sales each month.
In November, the MOI for houses fell slightly to 3.7.
The average price for a condo in the Toronto Area was $731,734 in November, which is unchanged over last year. The median price for a condo in November was $650,000, also unchanged over last year.
Condo sales in November were down 7% over last year, and new condo listings were up 26% over last year. The number of active condo listings was up 58% over last year. The MOI decreased slightly to 5.4.
For detailed monthly statistics for November 2023 for the entire Toronto area market, including house, condo and regional breakdowns, see the final section of this report.
For detailed monthly statistics for November 2023 for the entire Toronto area market, including house, condo and regional breakdowns, see the full Move Smartly monthly report for Dec 2023.
Browse Real-Time Market Trends on Movesmartly.com:
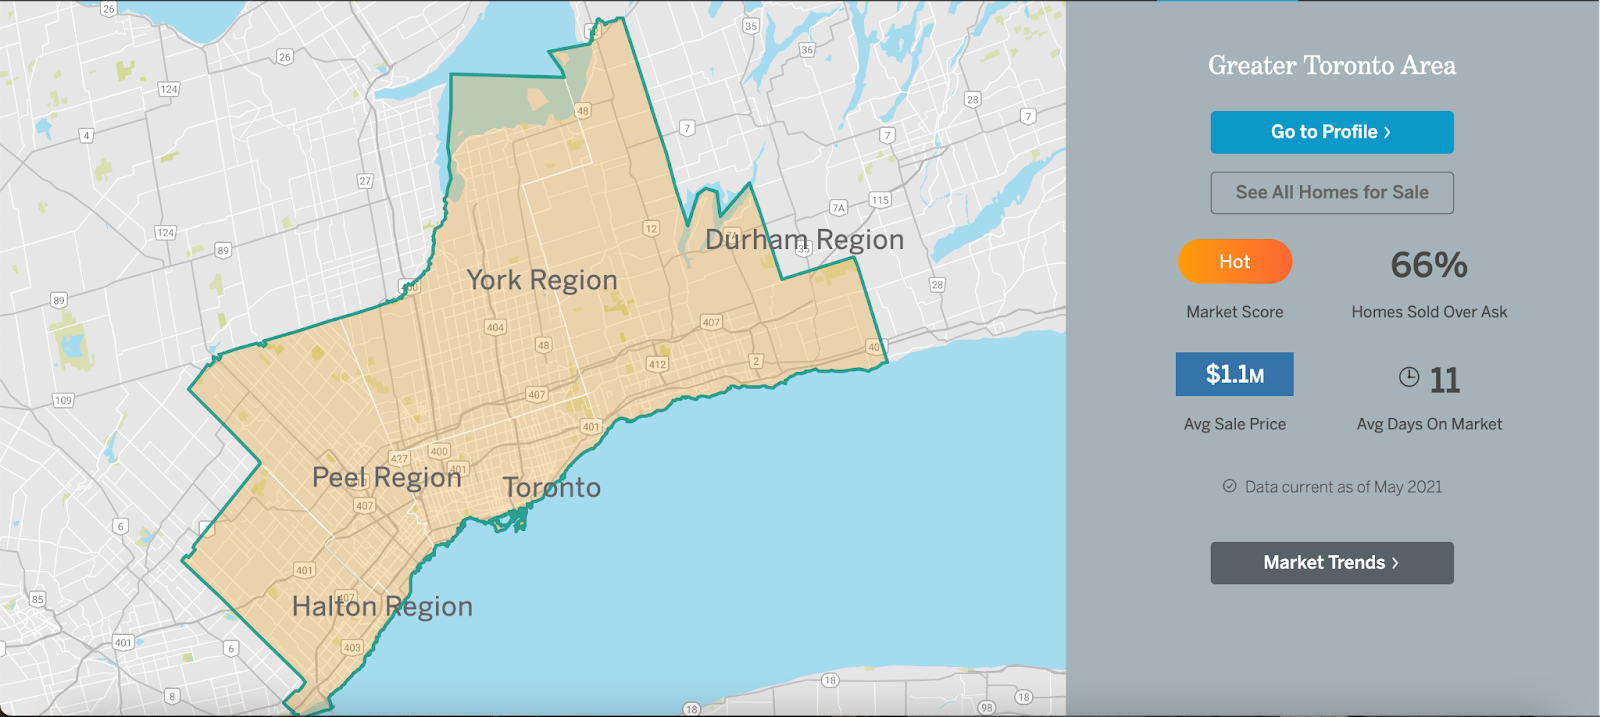
See Market Performance by Neighbourhood Map, All Toronto and the GTA
Greater Toronto Area Market Trends
Top Image Credit: Getty/iStock
The Move Smartly monthly report is powered by Realosophy Realty, an innovative residential real estate brokerage in Toronto. A leader in real estate analytics, Realosophy educates consumers at Realosophy.com and MoveSmartly.com and helps clients make better decisions when buying and selling a home.
John Pasalis is President of Realosophy Realty. A specialist in real estate data analysis, John’s research focuses on unlocking micro trends in the Greater Toronto Area real estate market. His research has been utilized by the Bank of Canada, the Canadian Mortgage and Housing Corporation (CMHC) and the International Monetary Fund (IMF).
Published: December 13, 2023


