September market numbers are out - and I review how they stack up against on the ground realities now.
As Featured in the monthly Move Smartly Report
FREE MONTHLY WEBINAR: The Market Now with John Pasalis - Next Session Wed Oct 19th 12pm
Join John Pasalis, report author, leading market analyst and Move Smartly contributor, and President of Realosophy Realty, and in a free monthly webinar as he discusses key highlights this month's report and answers your questions. A must see for well-informed Toronto area real estate consumers.
Register now to get recording of latest session and access to future sessions.
The Market Now
Looking at the most recent statistics for the Toronto area market for the latest month, September 2022, we are seeing that home prices have plateaued since July even as sales numbers declined because new listings and thus overall inventory remains low.
The average price for a house was $1,291,069 in September, down 23% from the most recent peak of $1,679,429 in February, and down 8% over last year. The median house price in September was $1,135,000, down 31% from $1,485,000 in February, and down 7% over last year.
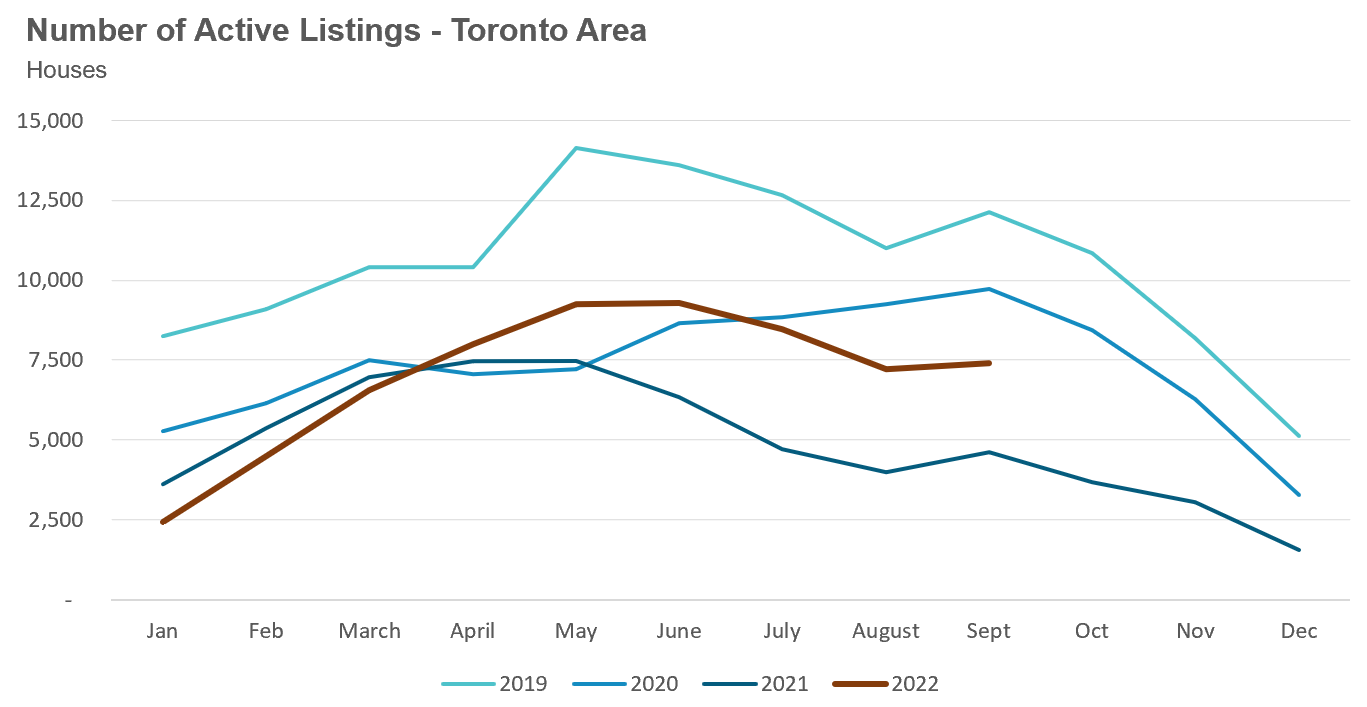
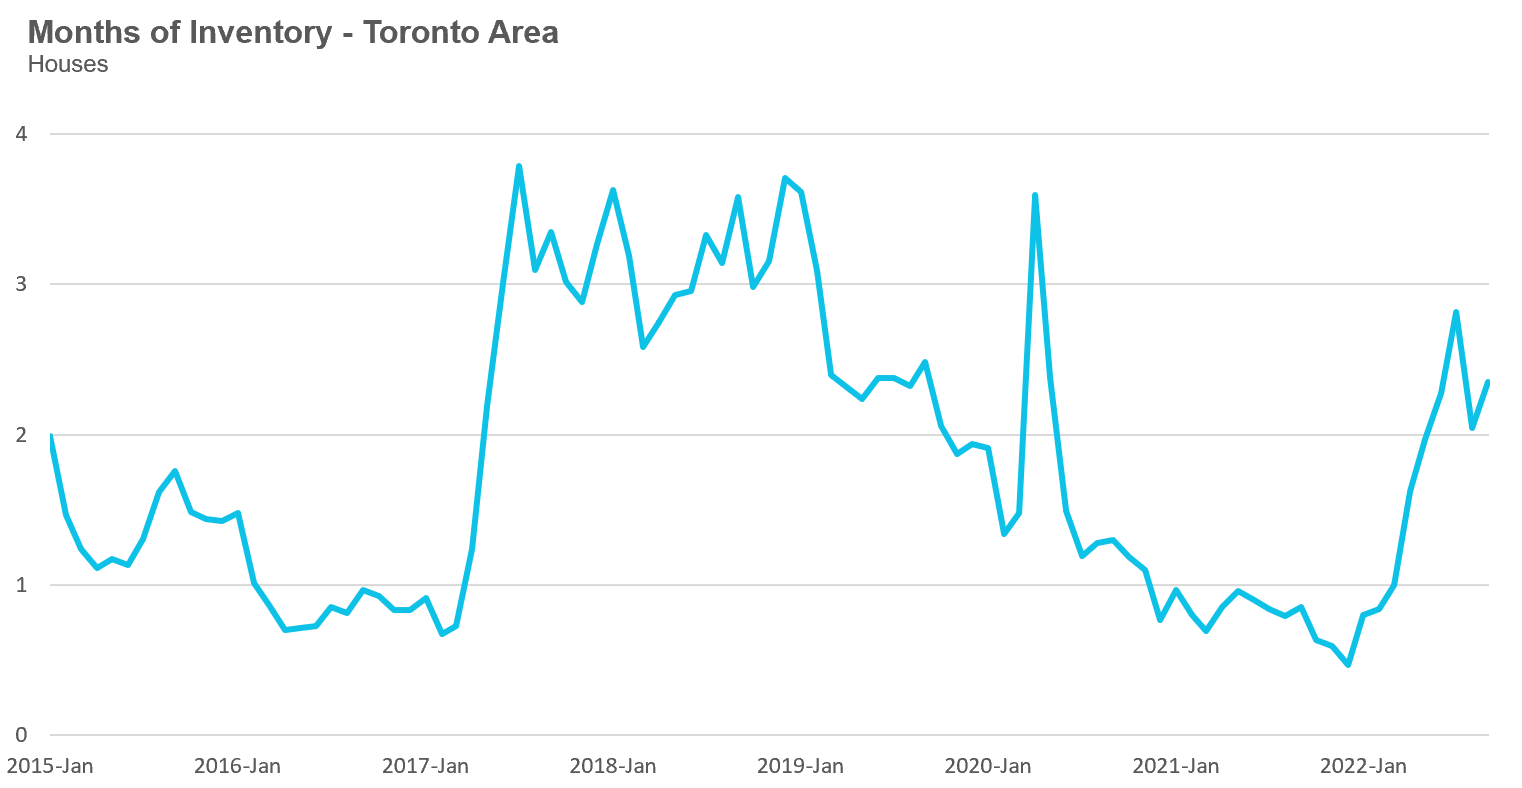
House sales in September were down a whopping 42% over last year and down 11% over the previous month. New house listings were down 16% compared to last year. The number of houses available for sale at the end of the month, or active listings, was up 60% over last year, when demand was notably high; the active listings number today is under 2019 and 2020 levels. The Months of Inventory (MOI) which is a measure of inventory relative to the number of sales each month increased to 2.3 MOI in September, indicating tight supply conditions.
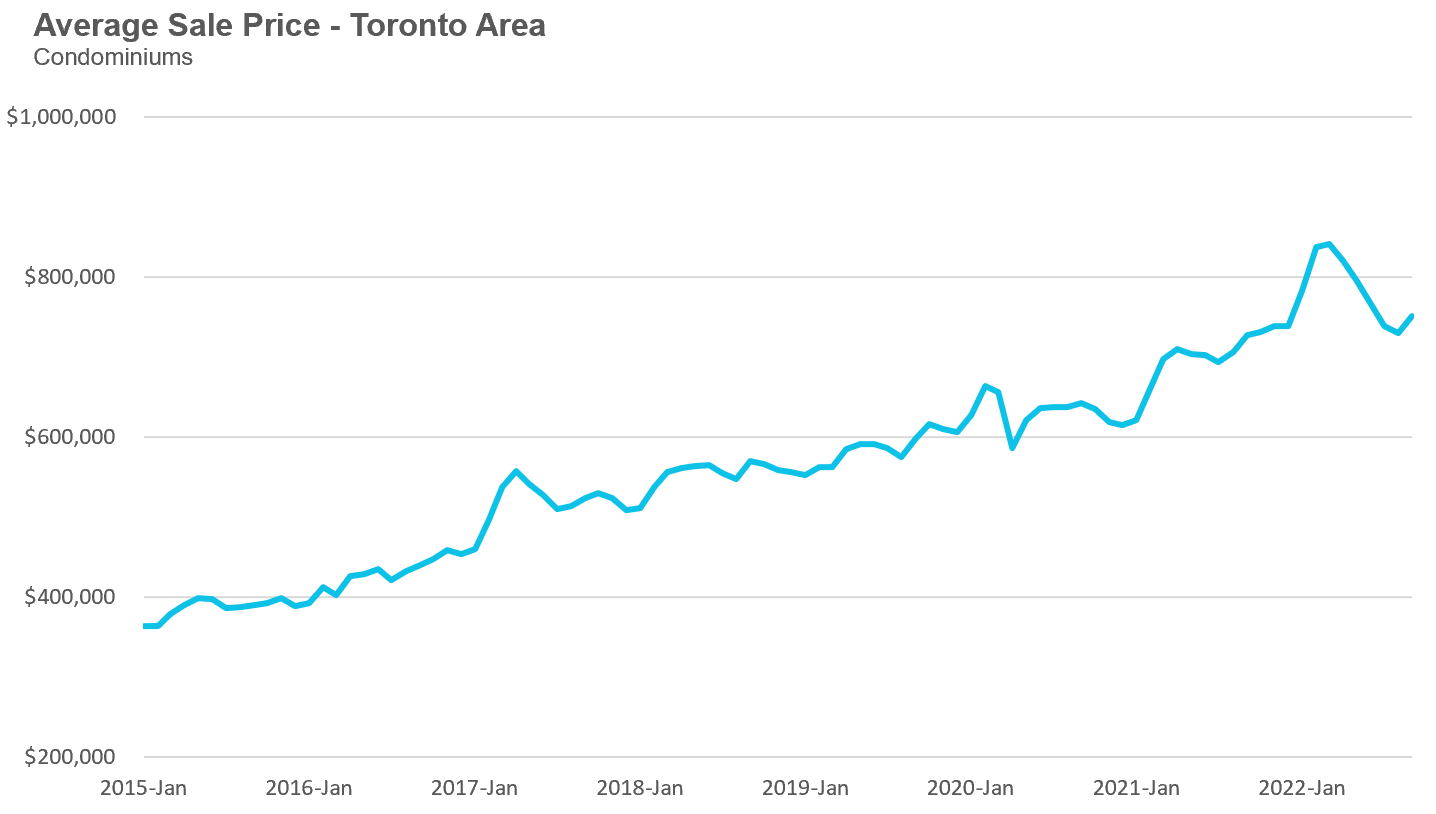
The average price for a condo fell to $750,637 in September, down 11% from the most recent peak of $840,444 in March, but still up 3% over last year. The median price for a condo in September was $675,000, down from $777,000 in March, but again up 3% over last year.
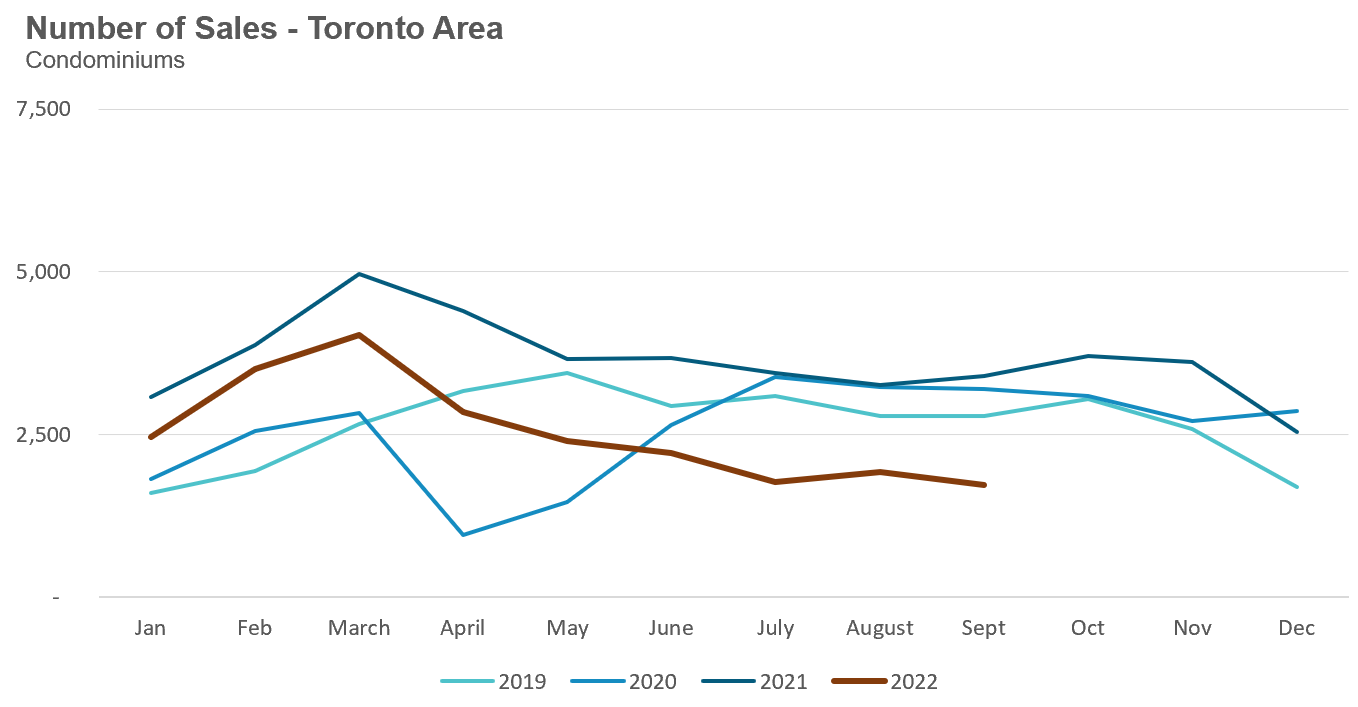
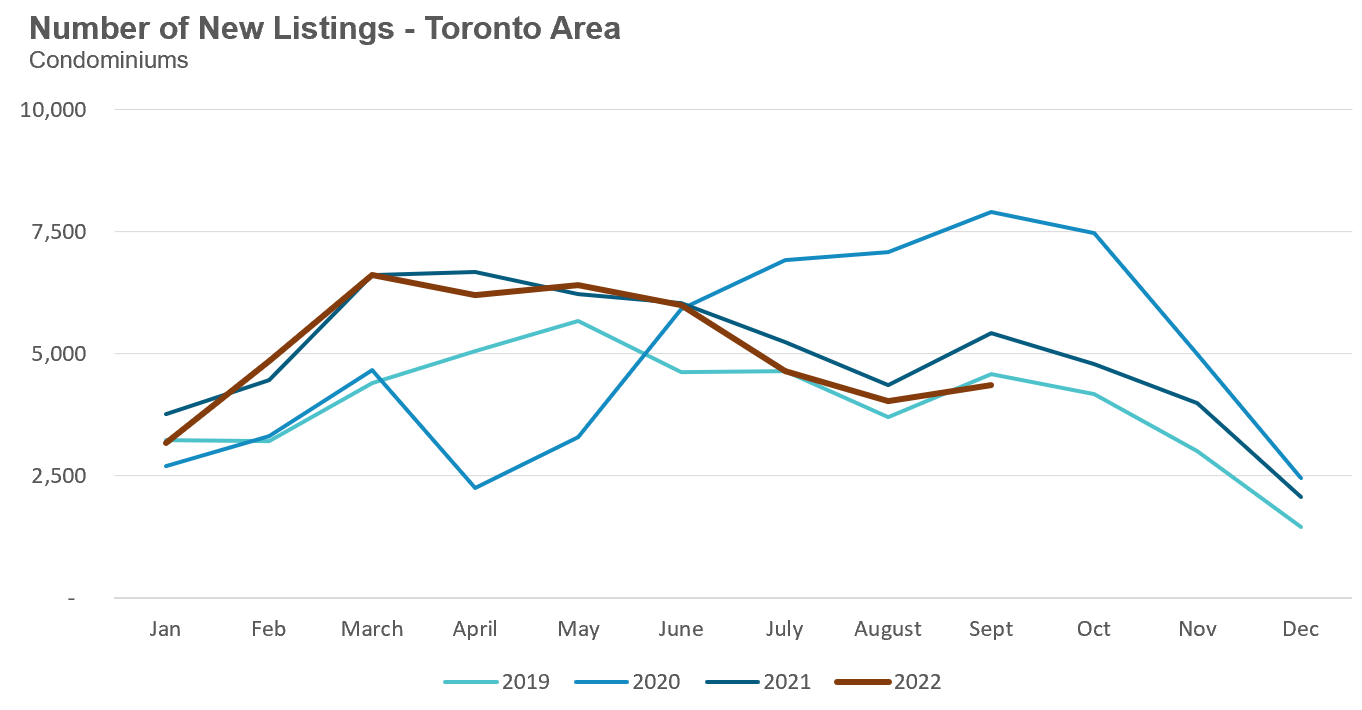
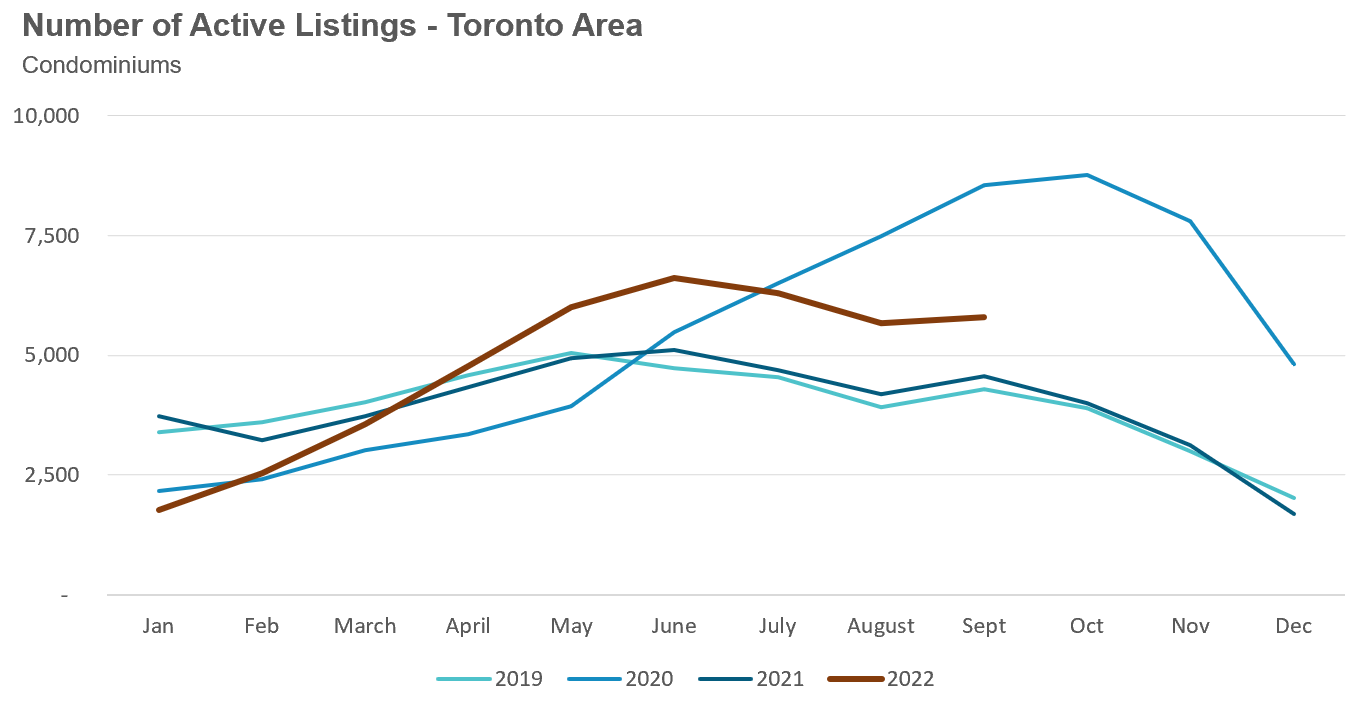
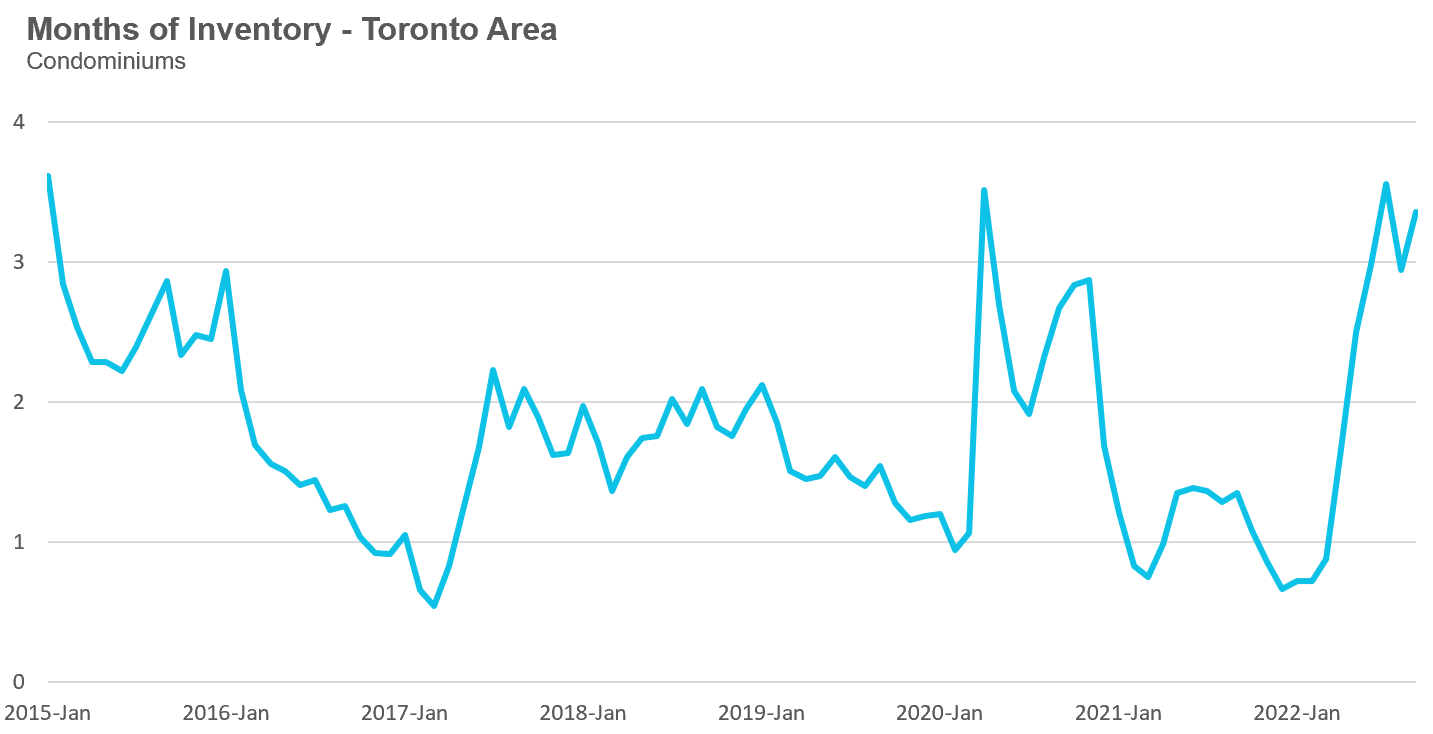
Condo sales in September were down 49% over last year and below pre-COVID sales volumes for the month in 2019. New condo listings were down 20% over last year while the number of active condo listings was up 27% over last year. The MOI increased slightly to 3.3 MOI in September, suggesting slightly loosening supply conditions.
(See bottom of this post for detailed monthly statistics for the Toronto Area, including house, condo and regional breakdowns, which can also be reviewed in our full report here.)
On The Ground: New Listings Hit a 20-Year Low in Toronto
Toronto’s housing market feels very frozen right now.
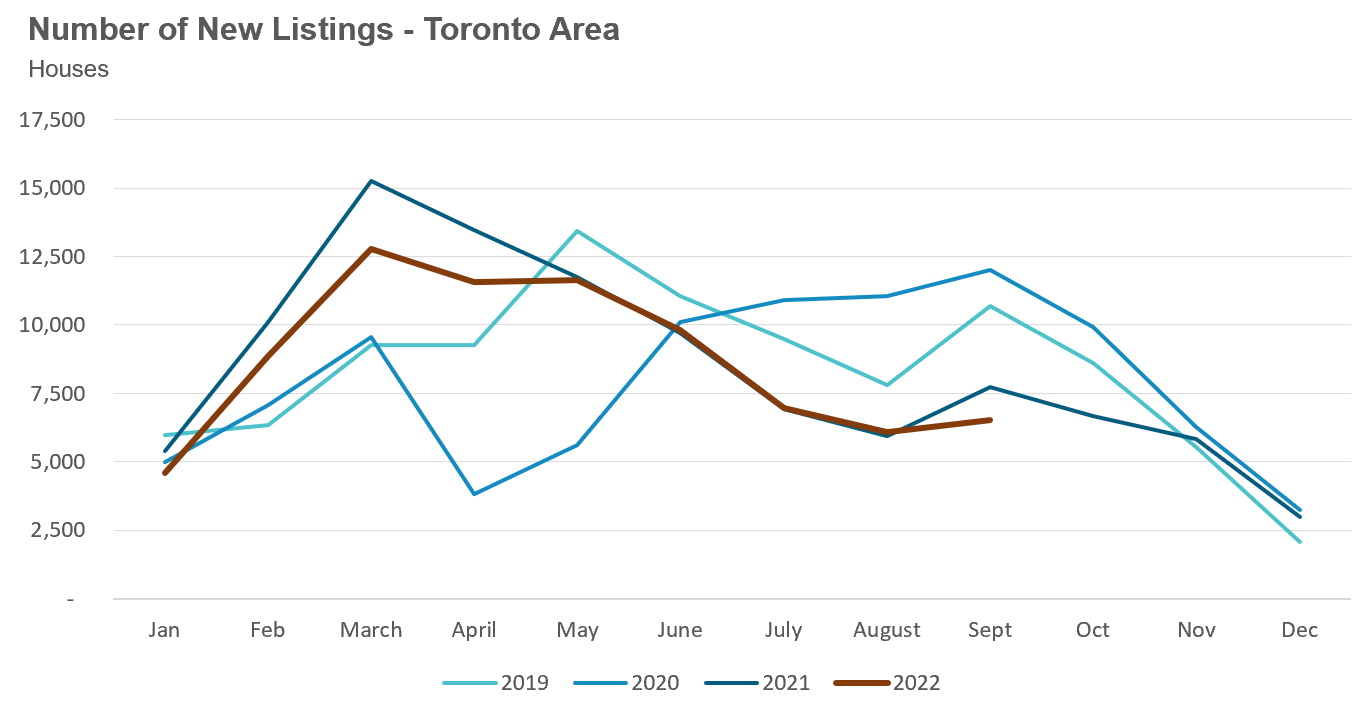
Though sales numbers have dropped significantly, we still have quite a few buyers interested in buying homes — but there isn’t much out there for them to buy. Inventory is very low in part because the number of new listings hit a 20-year low last month.
Why are new listings so low?
In some cases, owners are deciding to just rent out their homes rather than sell them in a slowing market, a trend I discuss in more detail in last month’s report. The other barrier is that today’s uncertain and volatile market means that anyone who wants to move right now is more likely to list their home for sale first and start to look for a place to buy only once their house has sold. In today’s market most people want to avoid the risk of committing to buying a home only to find they are unable to sell their current home (or unable to sell it for the price they expected) if demand worsens.
However, the downside with this strategy is that if buyers don’t find a new home quickly, they may have to rent a home in the interim. Most families don’t want to move out of their family home into a rental so fewer people are willing to sell and move. Those who are listing their home now and are prepared to move into a rental for a period of time are generally part of households undergoing some sort of new life event (e.g., a new child, divorce, etc).
This tight inventory today has led home prices to plateau since July as buyers and sellers are in a bit of a stalemate.
The other interesting trend is that the sentiment in today’s market is not overly pessimistic. Buyers and sellers are very cautious, but not as pessimistic as they were four months ago, and I suspect the lack of inventory has shifted the market sentiment.
Monthly Statistics
House Statistics
House sales (low-rise detached, semi-detached, townhouse, etc.) in the Greater Toronto Area (GTA) in September 2022 were down 42% over the same month last year and represents a 20-year low for the month of September. Home sales were also down over the previous month, a period when sales are usually up month over month.
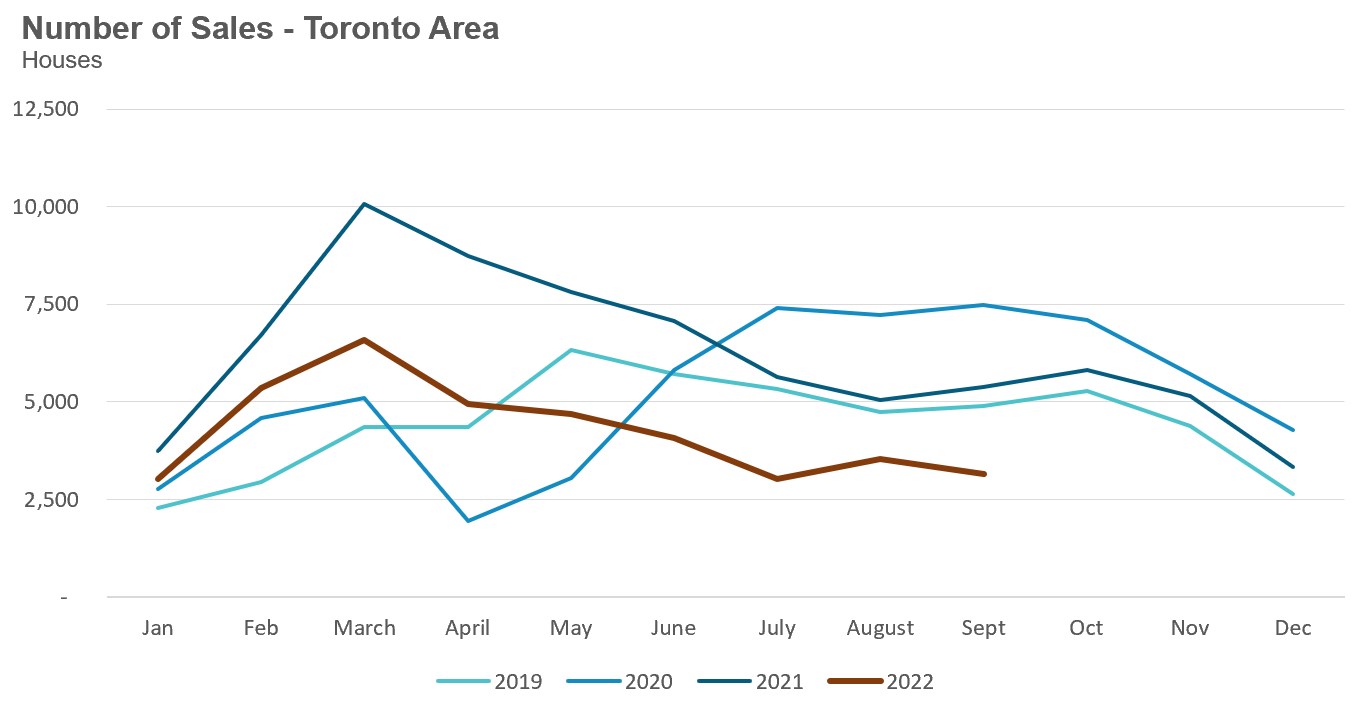
New house listings in September were down 16% over last year, and represent a 20-year low for the month of September.
The number of houses available for sale (“active listings”) was up 60% when compared to the same month last year, but still well below pre-COVID levels for the month of September.
The Months of Inventory ratio (MOI) looks at the number of homes available for sale in a given month divided by the number of homes that sold in that month. It answers the following question: If no more homes came on the market for sale, how long would it take for all the existing homes on the market to sell given the current level of demand?
The higher the MOI, the cooler the market is. A balanced market (a market where prices are neither rising nor falling) is one where MOI is between four to six months. The lower the MOI, the more rapidly we would expect prices to rise.
While the current level of MOI gives us clues into how competitive the market is on-the-ground today, the direction it is moving in also gives us some clues into where the market may be heading.
The MOI for houses increased slightly to 2.3 MOI in September.
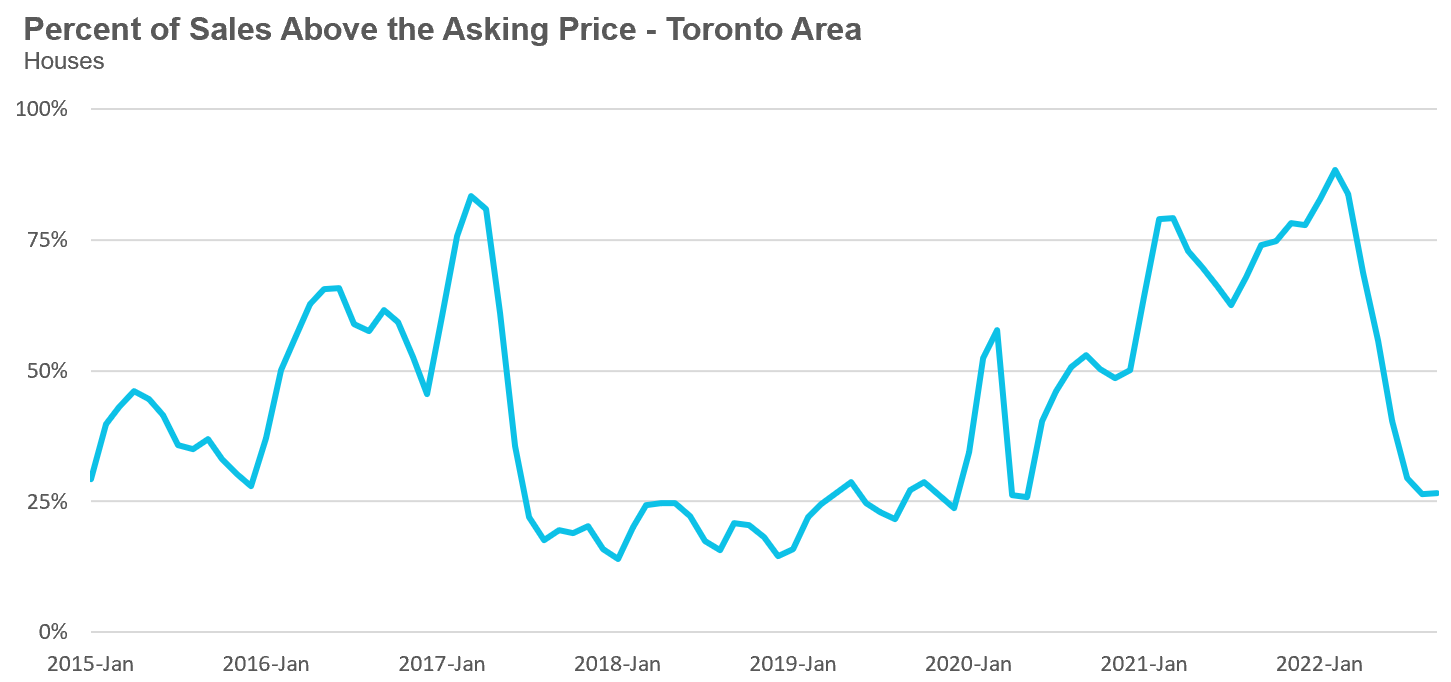
The share of houses selling for more than the owner’s asking price increased slightly to 27% in September.
The average price for a house in September was $1,291,069 in September 2022, well below the peak of $1,679,429 reached in February and down 8% when compared to the same month last year.
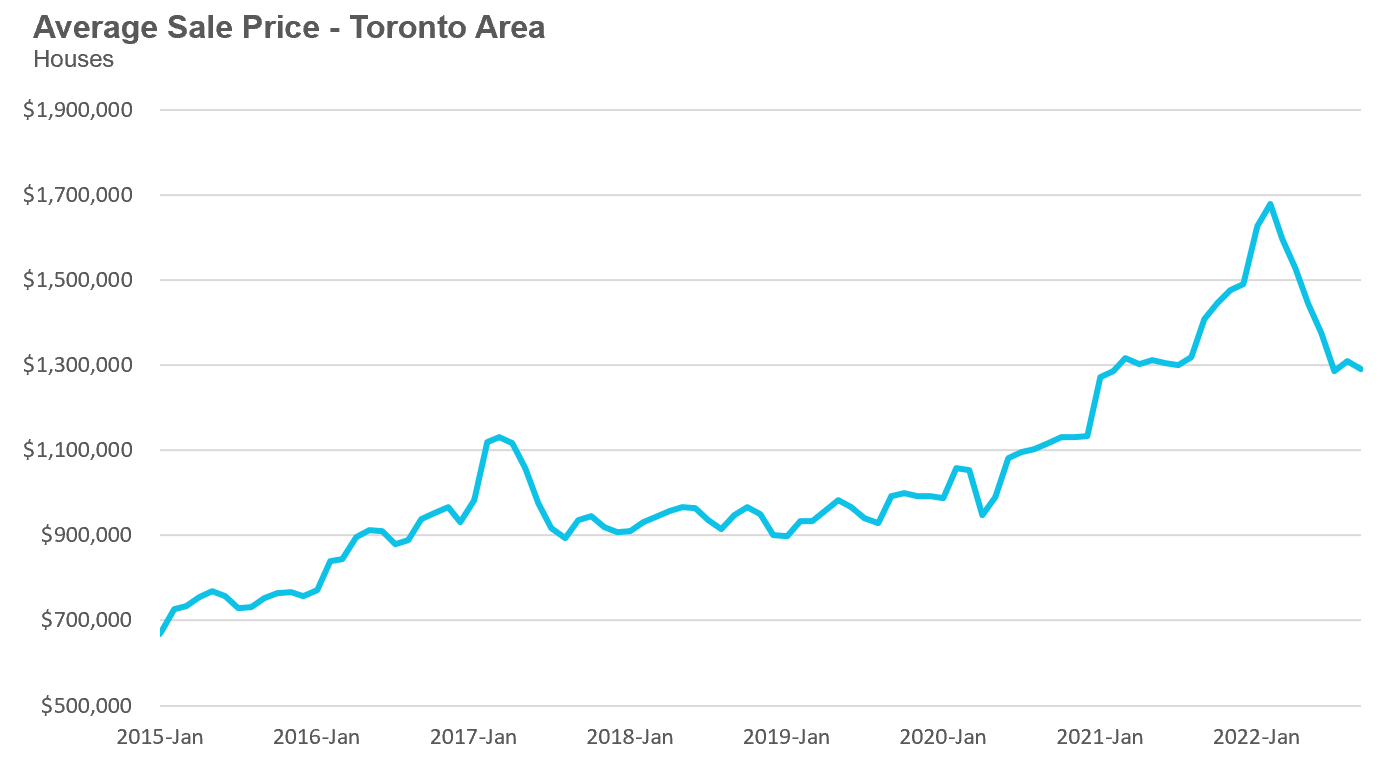
The median house price in September was $1,135,000, down 7% over last year, and below the peak of $1,485,000 reached in February.
The median is calculated by ordering all the sale prices in a given month and then selecting the price that is in the midpoint of that list such that half of all home sales were above that price and half are below that price. Economists often prefer the median price over the average because it is less sensitive to big increases in the sale of high-end or low-end homes in a given month which can skew the average price.
Condo Statistics
Condo (condominiums, including condo apartments, condo townhouses, etc.) sales in the Toronto area in September 2022 were down 49% over last year and well below pre-COVID sales volumes for the month of September.
New condo listings were down 20% in September over last year and in line with historical listing volumes for the month of September.
The number of condos available for sale at the end of the month, or active listings, was up 27% over last year.
Condo inventory levels increased slightly to 3.3 MOI in September.
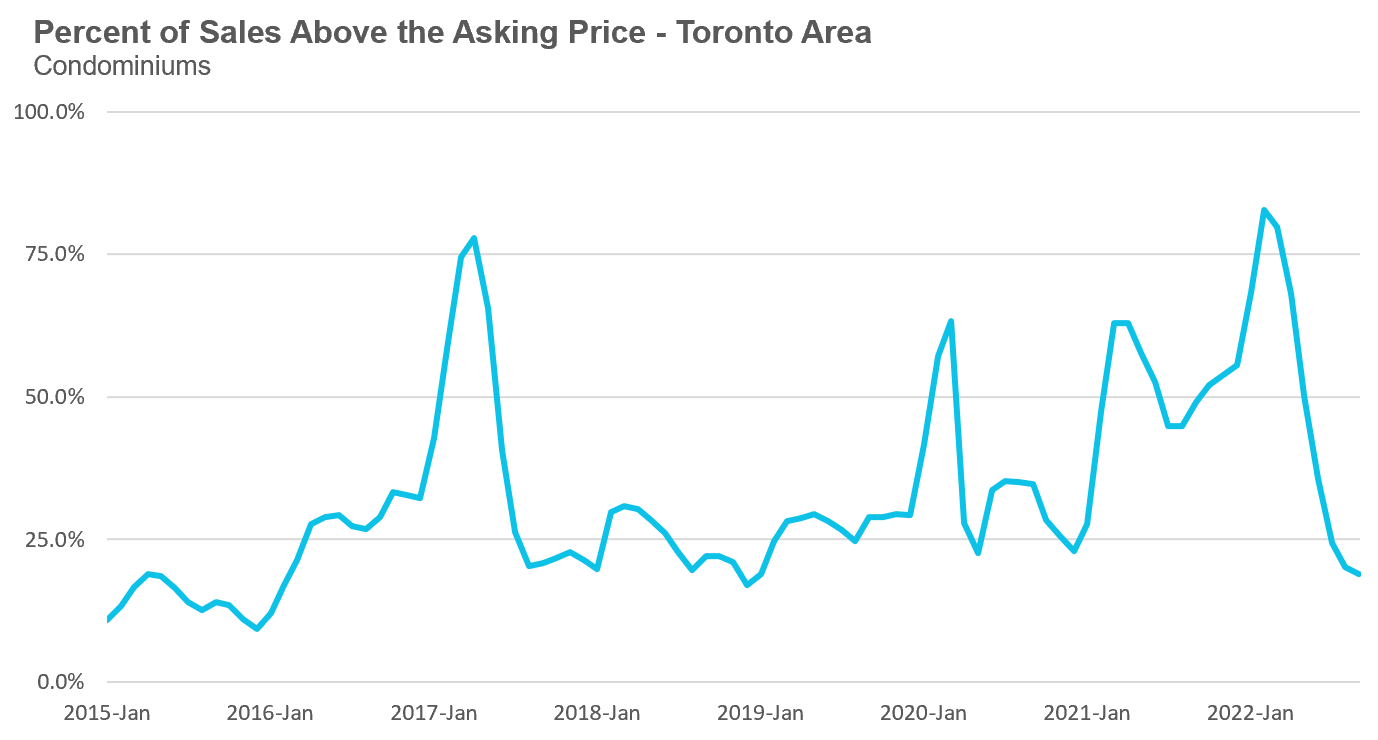
The share of condos selling for over the asking price declined to 19% in September.
The average price for a condo in September was $750,637, down from the peak of $840,444 in March, but up 3% over last year. The median price for a condo in September was $675,000, up 3% over last year, but down from $777,000, the March peak.
Regional Trends
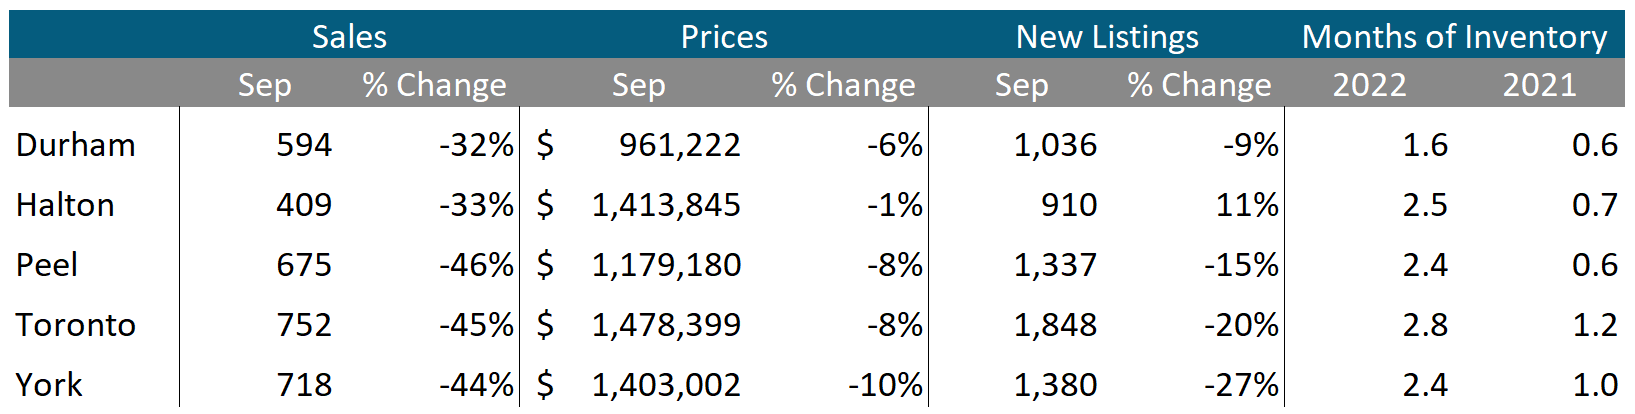
Houses
Average prices were down over last across all five regions with York Region seeing the biggest decline in prices. Sales were down significantly across all regions and inventory levels were well ahead of last year’s level.
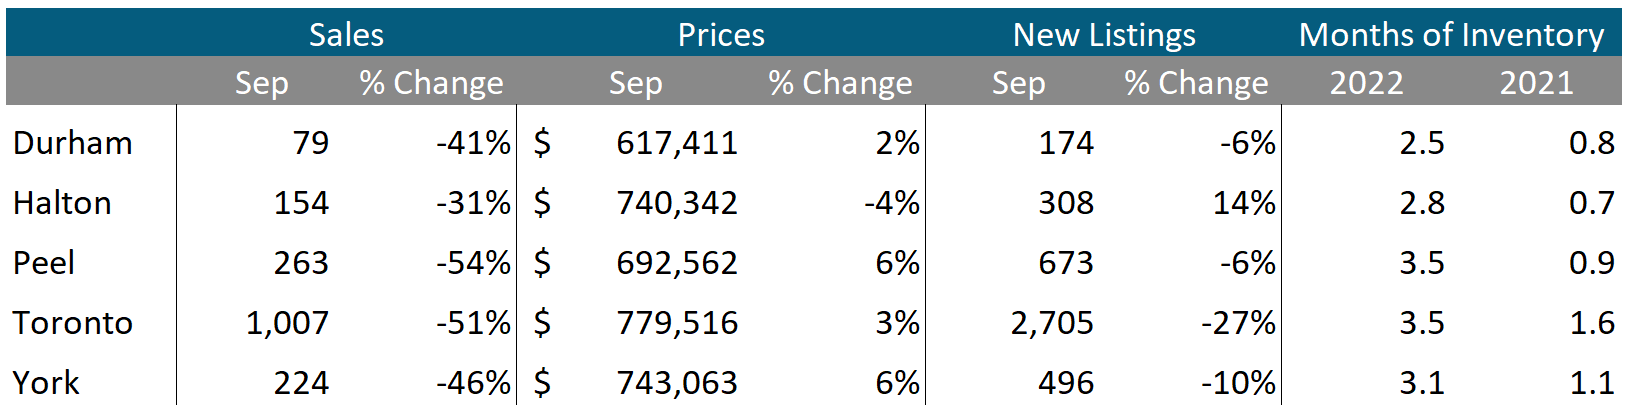
Condos
While condo sales were down across the GTA, average prices continue to be up over last year in Durham, Peel, Toronto and York, but down slightly in Halton region. Sales were down significantly across all regions and inventory levels were well ahead of last year’s level.
Browse Real-Time Market Trends on Movesmartly.com:
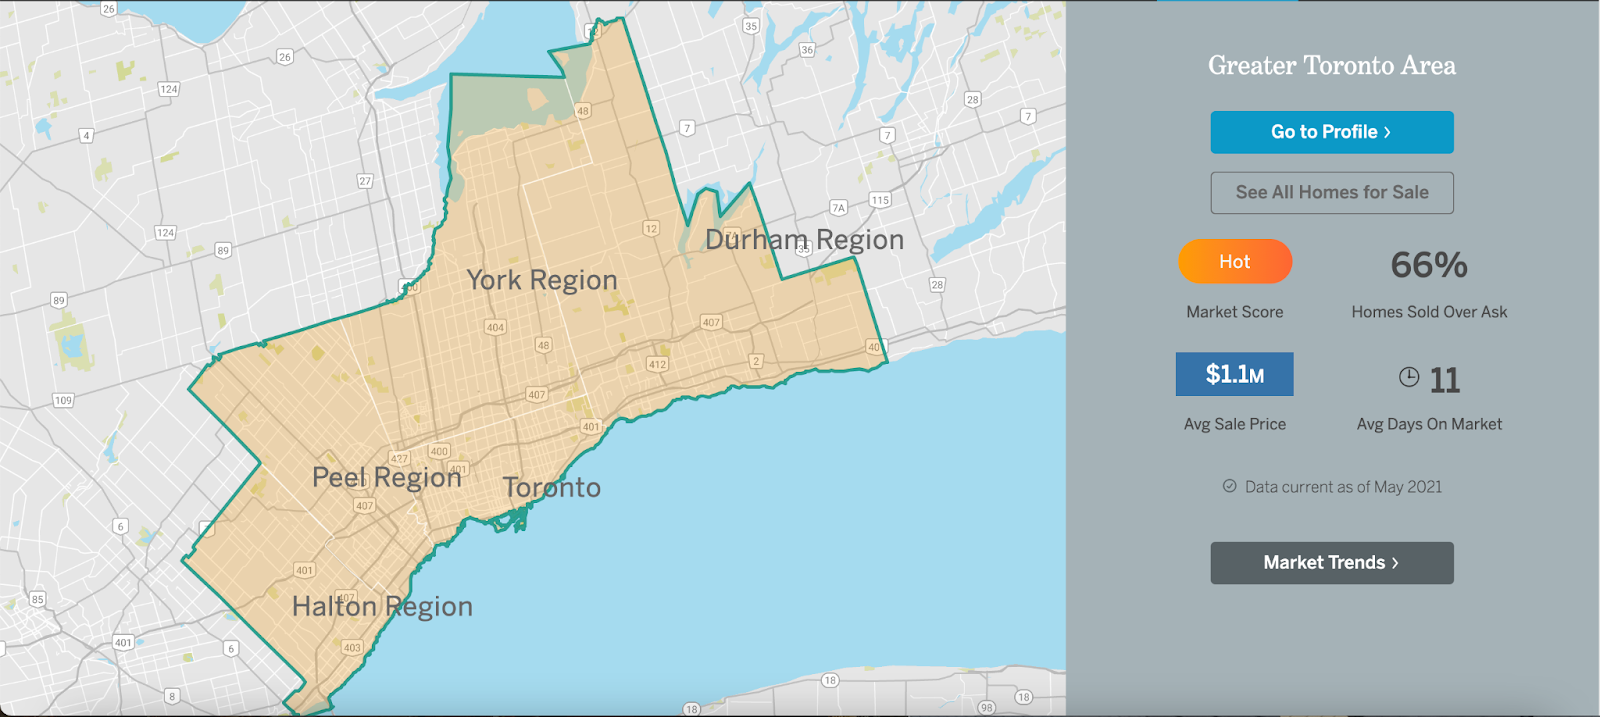
See Market Performance by Neighbourhood Map, All Toronto and the GTA
Greater Toronto Area Market Trends
FREE MONTHLY WEBINAR: The Market Now with John Pasalis - Next Session Wed Oct 19th 12pm - Sign up now!

Top Image Credit: Getty/iStock
The Move Smartly monthly report is powered by Realosophy Realty Inc. Brokerage, an innovative residential real estate brokerage in Toronto. A leader in real estate analytics, Realosophy educates consumers at Realosophy.com and MoveSmartly.com and helps clients make better decisions when buying and selling a home.
Published: October 17, 2022