FREE PUBLIC WEBINAR: WATCH REPORT HIGHLIGHTS & Q/A - Wed OCT 19th 12PM ET

Join John Pasalis, report author, market analyst and President of Realosophy Realty, in a free monthly webinar as he discusses key highlights from this report, with added timely observations about new emerging issues, and answers your questions. A must see for well-informed Toronto area real estate consumers.
Over the past month, I’ve been speaking with organisations such as the International Monetary Fund (IMF) and big Canadian and US banks about the state of Canada’s housing market. Given the rapid increase in interest rates that Canada has been experiencing, many are concerned about what might happen to Canada’s housing market in the months and years ahead. In the shorter-term, the biggest question is whether a big decline in prices, on the heel of a rapid run-up on home prices during the pandemic, could result in a housing fallout that could lead to significant economic and financial risks in the future.
Given that all of us are concerned about what might happen next, I thought it would be helpful if I shared some of the key takeaways from these talks with my readers, but before I do that I want to point out that ‘the good, the bad and the ugly’ depends on the perspective you’re looking at.
Often what is good for the economy and financial stability (i.e., avoiding steep and widespread drops in home prices which have negative knock-on effects for the wider economy) is not necessarily good for housing affordability (as home prices in Toronto would need to come down quite a bit to see affordability improve). So keep in mind that some of the factors I’m referring to as ‘good’ are not necessarily so from a housing affordability or societal perspective but from an economic and financial stability perspective.
The Good
When considering the factors that might help Toronto’s housing market avoid a deep crash in prices in the years ahead, the low-inventory of homes available for sale right now is one early signal we can take from the market.
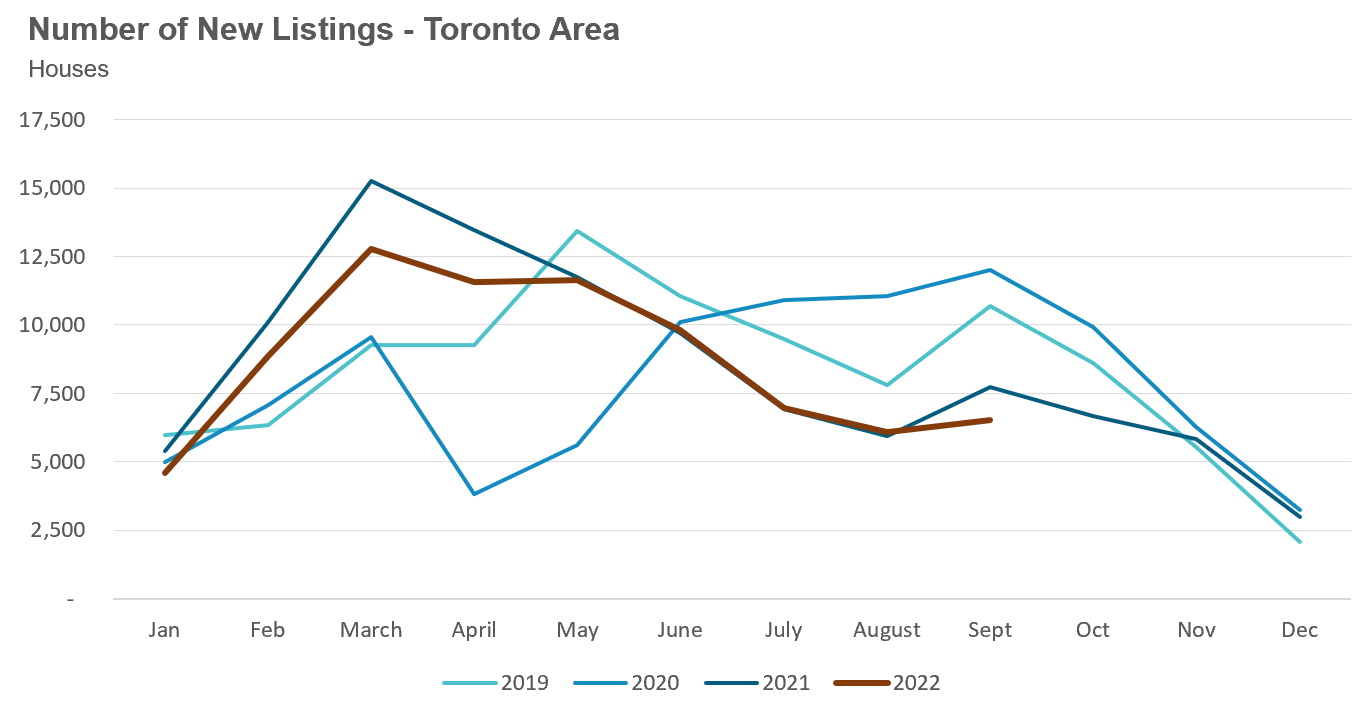
As I mentioned earlier, the number of new listings in the Greater Toronto Area (GTA) last month was at a 20-year low for the month. In last month’s report, I also showed that among the sellers who are listing their homes for sale, a high number of them are able to take their properties off the market if they can’t achieve the price they wanted and are in some cases deciding to rent out their properties instead. This suggests that investors are confident in the longer term future for housing in Toronto and appear to have the financial means to hold on to their properties in today’s higher interest rate environment.
While we are still only six months into this rate hiking cycle, I’ve already mentioned how the lack of inventory has already brought some stability to home prices which have plateaued since July.
The second factor is that Canada’s population is booming far faster than our ability to build houses. The chart below shows Canada’s fourth-quarter rolling (the current fiscal quarter and the three preceding fiscal quarters considered as a single period) population growth in red, which we can see has surged well above our historical 320,000 average to over 500,000 people per year. And in blue, we can see that Canada’s housing completions have not changed much and are at or below 200,000 completions per year, roughly the same level as fifteen years ago.
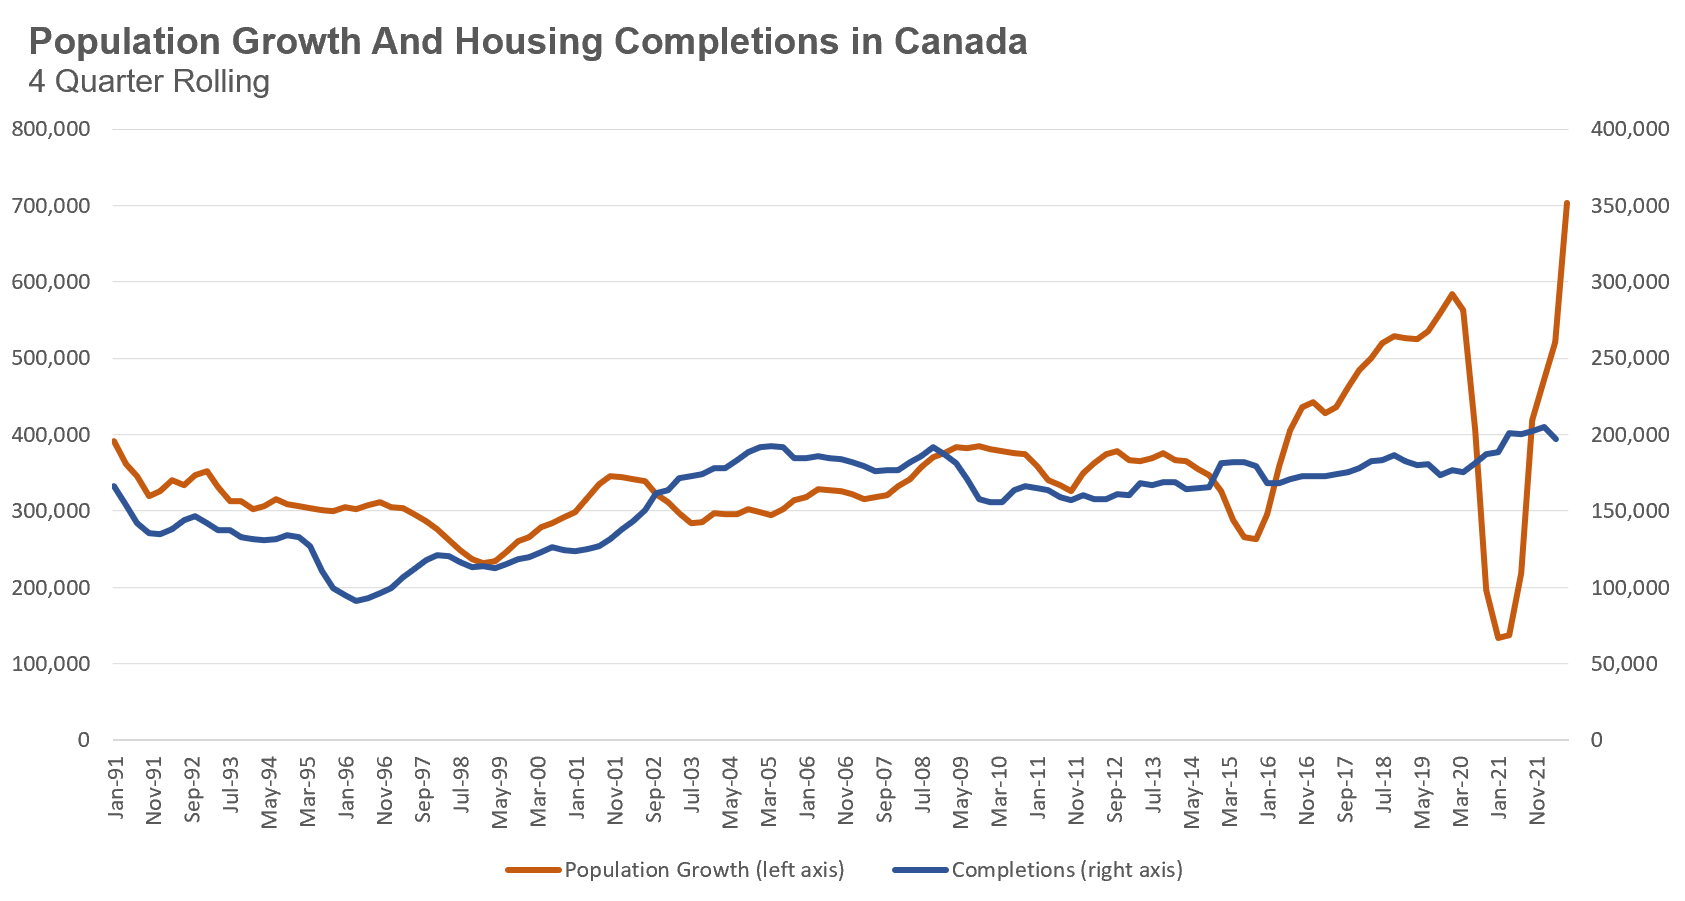
Despite the promises from politicians that they are going to double the supply of new housing to improve affordability, most Canadians know that this is impossible for many reasons; at the top of the list is Canada’s lack of skilled construction labour needed to scale up our housing completions to that level.
While many of the people moving to Canada may not be able to afford to buy a home at today’s prices, they will still need a place to live, ensuring ongoing rental demand, which will continue to make real estate a very attractive investment.
Which leads me to the last factor that may help lead to relatively stable home prices in the future — real estate investors. This may sound counterintuitive to anyone who studies housing markets or regular readers of my reports. I have often stated that housing markets with a disproportionate number of investors are often the most vulnerable in a housing correction as we saw during the 2008 US housing and financial crisis where the “bubble states” of Arizona, California, Florida and Nevada, which had a much higher share of investors buying homes, also saw some of the biggest declines in home prices. Internationally, the housing market in Dubai saw a significant boom in demand from real estate investors in the early 2000s, which was followed by a deep bust in prices.
I appreciate that the argument “things are different here” is a cliche we often hear at the peak of the market, but I'll still make the case for why our investor-led market is different in Canada and why I don’t think we’ll see the same type of investor-led volatility in prices we have seen in other markets. But it’s worth noting that I’m specifically referring to investors who own existing homes, not investors in pre-construction properties which I’ll touch on later.
To start, it’s important to unpack what we mean by investors. I’m going to define, and attempt to quantify, three different types of investors in Toronto’s housing market.
The first type are often called ‘Buy To Sell’ investors, also commonly referred to as ‘flippers’. These are investors who buy a property and then resell it within a quick period of time, which I’ll quantify here as eighteen months, with or without adding renovations. In some cases, the ‘flipper’ is just a family that has to sell their home in a short period of time due to a sudden life event or change in employment that requires them to leave the city or province.
Despite all the talk about house flippers being a major problem in Toronto, the data shows that they don’t make up a big share of the market, accounting for fewer than 5,000 sales each year. It’s worth mentioning that due to our methodology for measuring Buy To Sell investors, 2020 is the last complete year we can report on.
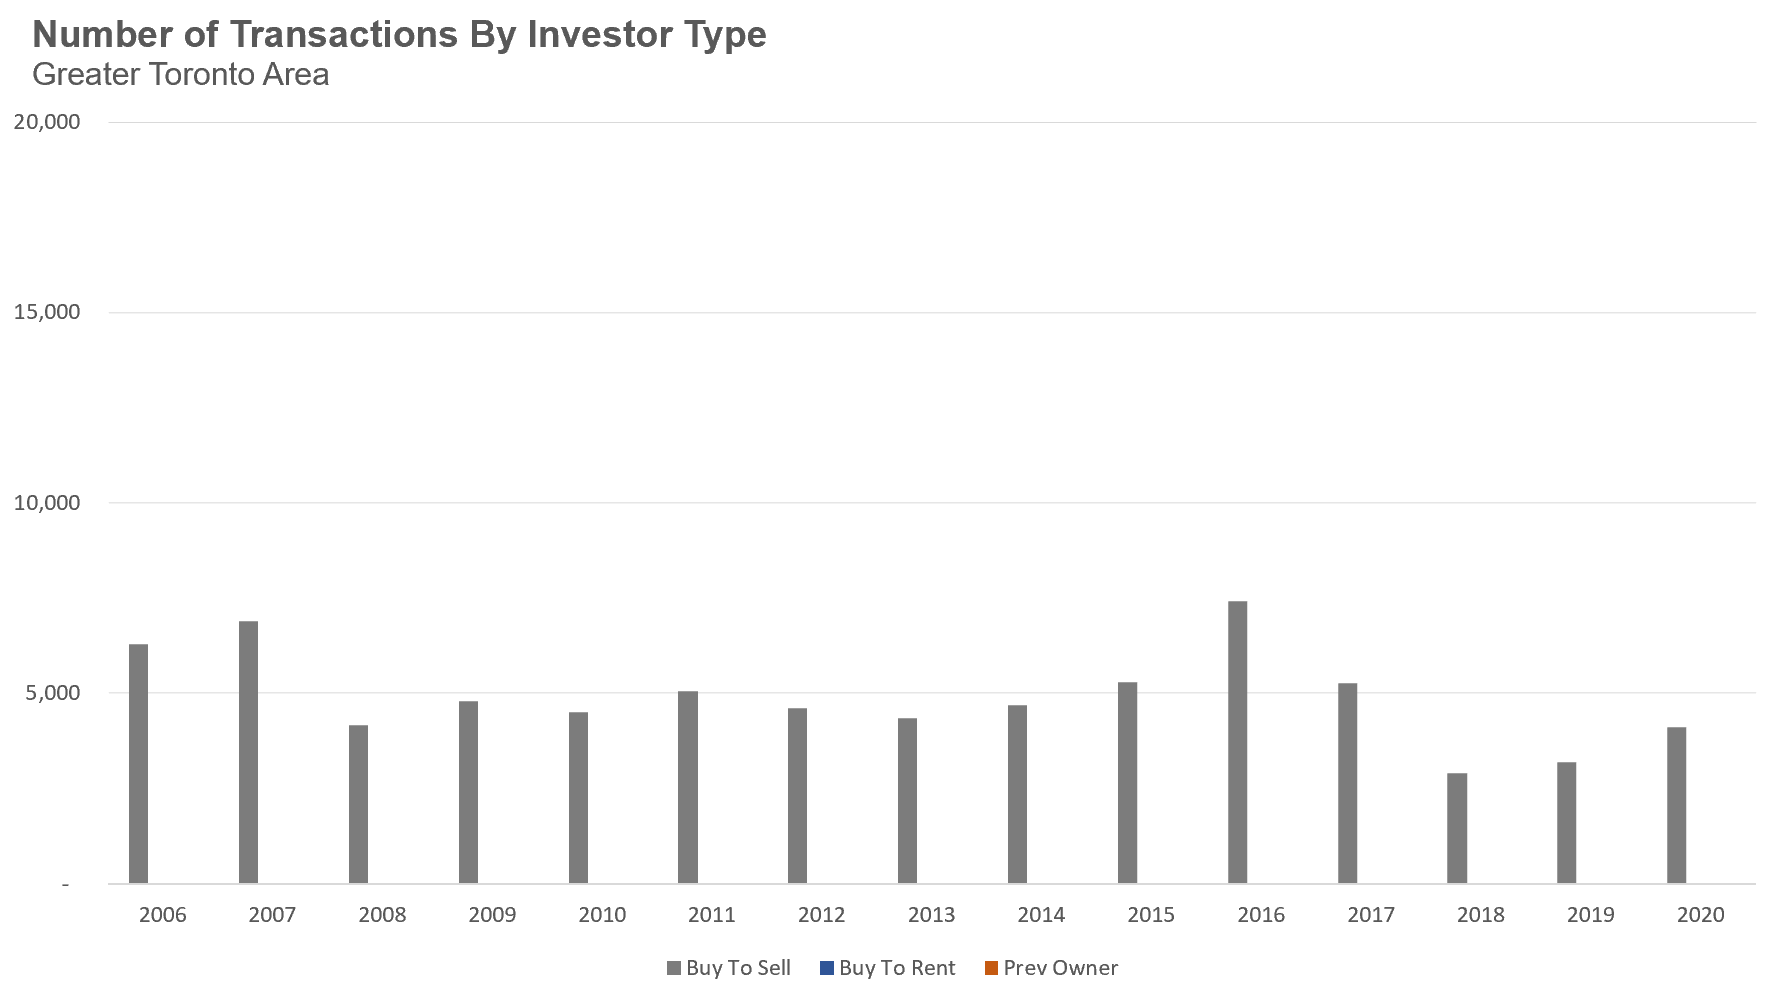
This is an important metric to track because of the different types of real estate investors, a high rate of flippers is among the biggest red flags because it’s a highly speculative practice. During the early 2000s real estate frenzy in Dubai’s housing market, prices were rising so rapidly that investors were flipping their pre-construction condos for a big profit after just six months.
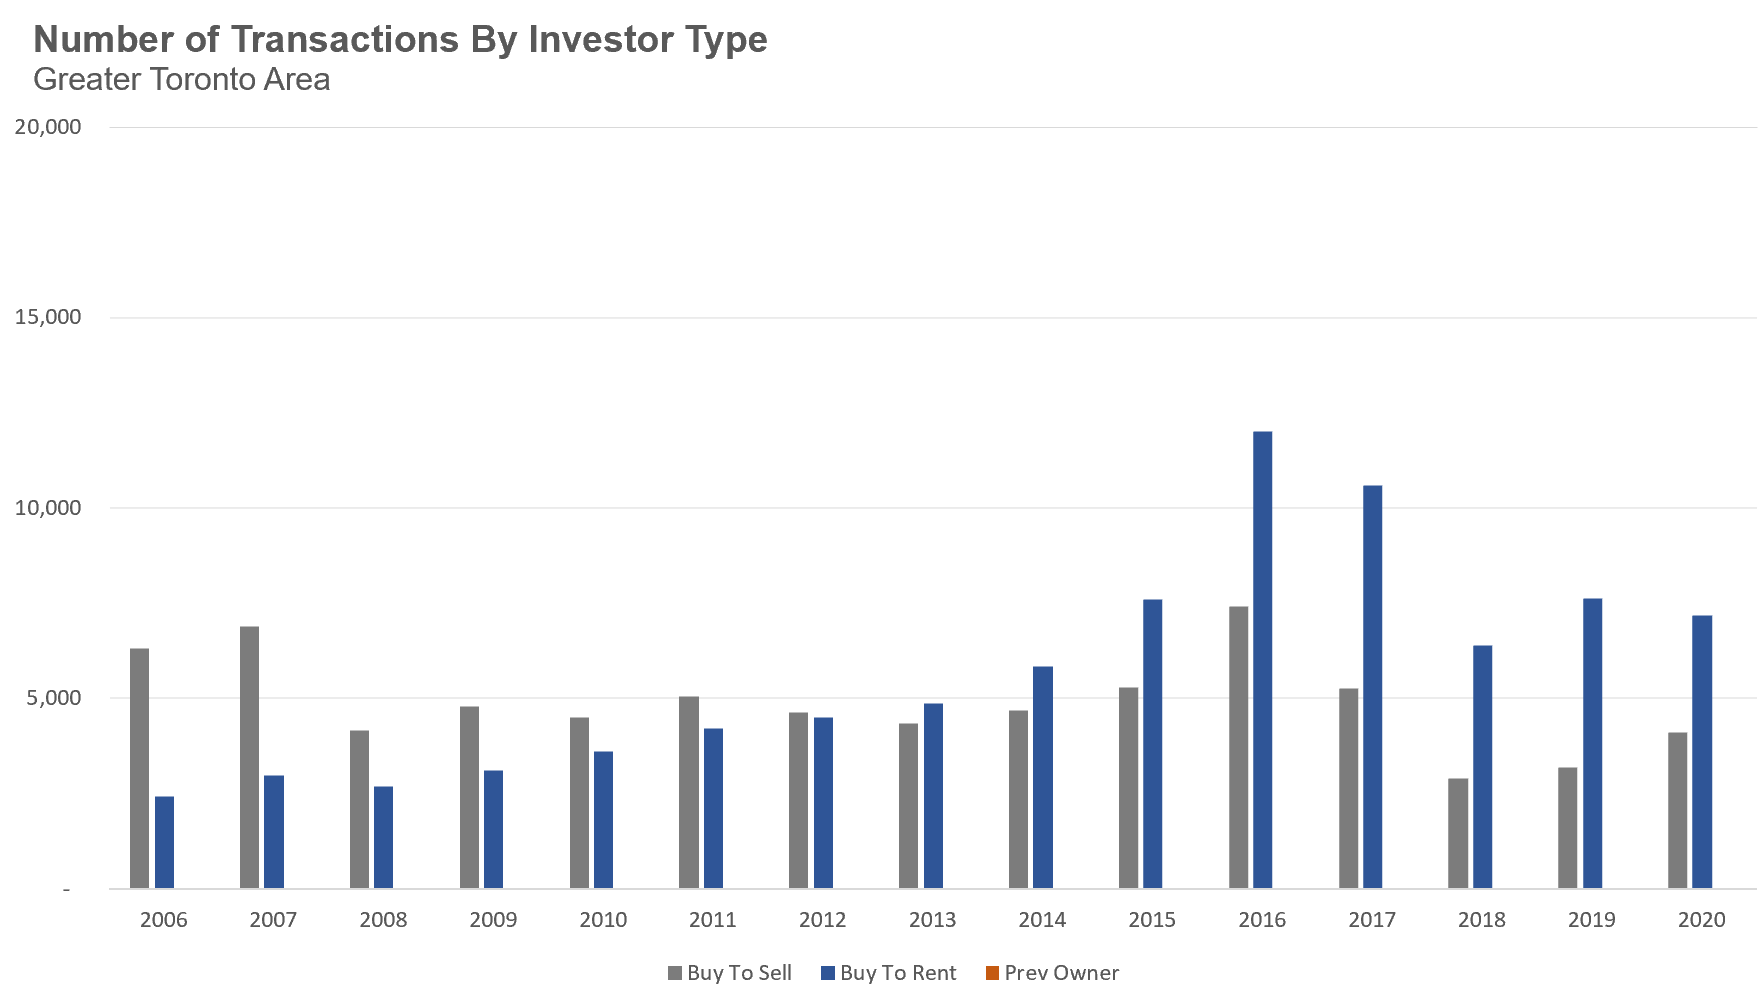
The next type of investor that rents out a property within a year of buying it are often called ‘Buy to Rent’ investors.
We can estimate the share of homes bought by ‘Buy to Rent’ investors by looking at all the homes listed for rent on the Toronto Regional Real Estate Board’s (TRREB) MLS system in any given month and then looking back in time to see if that same home was bought within the previous 12 months.
While the majority of houses or condos available for rent each month are listed on the TRREB’s MLS system, some investors opt to list their properties on private rental sites instead. This methodology therefore will undercount the total number of ‘Buy to Rent’ investors because we have no way of measuring homes that were listed for rent on those websites. Despite this undercounting, it’s still important for us to consider how the share of purchases from ‘Buy to Rent’ investors on the MLS have changed over time.
The chart below shows the number of homes purchased by ‘Buy to Rent’ investors since 2006, which accelerated and peaked in 2017. As I highlighted in my report Freeholds on Fire, this boom in ‘Buy to Rent’ purchases was driven by a boom in demand for low-rise suburban homes.
It’s also noteworthy that the number of homes bought by ‘Buy to Rent’ investors has declined since 2017 and has stabilised over the past two years.
There is one more class of investor that tends to fly below the radar because they are not actively buying homes in today’s market. These are people who have lived in a house or condo for years, and decide to keep it as an income property when they move out to live in another house, or out of the province or country altogether.
We can estimate the number of homes held by these investors by looking at all of the leased homes in a given month and then looking back in time to see if the last transaction on that home was a sale as opposed to a lease (i.e., a rental) or no previous transaction, and if that sale occurred more than one year ago.
Under this scenario, the moment the owner moves out of the home and rents it out, the property changes from being an ‘owner occupied property’ (or ‘end-user’) to a home owned by an investor — even though the actual owner hasn’t changed. I call these investors ‘Previous Owners’ and the chart below shows the number of homes each year that were once owner occupied and have been converted to rental properties each year by this measure.
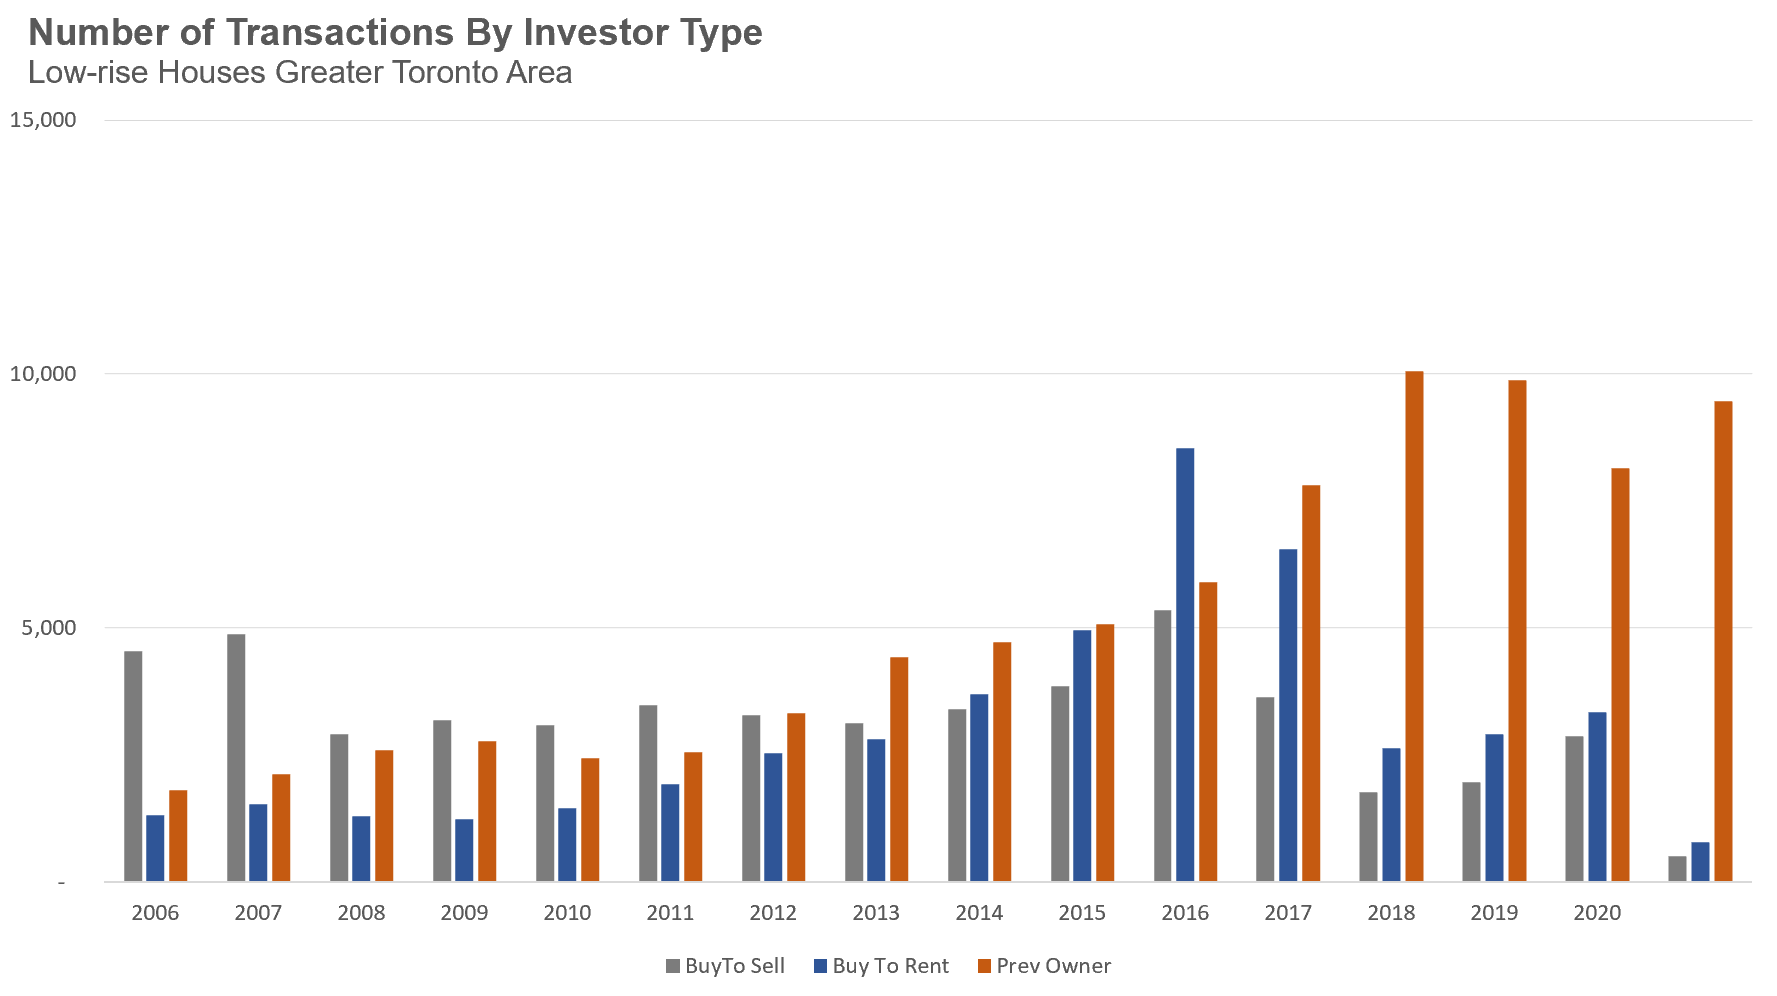
Now that we know the largest share of Toronto investors are ‘Previous Owners’ it’s important to consider how this impacts the housing market.
Firstly, not only are these investors holding onto their properties for the long-term as opposed to the short-term, unlike the ‘Buy to Sell’ investor, the ‘Previous Owner’ investor has likely bought their home years ago when prices were much lower and likely has far more equity in their home as opposed to an investor who just bought at recent prices.
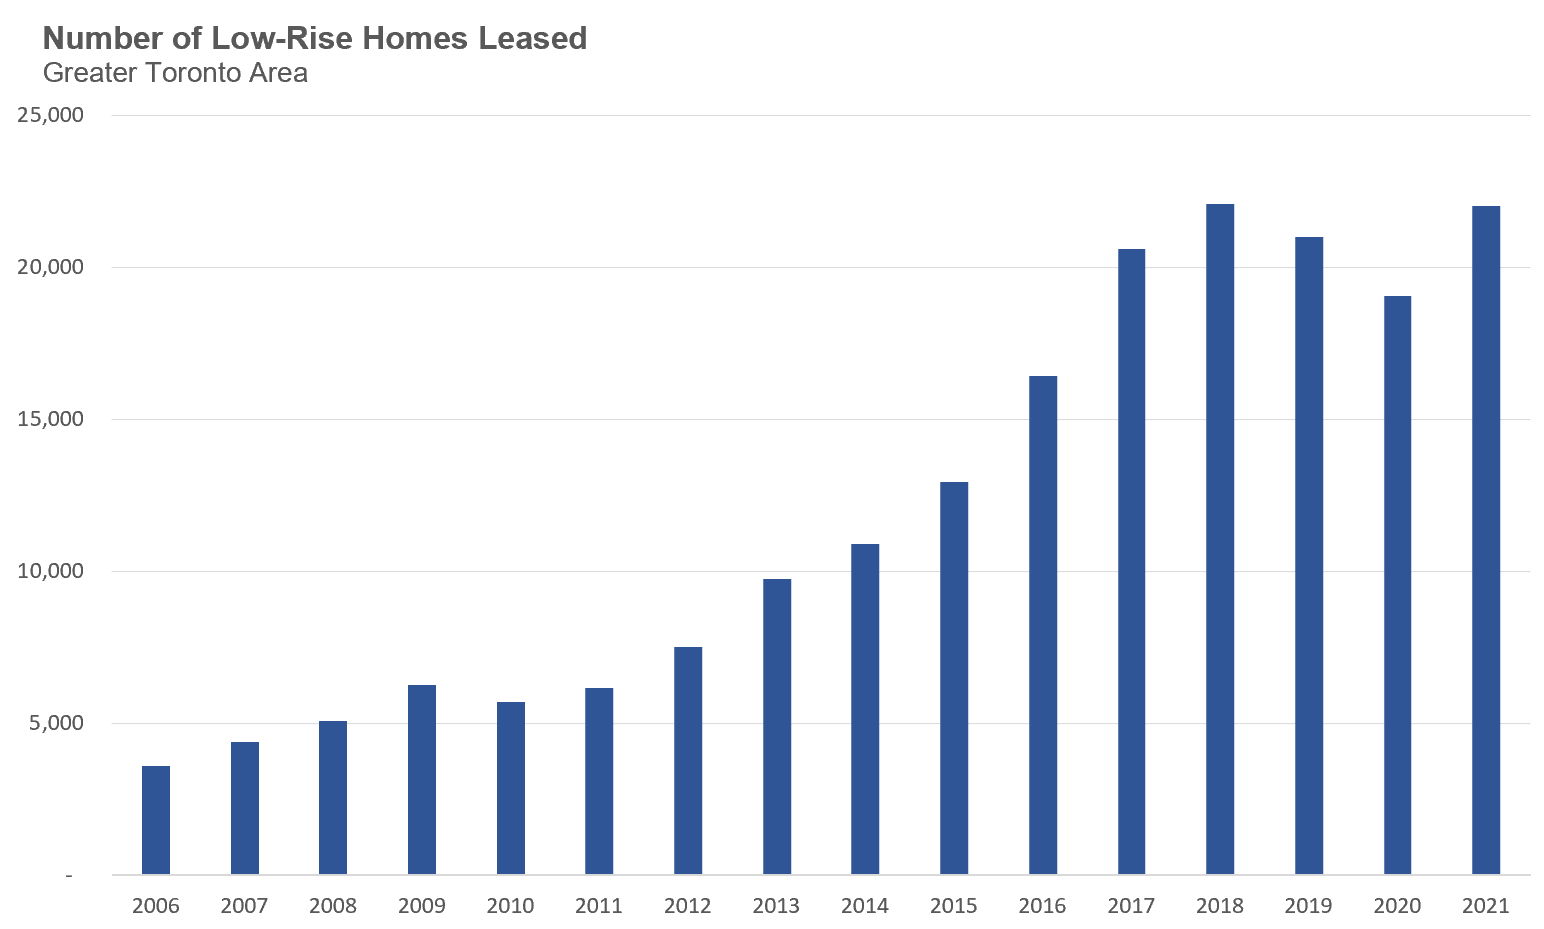
Given that ‘Previous Owners’ appear to be the most dominant investors in Toronto, it is important to track their behaviour because they are reducing the total stock of homes available to be bought by end-users over time.
We can see this dynamic by looking at the number of low-rise houses that have been listed for lease on the MLS. I decided to focus on low-rise houses in this chart because condo trends are a bit different here; we expect the number of condo rentals to increase over time (even amidst heavy investor activity) because thousands of new condo units are being completed each year.
In 2006, we saw roughly 4,000 houses being leased each year on the MLS and this has now accelerated to over 20,000 houses each year.
This ultimately is one of the reasons why Canada’s homeownership rate has been declining.
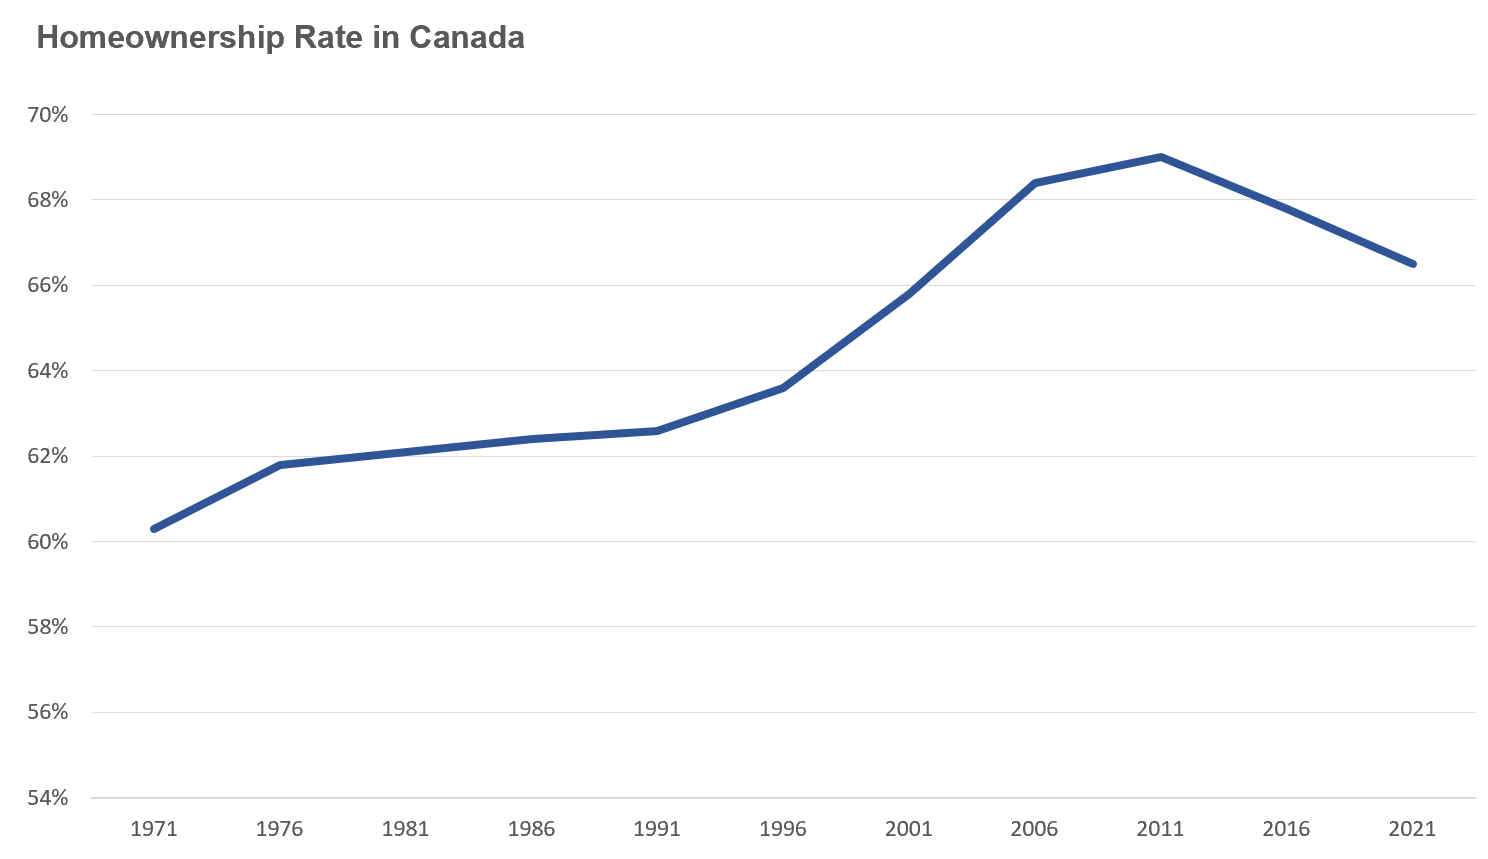
Not only are we not building enough homes for our growing population, but we are losing already existing homes to the pool of investor-owned properties at a rapid rate, which means that each year, we have more buyers competing for fewer homes available to be bought, pushing home prices up.
These trends are not great from a social or housing affordability standpoint, but these dynamics will likely prevent deep drops in home prices that could lead to economic and financial instability.
The Bad
While the housing market is relatively stable today, the fact is that we are still only six months into this rate hiking cycle, and a lot can change in the months ahead, especially as rates are expected to rise further in the future.
One important factor will be whether we see an increase in the number of distressed home sellers over the next 12 to 24 months. Anyone renewing a mortgage over the next year will see their payments increase significantly and some of the most overleveraged households may need to sell their home or investment properties because they can no longer afford their monthly payments.
While I do think we will see distress among the most leveraged households, I don’t think we will see much distress outside of this group. My conversations with experts lead me to believe that policy makers will allow households to extend the amortization period on their mortgage at renewal in order to soften the payment shock for renewing borrowers, lessening the potential for rush-selling due to a rise in mortgage payments.
The other potential source of distressed sales could come from households experiencing a job loss in the new year. This is a key consideration given the widespread consensus that many countries, including Canada, are expected to go into recession as high interest rates stifle growth; however, here again, our federal government has made it clear that they are prepared to support households during a recession by allowing them to defer their mortgage payments in the event of a job loss.
On the other hand, job losses can also lead to a larger problem that is much harder to cushion - pessimistic sentiment about the economy as more buyers become anxious about the potential for losing their jobs, leading to a steep drop in buyer demand, and a resulting decline in prices. Market sentiment, which is so difficult to predict, often has the biggest impact on the short-term path of home prices.
While I’m not in the prediction business, due to this mix of good and bad factors, I suspect that if we see more downward pressure in the housing market in the year ahead, the decline will likely be far more gradual than the decline we experienced in the GTA earlier this year.
The Ugly
The biggest potential risk I see in Toronto’s housing market is in the pre-construction condo, and here, we are already seeing some early signs of trouble.
Many pre-construction condo buyers, the majority of whom are investors rather than end-users, who have bought a unit scheduled for completion in the near future are having a hard time getting a mortgage for the remaining amount owed due to today’s higher interest rates and stress tests. Those who cannot qualify are trying to ‘assign’ their unit, i.e., sell/flip their contract to another buyer before they are contractually obligated to take possession of and pay for the unit.
Many of those who are trying to assign their units today likely bought their units five or more years ago and have seen the market value appreciate above what they paid for it. But these investors are having a hard time attracting buyers, even as they discount the price of their units because demand has fallen.
The risks today are relatively minimal, but the longer interest rates stay high, and if condo prices gradually fall further, there’s a bigger risk that the condos completing two years from now might be worth less than what buyers paid for them, which makes it even harder for these buyers to get a mortgage given they would need to pay for the difference between what they paid for the condo and what it’s worth, in addition to coming up with their down payment.
If the market turns very pessimistic, and if we see a sharp decline in resale condo prices, there’s the additional risk that buyers will stop making their scheduled deposits on their pre-construction condo units which can impact construction financing and completions more generally in the future.
While these potential outcomes are ones we saw during the 2008 financial crisis in housing markets that had a high share of pre-construction condo investors, I’m not entirely convinced this will materialize as fully in the Toronto area.
The big difference between Toronto and many of these other bubble markets is that their housing markets ended up being overbuilt and oversupplied when the market turned. I don’t think there’s a big risk that Toronto’s housing market is going to be oversupplied by the condos currently in the pipeline. If there are a significant number of distressed investors in the future I suspect we will see big institutional investors stepping in to buy these pre-construction condo assignments from mom-and-pop investors moving more of our housing stock to corporate owners, a shift we’ve already started seeing.
To summarize, there’s a good chance we are going to see further stress in the housing market in the near term as the market adjusts to today’s high rates, high prices and potentially job losses next year. But once we are past this rough patch, I think the underlying fundamentals will remain - the demand for housing significantly exceeds supply and this will continue to put upward pressure on prices.
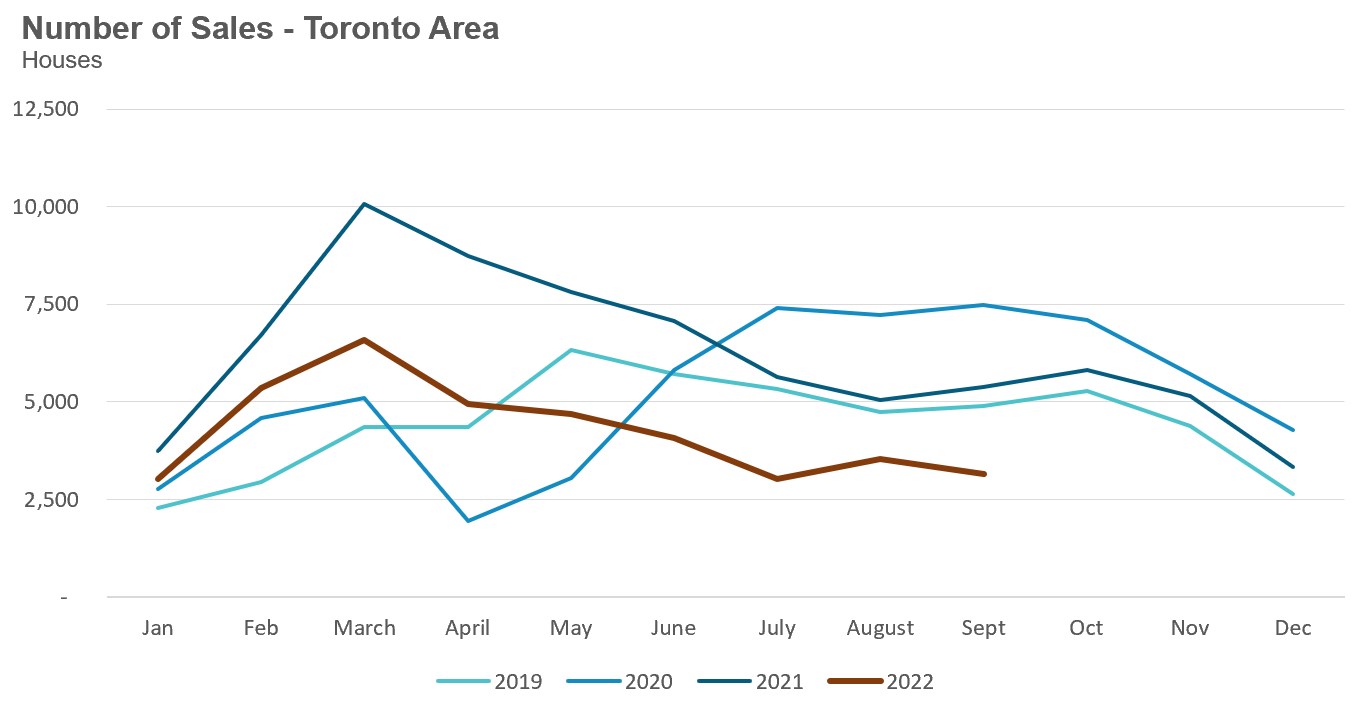
House Statistics
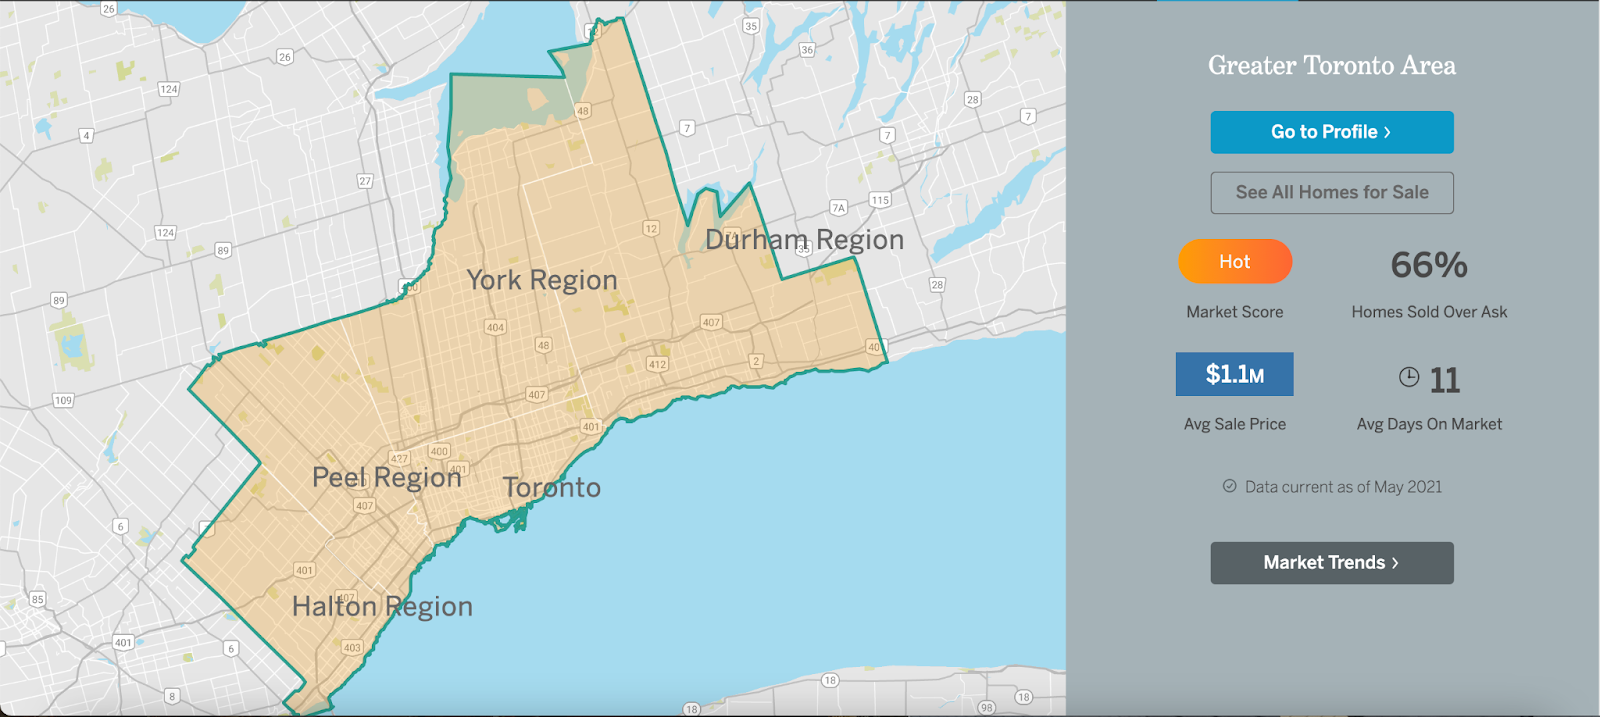
House sales (low-rise detached, semi-detached, townhouse, etc.) in the Greater Toronto Area (GTA) in September 2022 were down 42% over the same month last year and represents a 20-year low for the month of September. Home sales were also down over the previous month, a period when sales are usually up month over month.
New house listings in September were down 16% over last year, and represent a 20-year low for the month of September.
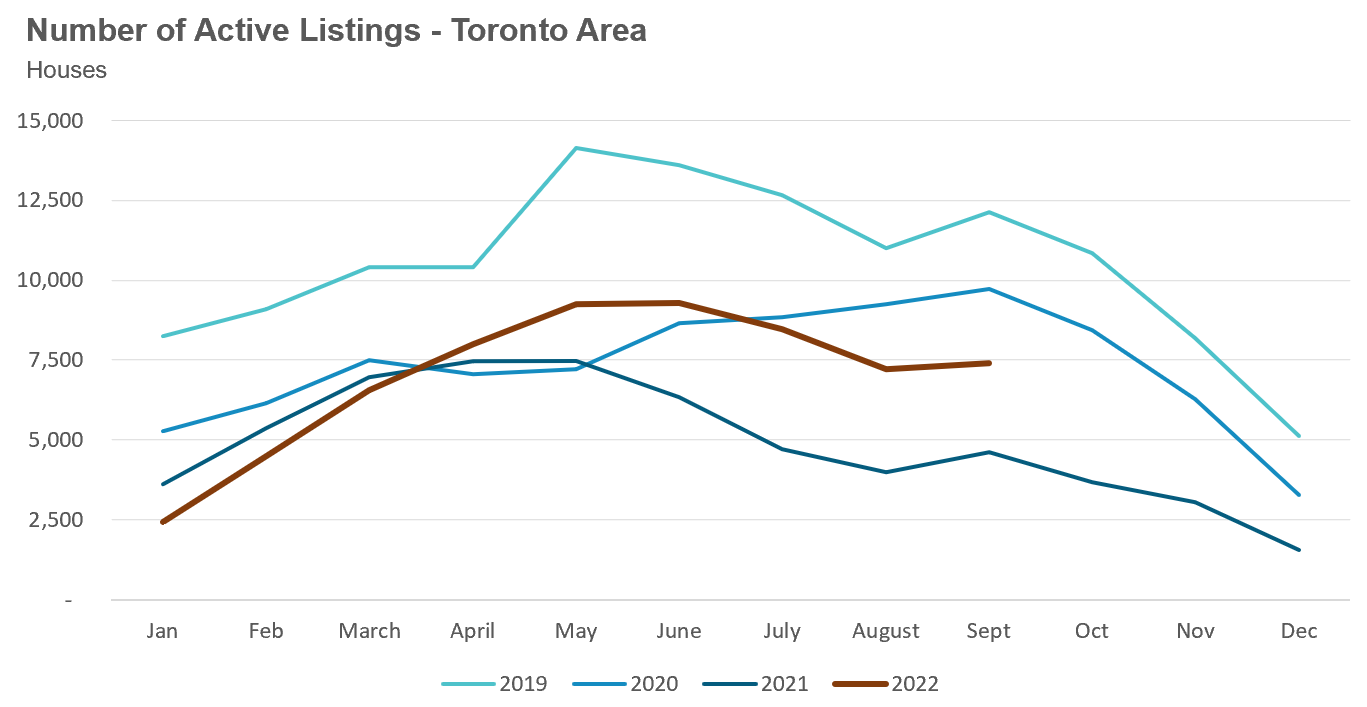
The number of houses available for sale (“active listings”) was up 60% when compared to the same month last year, but still well below pre-COVID levels for the month of September.
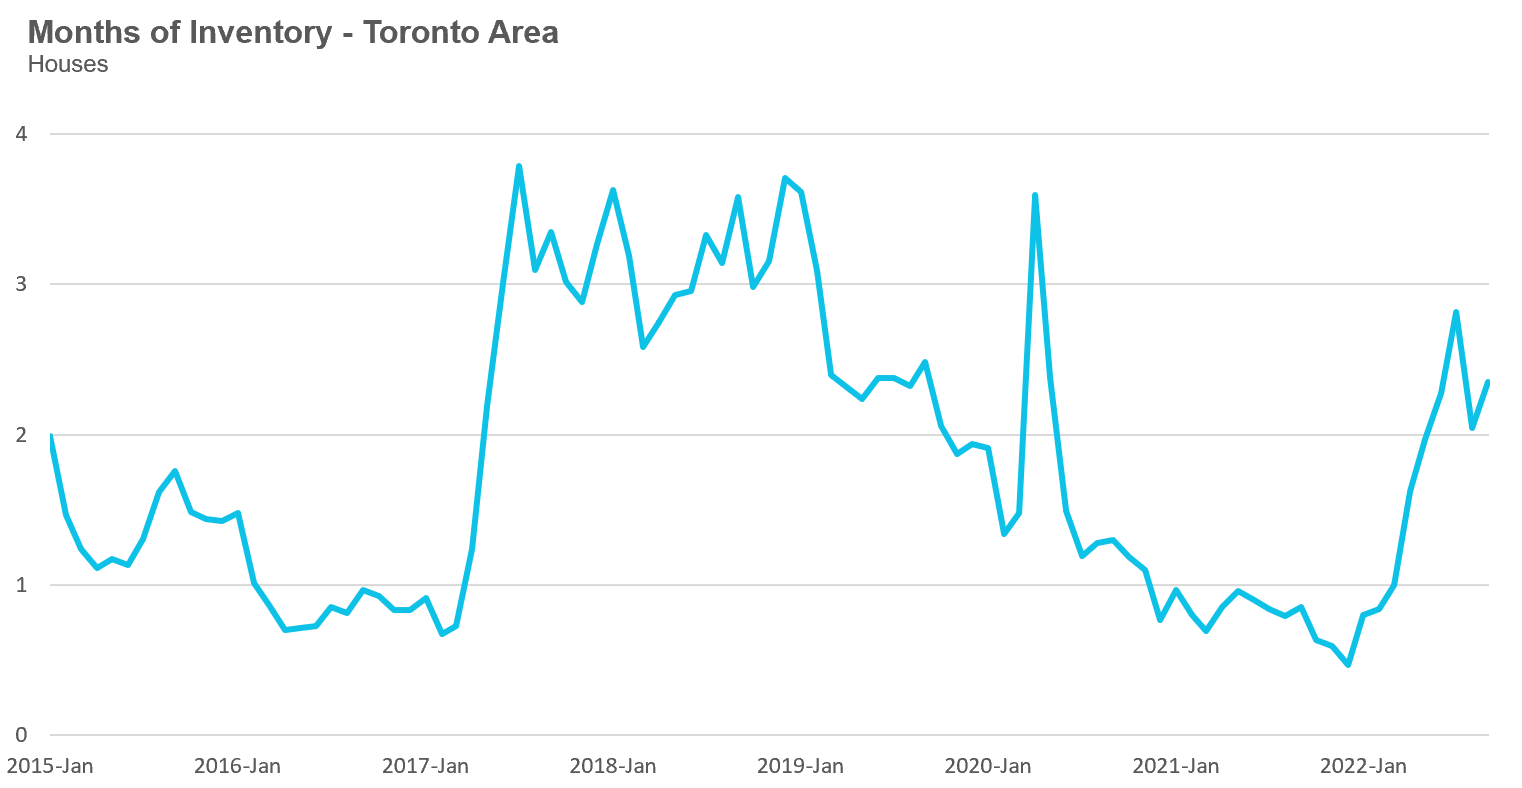
The Months of Inventory ratio (MOI) looks at the number of homes available for sale in a given month divided by the number of homes that sold in that month. It answers the following question: If no more homes came on the market for sale, how long would it take for all the existing homes on the market to sell given the current level of demand?
The higher the MOI, the cooler the market is. A balanced market (a market where prices are neither rising nor falling) is one where MOI is between four to six months. The lower the MOI, the more rapidly we would expect prices to rise.
While the current level of MOI gives us clues into how competitive the market is on-the-ground today, the direction it is moving in also gives us some clues into where the market may be heading.
The MOI for houses increased slightly to 2.3 MOI in September.
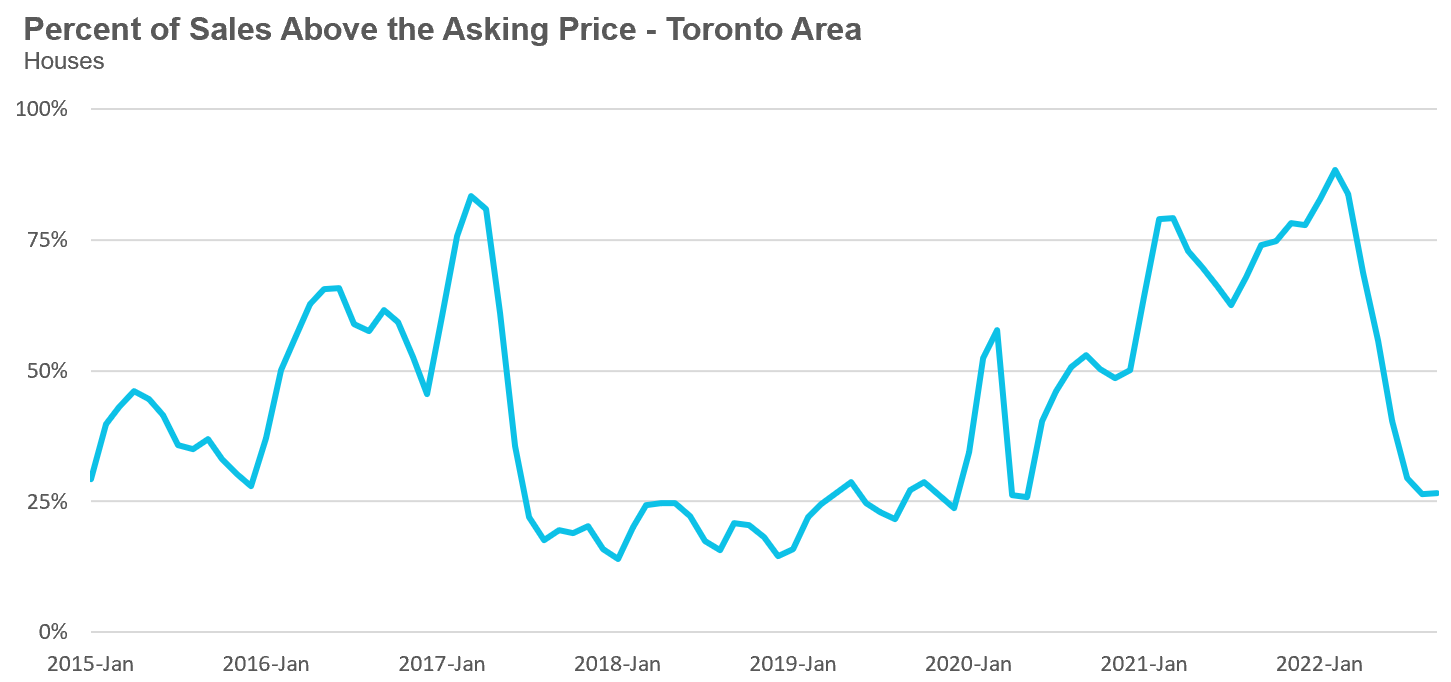
The share of houses selling for more than the owner’s asking price increased slightly to 27% in September.
The average price for a house in September was $1,291,069 in September 2022, well below the peak of $1,679,429 reached in February and down 8% when compared to the same month last year.
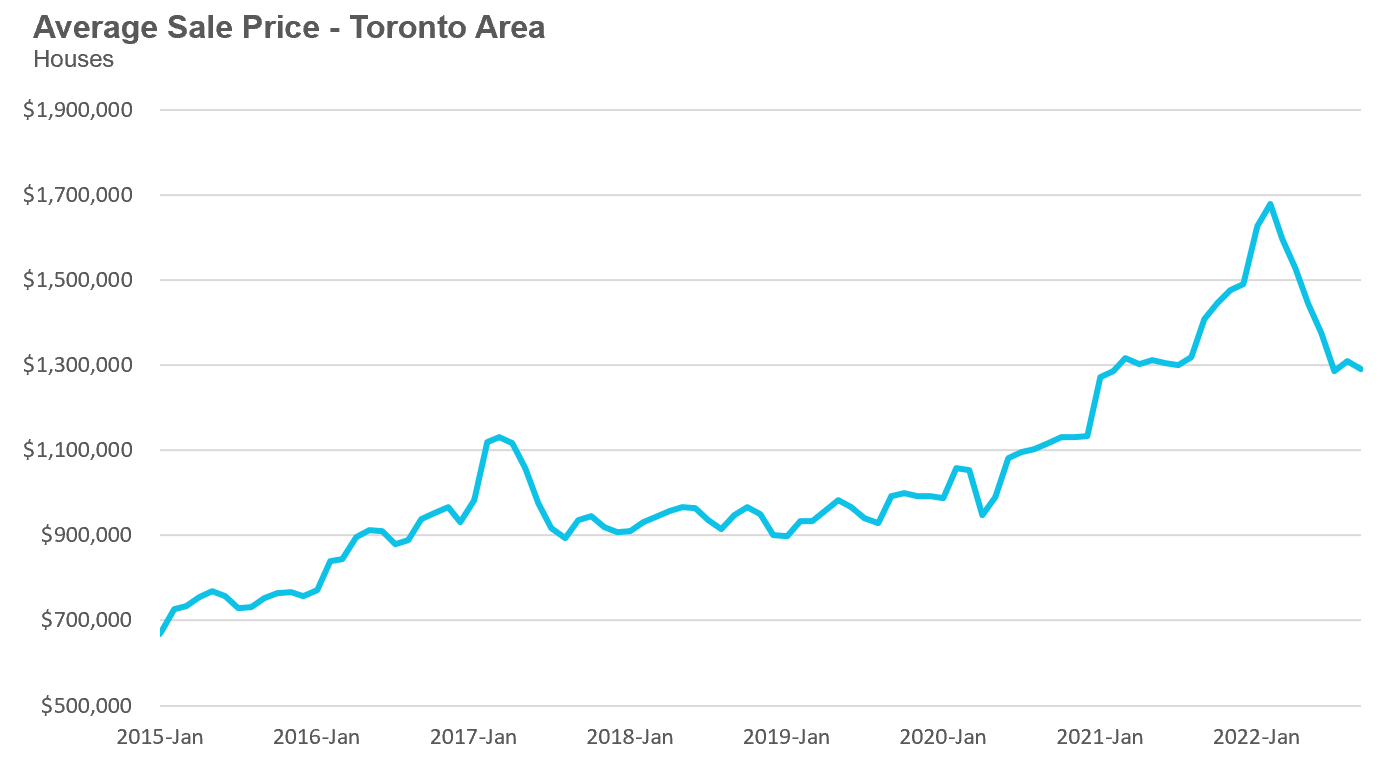
The median house price in September was $1,135,000, down 7% over last year, and below the peak of $1,485,000 reached in February.
The median is calculated by ordering all the sale prices in a given month and then selecting the price that is in the midpoint of that list such that half of all home sales were above that price and half are below that price. Economists often prefer the median price over the average because it is less sensitive to big increases in the sale of high-end or low-end homes in a given month which can skew the average price.
Condo Statistics
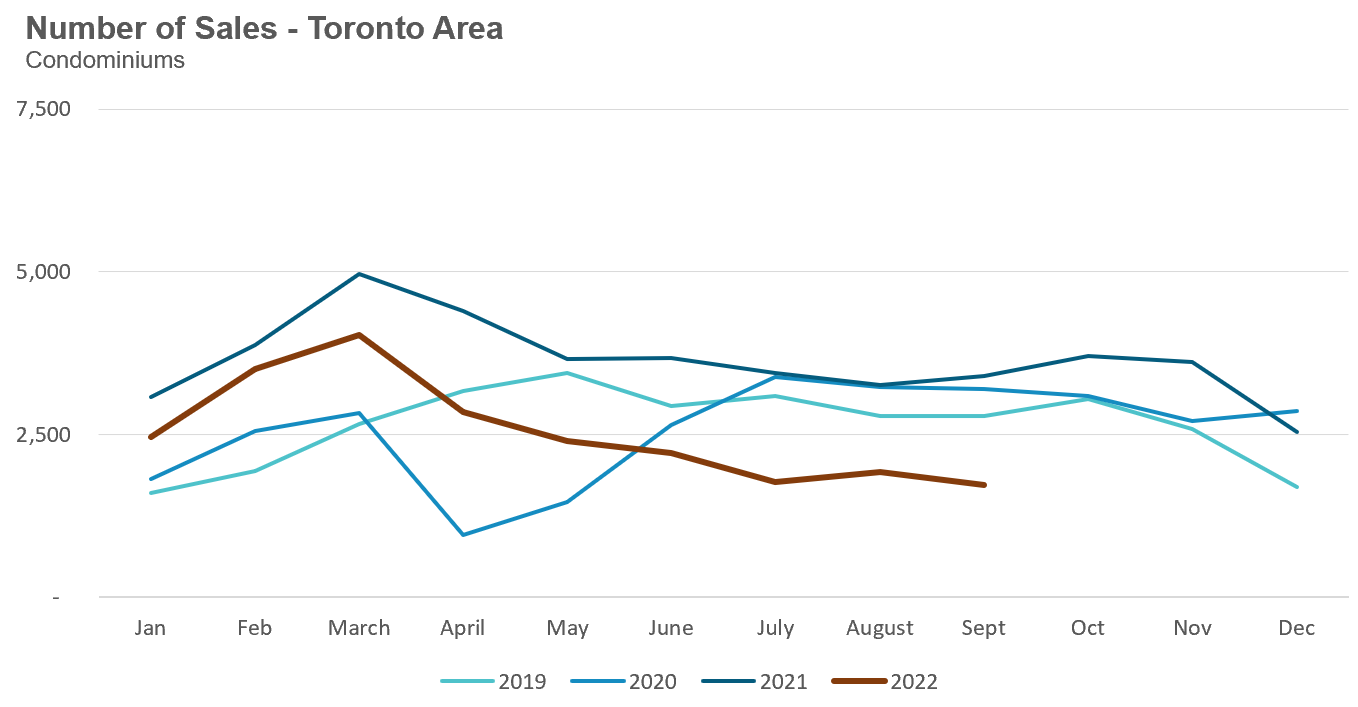
Condo (condominiums, including condo apartments, condo townhouses, etc.) sales in the Toronto area in September 2022 were down 49% over last year and well below pre-COVID sales volumes for the month of September.
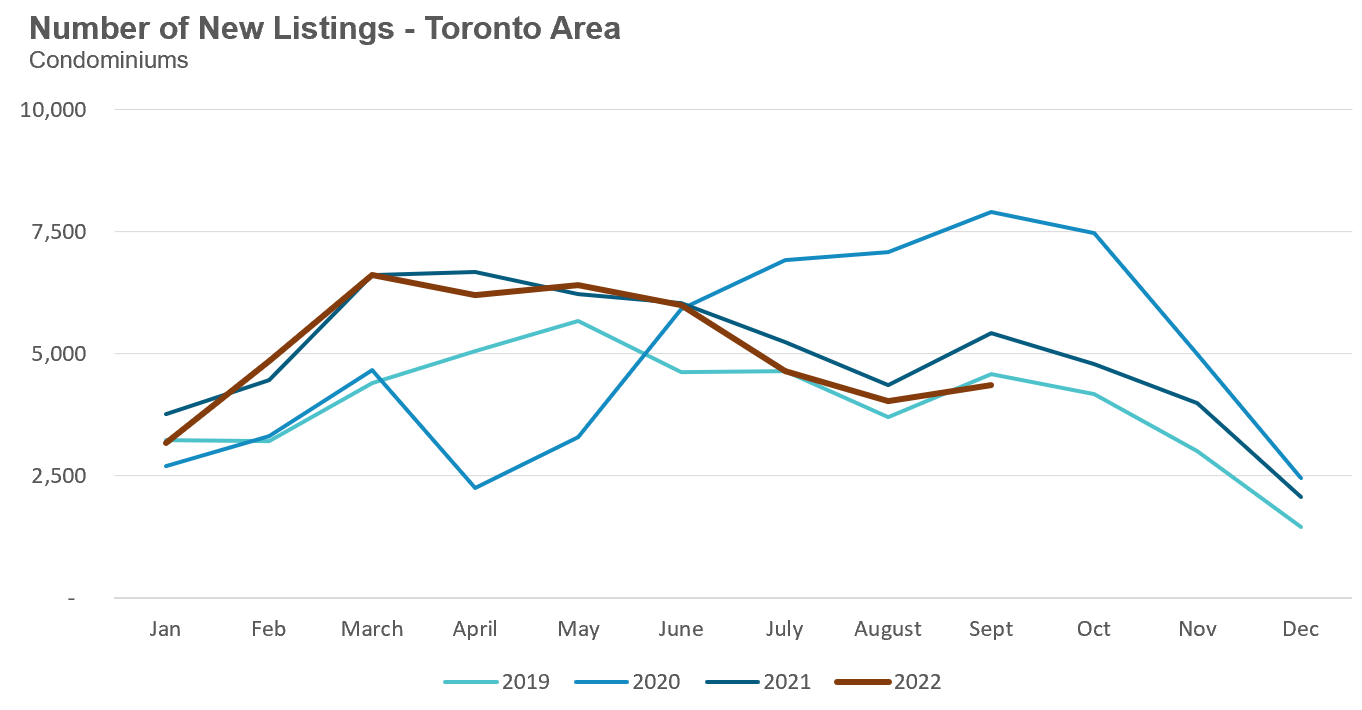
New condo listings were down 20% in September over last year and in line with historical listing volumes for the month of September.
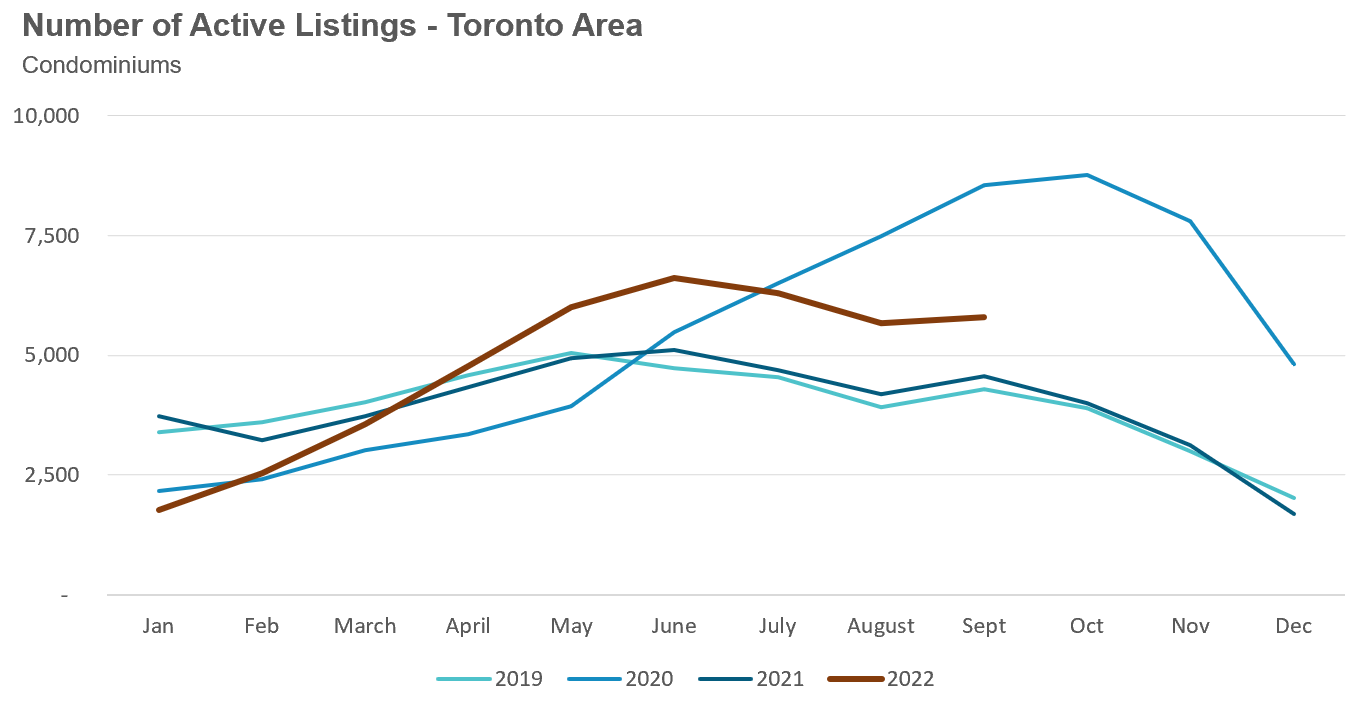
The number of condos available for sale at the end of the month, or active listings, was up 27% over last year.
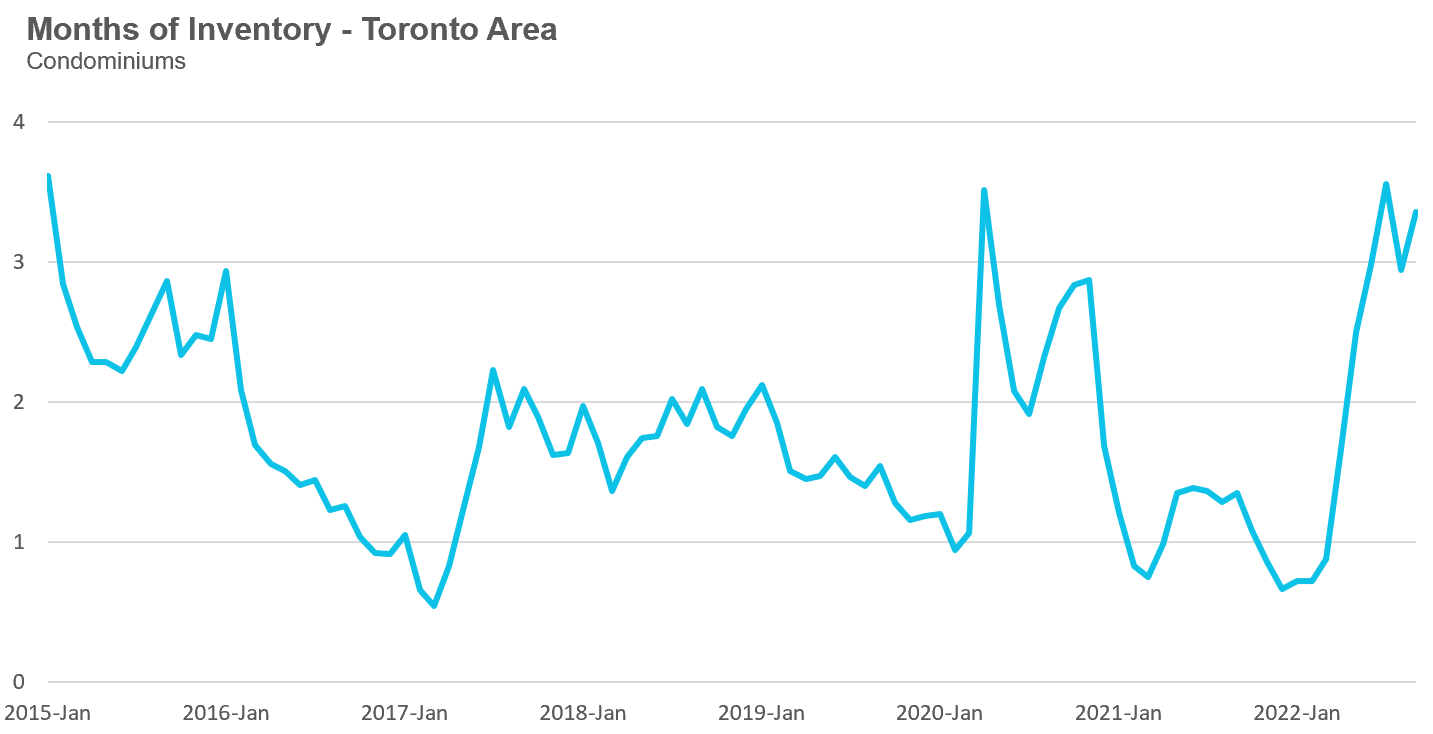
Condo inventory levels increased slightly to 3.3 MOI in September.
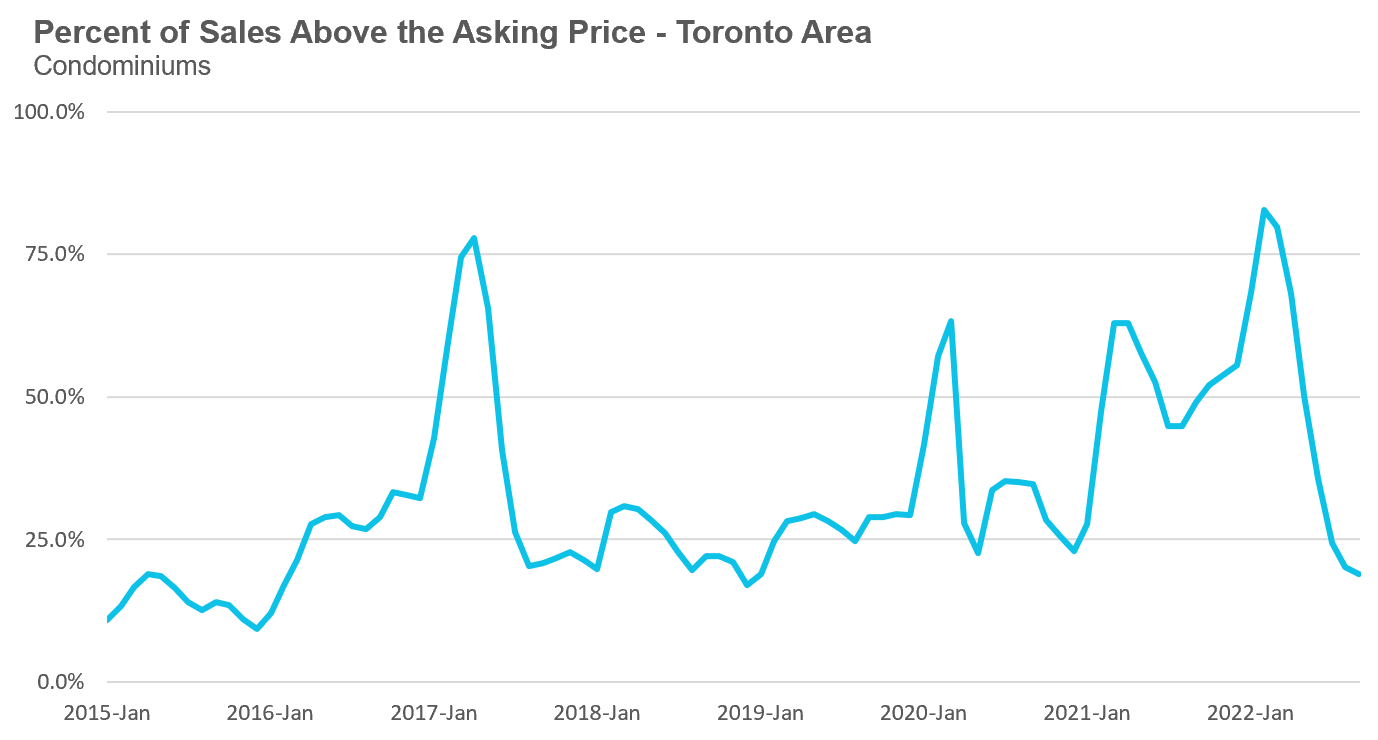
The share of condos selling for over the asking price declined to 19% in September.
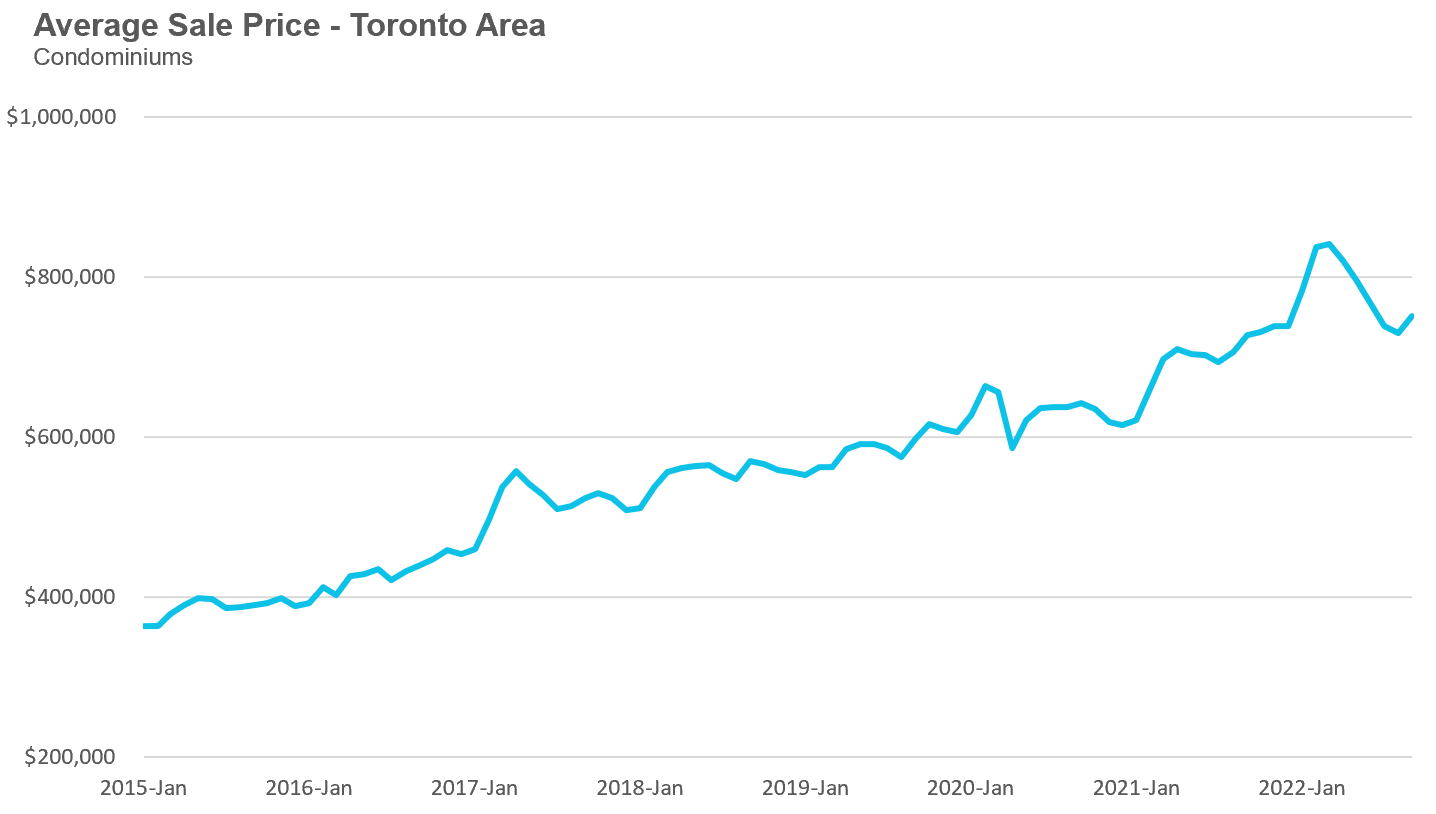
The average price for a condo in September was $750,637, down from the peak of $840,444 in March, but up 3% over last year. The median price for a condo in September was $675,000, up 3% over last year, but down from $777,000, the March peak.
Regional Trends
Houses
Average prices were down over last across all five regions with York Region seeing the biggest decline in prices. Sales were down significantly across all regions and inventory levels were well ahead of last year’s level.
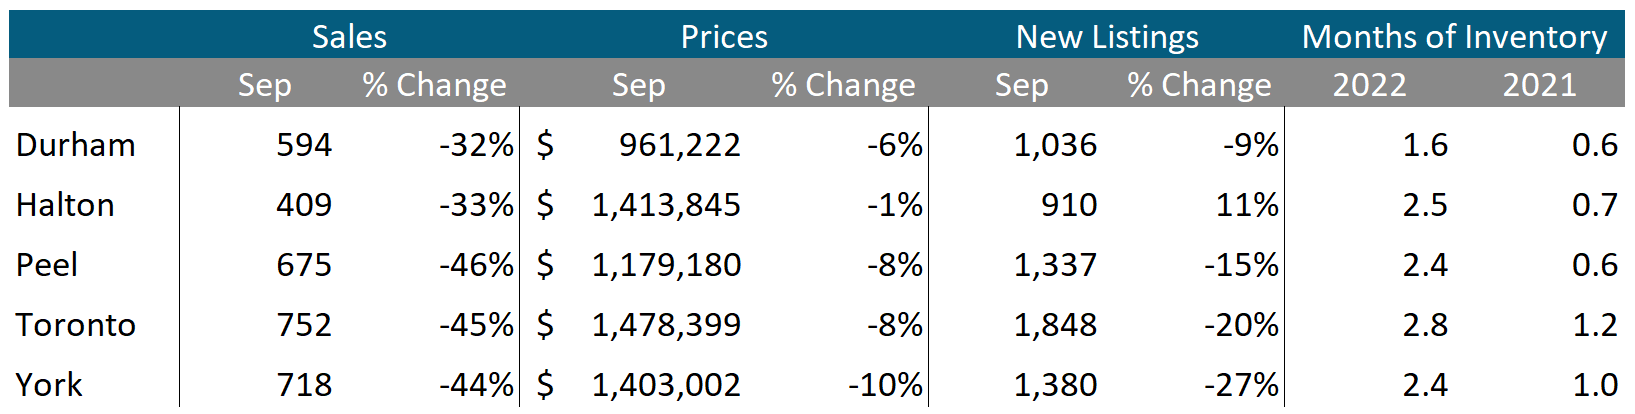
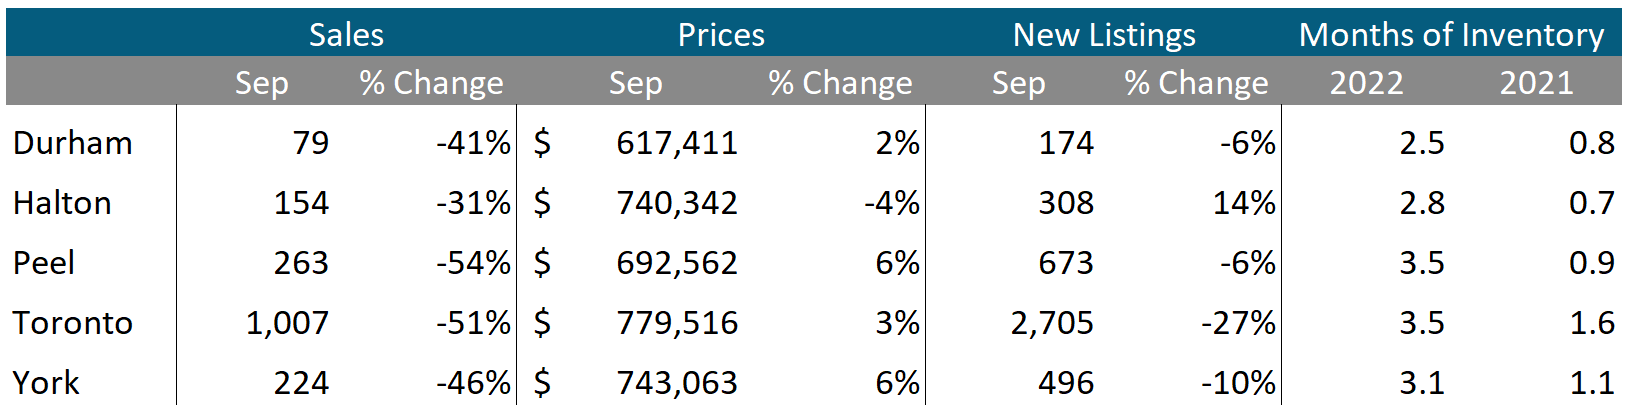
Condos
While condo sales were down across the GTA, average prices continue to be up over last year in Durham, Peel, Toronto and York, but down slightly in Halton region. Sales were down significantly across all regions and inventory levels were well ahead of last year’s level.
See Market Performance by Neighbourhood Map, All Toronto and the GTA
Greater Toronto Area Market Trends
GET MORE DATA
This monthly Move Smartly Toronto Area Real Estate Market Report is powered by Realosophy Realty. Get the same up-to-date Toronto area market data on realosophy.com and additional information on every home for sale, including building permit history, environmental alerts and more when you buy a home with Realosophy Realty.