

Last year, Bank of Canada (BoC) Governor Tiff Macklem encouraged Canadians to go out and take on more debt to help Canada’s economy recover from the impact of COVID-19:
“If you’ve got a mortgage or if you’re considering making a major purchase, or you’re a business and you’re considering making an investment, you can be confident rates will be low for a long time.”
Not only did Governor Macklem get what he asked for, it now appears he may have encouraged significantly more housing debt than he bargained for.
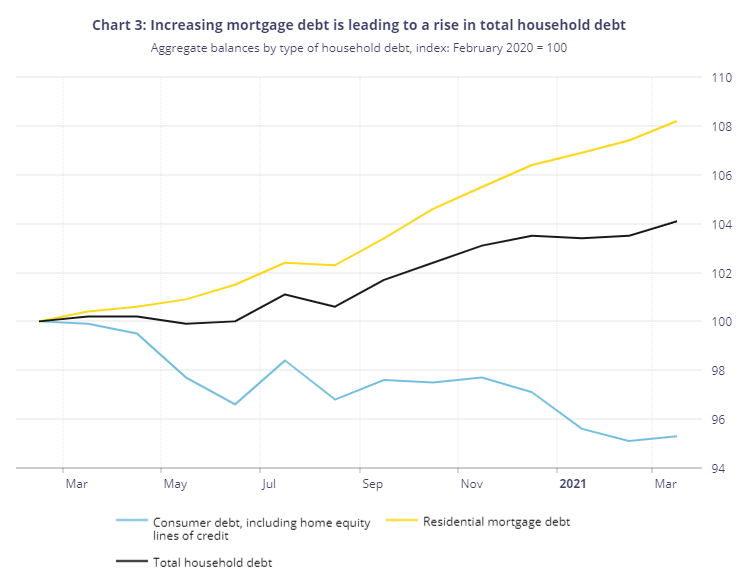
The BoC’s May 2021 Financial System Review (FSR) highlights the top vulnerabilities to Canada’s financial system, the top now being the “Elevated level of household indebtedness” as shown in the chart from their report here:
The BoC is concerned that debt levels are not only rising, but as this next chart shows, that the quality of new mortgages has deteriorated: “The share of newly issued mortgages with a loan-to-income (LTI) ratio above 450 percent rose substantially in the second half of 2020.”
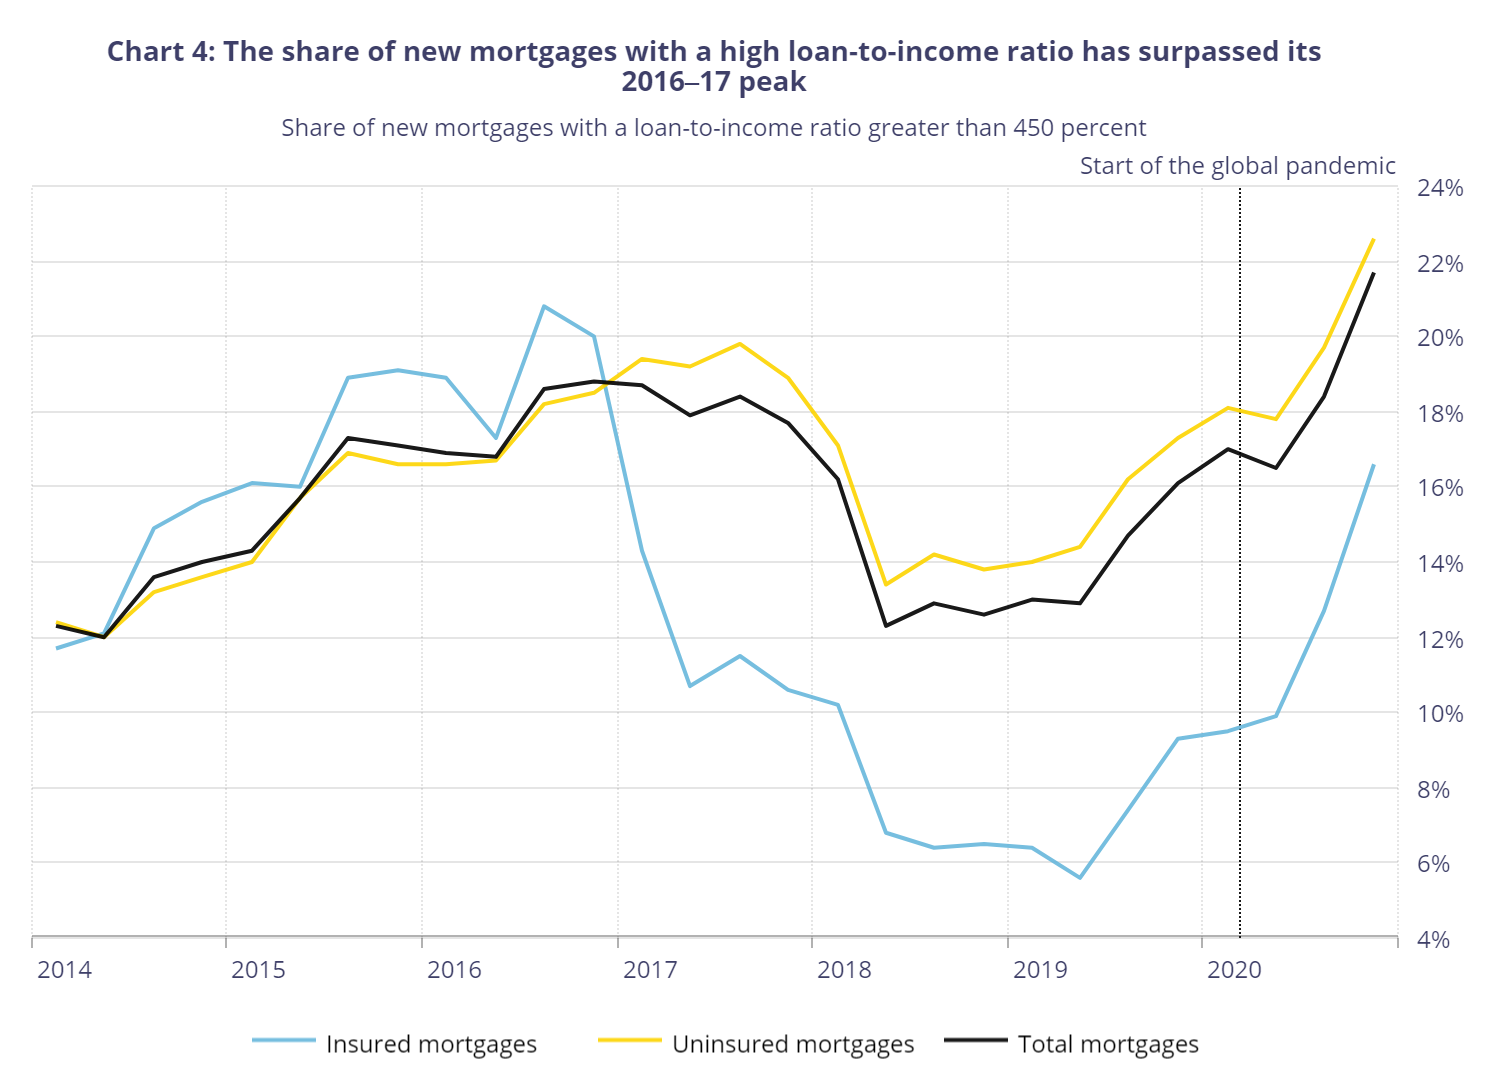
Of course, if too many Canadian households are feeling comfortable taking on higher levels of debt relative to their income, it’s not hard to see that the Bank’s recent policy on — and cheerleading of — lower rates may be one reason why.
The second vulnerability to Canada’s financial system identified in the Review is “imbalances in the housing market.” Here, the BoC is specifically concerned that in some cases house prices are rising simply because people believe they’ll keep rising:
While fundamental factors sparked the rapid rise in house prices, a concern for financial stability is that the increase may also have been driven partly by expectations of future price increases. When house price growth is elevated, some households may be tempted to buy now for fear of higher prices in the future. In such a scenario, housing purchases are made sooner than they normally would, raising demand and prices, particularly when supply cannot keep pace. This dynamic of higher prices then draws more buyers into the market. It can also attract investors looking to buy and then sell a property soon after to make a quick profit, which adds to demand pressures. In this way, expectations of future price increases can become self-fulfilling for a time, further reinforcing the belief that prices will continue to rise in the future.
— Bank of Canada Financial System Review May 2021
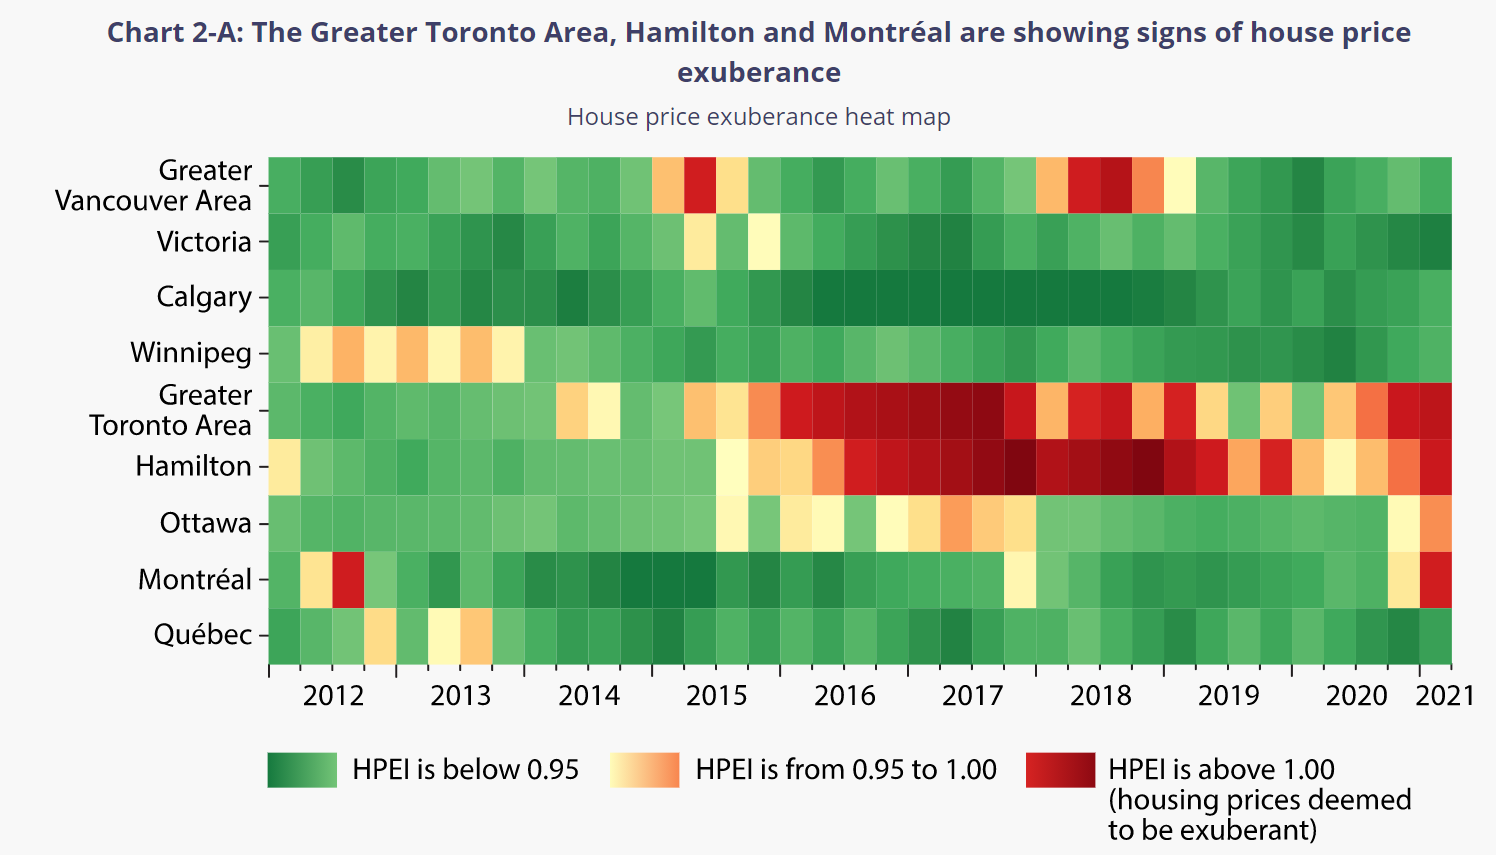
As part of the FSR, the Bank released a new methodology they have developed to help quantify exuberance in housing markets. Their House Price Exuberance Indicator (HPEI) found that Toronto, Hamilton and Montreal were showing signs of exuberance with Ottawa on the cusp of an exuberant market as shown in this chart:
Governor Macklem has changed his tone significantly over the past few months as he now tries to help cool a housing market that has clearly been overstimulated:
“It’s important to understand that the recent rapid increases in home prices are not normal.... Even without a shock, some of the factors that cause prices to rise fast could reverse later and that could leave some households with less equity in their homes.”
— Tiff Macklem
We’ll see if this verbal brake-slam works.
“Are high home prices in the Toronto area a demand or supply side problem?” is an evergreen question that keeps coming up in any discussion about Toronto’s housing affordability problem.
Most economists and housing analysts tend to have a balanced view, arguing that both demand and supply side policies are needed to curb rapidly rising home prices.
But there are always some that will perennially argue that a lack of supply is the only problem behind high home prices in Toronto.
This supply-side bias is most frequently evidenced by the real estate and building industries who tend to always fight any restrictions on the demand side, such as the introduction of foreign buyer taxes or the tightening of mortgage rules. And now it seems that some bankers are joining the supply side.
In a recent economic note, Scotiabank joined realtors and builders by arguing that a shortage of supply is the only problem leading to rising house prices and deteriorating affordability.
I’ll unpack some of the challenges with the arguments made by those insisting on a one-sided solution to a very complex policy problem.
Is Supply the Only Problem?
“[T]he fact remains that the principal challenge facing the housing market—and the underlying cause for rising prices and diminished affordability—is the substantial insufficiency of supply relative to demand.”
— Estimating the Structural Housing Shortage in Canada, Scotiabank
While it’s less surprising to hear a one-note answer from the real estate and building industries, whose outlook is coloured by the needs of their industries, Scotiabank’s rather bold position on supply is surprising for bank economists.
For an economist to say that X causes Y, they need to show more than a relationship between two variables. They need to prove that all the other factors that could lead to higher home prices (low interest rates, booming immigration etc.) had little to no impact on prices. The bar one must meet to prove causality is quite high which is why most economists rarely argue a casual relationship as Scotiabank is doing here.
Scotiabank’s report observed that the number of housing units per 1,000 residents in Canada is lower than any other G7 country and has been falling since 2016. But Canada also saw a sharp boom in population since 2015 — which is touched upon, but not properly examined by showing that the cause for rising prices and diminished affordability is the “insufficiency of supply” versus the demand shock caused by a population boom.
Most balanced economists would argue that the boom in home prices since 2015 was driven by both demand side factors like the surge in population coupled with housing supply that couldn’t keep up with the increase in demand.
Just why is this distinction so important?
Of the two factors, the one that policy makers have far more direct and immediate control over, particularly at the federal level, are immigration numbers, not housing supply.
Equally surprising is Scotiabank’s argument that macroprudential policies like ‘mortgage stress test’, which makes it harder for buyers to qualify for loans, are “ineffective band-aids.”
The mortgage stress tests are not policy measures primarily aimed at cooling the housing market, but rather at reducing the economic risks associated with heavily indebted households as highlighted in the Bank of Canada’s most recent Financial System Review (see above section). Without such measures, household debt would be significantly higher as would be the share of mortgages with a high loan-to-income ratio, running the risk of greater economic fallout in the event of an economic downturn.
Dampening demand for housing is only a side-effect of such measures.
Better Understanding the Supply Problem in Toronto
Almost all ‘supplyists’ argue, like Scotiabank, that “the main impediments to supply growth are in planning and approval processes.” This theory cites policies, mostly at the provincial and municipal level, that limit home builders in being able to do more of what they are already doing, only faster and with lower costs.
But this approach ignores two key problems in reality.
The first is that supplyists tend to insist that building more units of housing — regardless of the type of housing being built — is key. To them, a housing completion is a housing completion, regardless if it’s a 400 sq ft studio condo or a 2,000 sq ft house. Indeed, the Scotiabank report makes no distinction between the two.
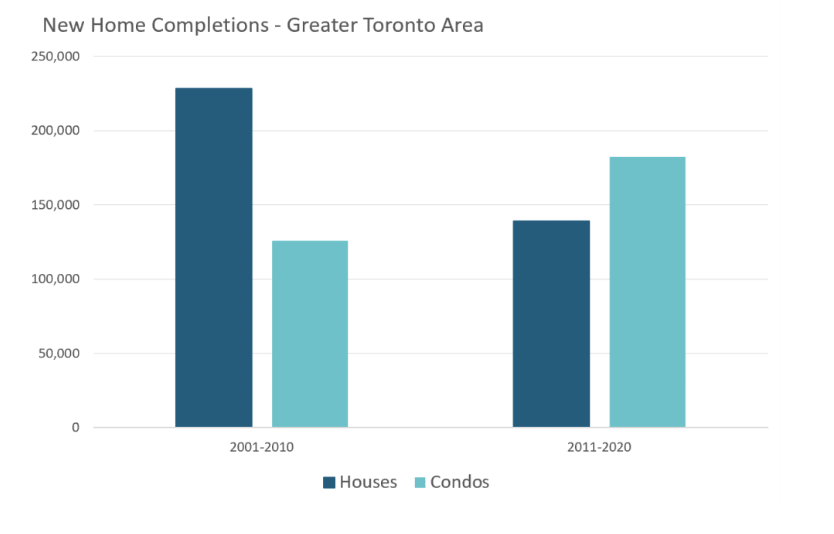
To get a better understanding of what types of homes are being built (at the expense of others), we simply have to look at the number of house and condo completions over the past 20 years. 90,000 fewer houses between 2011-2020 were built in the Toronto area when compared against the first ten years of the 2000s, a shortfall that has mostly been made up by the building of condos.
In the meantime, the segment of the market that has seen the most rapid acceleration in prices has been houses.
Our federal government plans to increase immigration targets to support the country’s economic recovery post-pandemic — but how do policymakers plan to house all of these new immigrants? By building an ever increasing number of 600 sq ft condominiums favoured by investors and proportionately fewer family-sized houses each year?
Continuing this current building trend — just faster and with more efficient approvals — isn’t likely to solve Toronto’s affordability problems.
The other problem with the supplyist’s argument — that if Toronto's new housing supply was more elastic (i.e., able to be increased rapidly in response to demand), home prices wouldn’t rise as rapidly — is the flip-side of their incorrect tendency to see all supply as being the same, which is to see all demand as being the same.
This assumption hasn’t held up well historically when new supply of housing is largely bought by investors — and not end-users (i.e., buyers who want to live in the homes, not rent them out or hold on vacant properties for their economic value). The housing markets in Phoenix, Las Vegas and Dubai all have a relatively elastic supply of new housing, but that didn’t stop them from experiencing significant housing bubbles — and a decline in affordability — in the years leading up to the financial crisis of 2008 and significant housing corrections — and economic harm to households — after the bubbles burst.
These markets all have one thing in common with Toronto’s condo market today — the vast majority of their new housing supply was bought by investors, not end-users. When new housing supply is driven almost entirely by investors it can lead to a number of potential risks that tend to undermine overall housing affordability and the economic health of end-users who are already in the market.
First, investors are more prone to base their decisions on extrapolative expectations — the belief that prices can only go up forever because there’s not enough supply and are willing to pay significantly more than end-users. This is partly why pre-construction condominiums in Toronto sell for much more than resale condos. According to Toronto area condominium research firm Urbanation, during the first quarter of 2021, pre-construction condos in Toronto sold for an average price of $1,416 per square foot, compared to just over $1,000 for resale condominiums, a segment which is more heavily dominated by end-users.
Second, when investors drive new housing supply, it leads to the risk of overbuilding the type of property that investors are buying. Might we find ourselves with more 500-600 sq ft condominiums than we need five years from now? Possibly. And any resulting listings glut from that overbuild would potentially impact not only end-users who own those same types of units, but potentially other segments of the market, as many who invest in such units also tend to own other properties which they may not be able to hold onto as they come under financial pressure.
When thinking about demand for new housing supply, it’s also important to consider how many new homes are intended for renters versus owner-occupiers.
The Canadian Mortgage and Housing Corporation (CMHC) tracks purpose-built rental completions (i.e., units that are exclusively intended to be rentals, as opposed to house and condo units which may be lived in by owners or rented out) separately, and over the past twenty years they have made up roughly 5% of all completions.
But this, of course, does not represent all of the properties that are intended to be used as rentals since the majority of condominiums bought pre-construction end up being used as rental properties, as CMHC observes:
The share of newly completed units added to the condominium universe and leased was almost 57% — above the average 50% that has been the case over the past 5-years.
— CMHC Rental Market Report, January 2021
As the share of condominium completions increased over the past ten years, the share of new housing completions bought by investors and used as rentals has increased while the share of homes intended to be lived in by end-user owner-occupiers has declined.
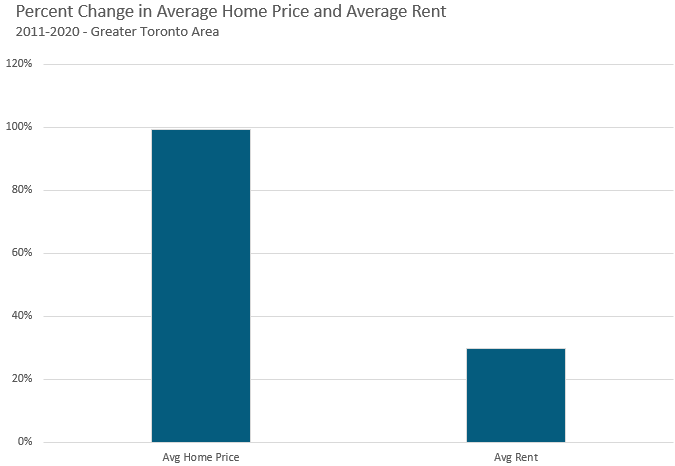
This expansion in investor-financed rental units over end-use units largely explains why over the past ten years, home prices have doubled while average rents are only up 30%.
If policy makers aim to fill the housing supply gap by increasing the number of condominium completions in the future, the end result will be the same result we’ve seen over the previous ten years. Rapidly rising home prices and modest growth in rents since more and more completions will be used as rental properties versus owner-occupied homes.
Given this, an important part of fixing the so-called “supply side” issue is thinking about how to move more of our supply into the hands of end-users rather than domestic and international investors, thereby slowing down the financialization of housing.
We Need Bold Demand and Supply Side Policies
Despite Scotiabank’s assertions that there is one cause for high home prices, there is never one single reason for elevated house prices and deteriorating affordability.
High home prices are a product of both supply and demand side factors and policies.
On the demand side, there are plenty of undesirable outcomes — too many investors (both domestic and foreign) buying up new condos strictly for the expected capital gain, speculators flipping properties quickly for short-term gains and global investors using Canadian homes as vacant safety deposit boxes to safely store their capital are all uses that should be curbed using demand-side policies.
The supplyists who argue against curbing these types of behaviours either believe that this type of greed in housing markets is good, or that these types of behaviours aren’t actually happening and that greed doesn’t exist.
Unlike demand side policies which tend to have an immediate impact on the market, trying to solve affordability problems via supply side policies is a very long-term approach that is far less certain. This doesn’t mean policy makers should not be trying to reduce the many barriers to allowing for new housing supply, but doing nothing on the demand side now is not a bet policy makers should be making.
As a start, our federal government's decision to raise immigration targets today without making the corresponding supply-side housing policy changes needed to increase supply is a decision to inflate home prices out of reach of most Canadians tomorrow — including many of our newest fellow citizens. Going forward, immigration targets need to line up with bold housing policy to avoid a rapid acceleration in house prices that hurts affordability and the viability of our society as a well-functioning whole.
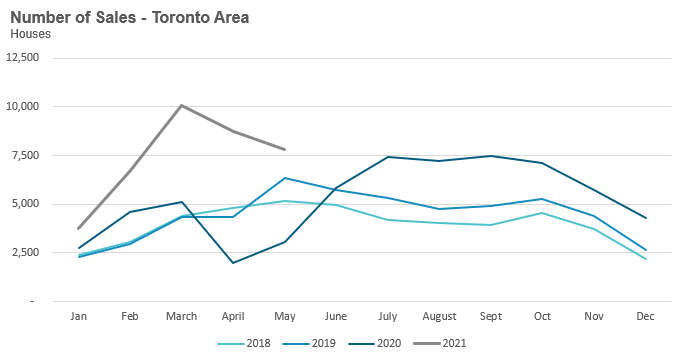
House sales (detached, semi-detached, townhouse, etc.) in the Toronto area in May 2021 were up 157% over the same month last year. Year-over-year comparisons don’t tell us much since we are comparing today’s market against the second month of Ontario’s first COVID-19 lockdown that saw the real estate market freeze overnight.
The more interesting trend we have been seeing is a month-over-month decline in home sales since the peak reached in March. March to May is typically a period when home sales are increasing from one month to the next, but the effects that COVID-19 has had on the real estate market continues to distort the traditional seasonal trends in the market.
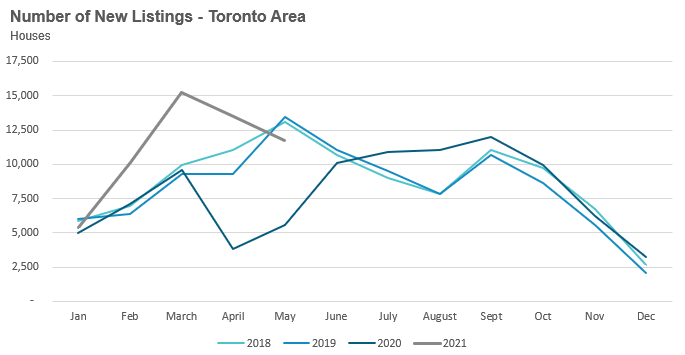
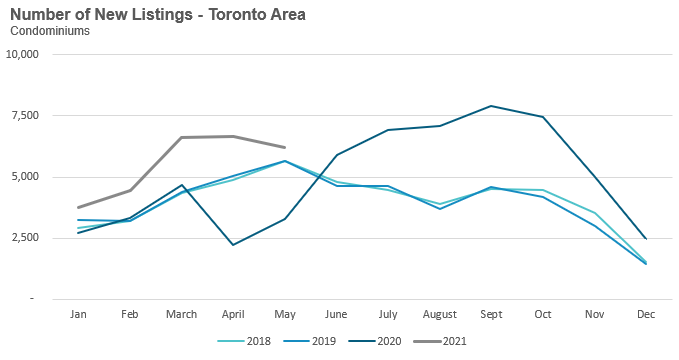
New listings in May were up 110% over last year, but much like the sales numbers, new listings are also showing a month-over-month decline since March.
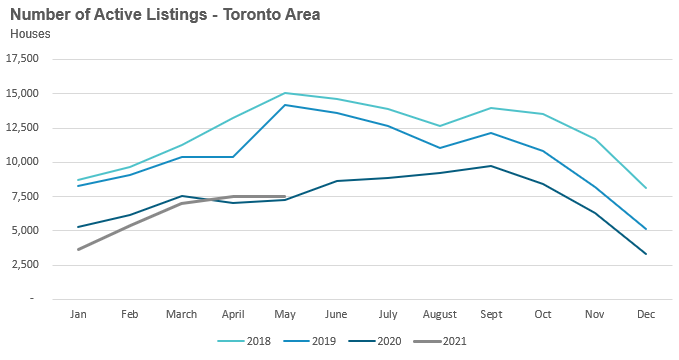
The number of houses available for sale (“active listings”) was up 4% when compared to the same month last year.
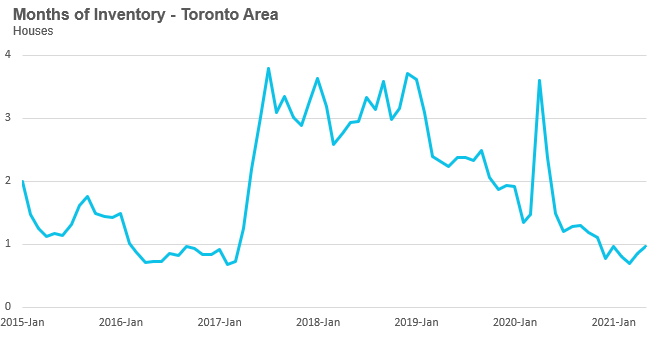
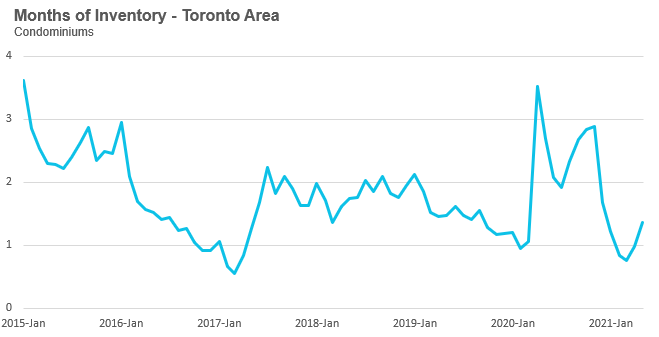
The Months of Inventory ratio (MOI) looks at the number of homes available for sale in a given month divided by the number of homes that sold in that month. It answers the following question: If no more homes came on the market for sale, how long would it take for all the existing homes on the market to sell given the current level of demand?
The higher the MOI, the cooler the market is. A balanced market (a market where prices are neither rising nor falling) is one where MOI is between four to six months. The lower the MOI, the more rapidly we would expect prices to rise.
This May, the market remained very competitive with an MOI of 1.
While the current level of MOI gives us clues into how competitive the market is on the ground today, the direction it is moving in also gives us some clues into where the market may be heading. The MOI has remained relatively stable at or below 1 MOI for the past six months.
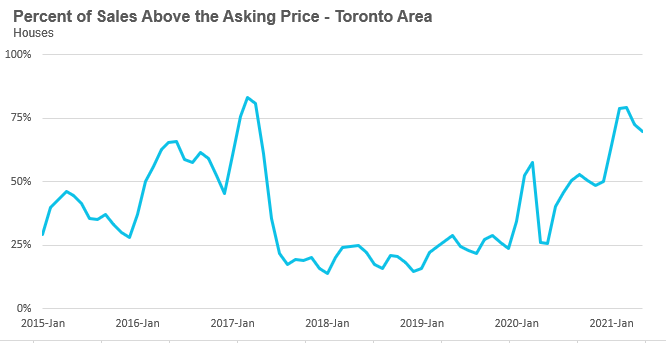
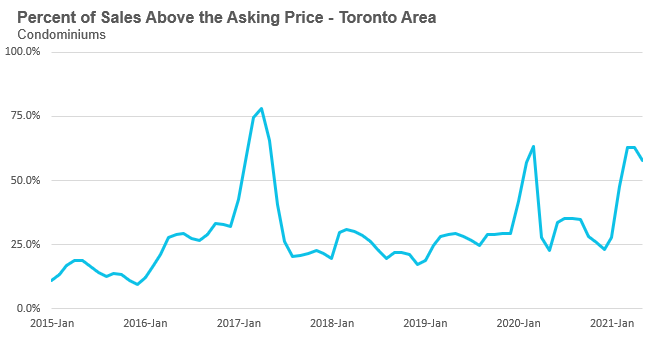
The share of houses selling for more than the owner’s asking price dropped from 79% to 70% in May. While this figure still suggests a very hot and competitive market, we are finding at our brokerage, Realosophy Realty, that the number of offers that houses are receiving on their offer nights has declined significantly, and that in many cases houses may only get one offer. In cases like these, a house priced lower to encourage multiple offers will still likely sell for more than the owner’s asking price because the buyer knows that the asking price does not reflect the actual market value of the house.
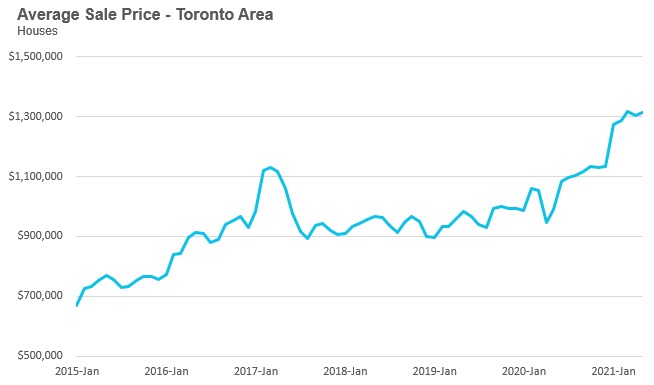
The average house price in May was $1,312,334 while the median was $1,140,000, up 32% and 33% respectively over last year.
While average house prices are up significantly over last year, house prices have plateaued in 2021 with average prices remaining relatively constant in the $1.3M range since the start of the year.
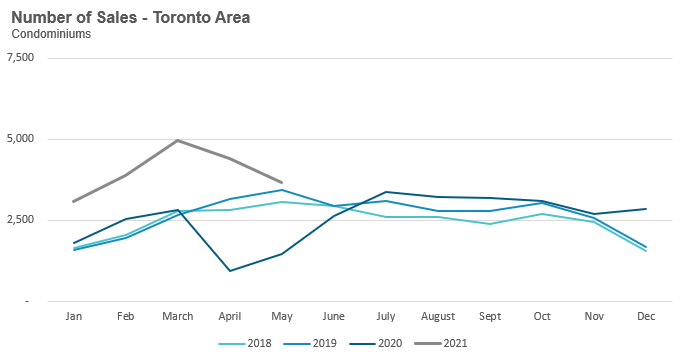
Condominium (condo) sales (condo apartments, condo townhouses, etc.) in May were up by 151% over last year, but much like house sales, are seeing sales decline since reaching a peak in March.
New condo listings were up by 89% in May 2021 over last year. The number of condos available for sale at the end of the month, or active listings, was up 26% over last year.
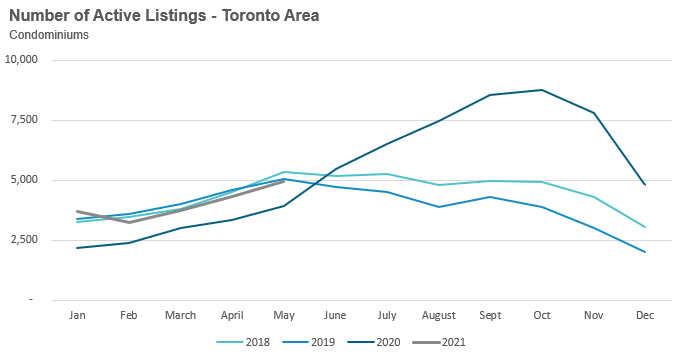
The decline in sales (demand) and strong number of new listings (supply) pushed the MOI up to 1.4 for the month of May.
The competition for condos is easing slightly with the share of condos selling for over the asking price falling from 63% in April to 58% in May.
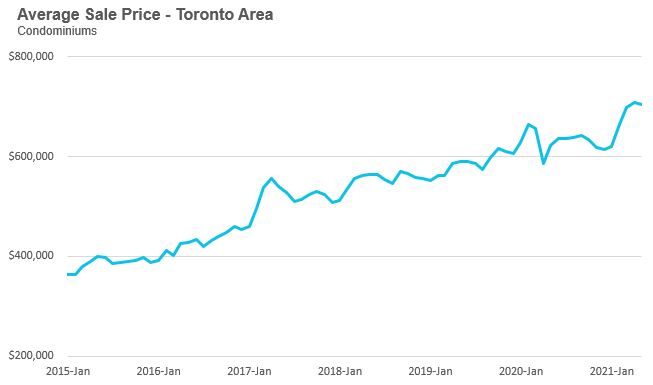
The average condo price in May was $703,782 while the median was $642,000 which were both up 13% over last year.
Average condo prices were in the low $600K range during the fourth quarter of 2020 and after a rapid acceleration during the first quarter of 2021 to approximately $700K, now appear to be plateauing.
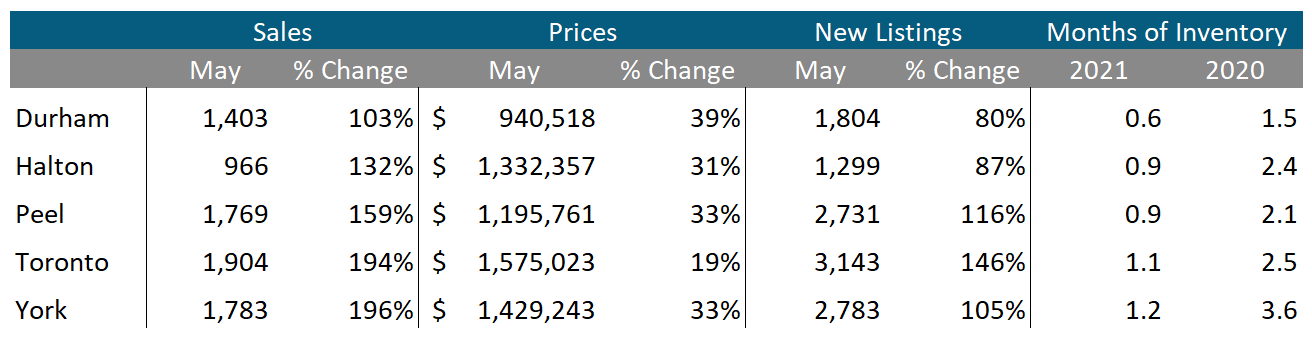
Sales across all five regions in the GTA were up significantly in May as were average prices. Despite the increase in new listings, MOI is at 1 or below 1 across the entire GTA, indicating a strong market.
Condos
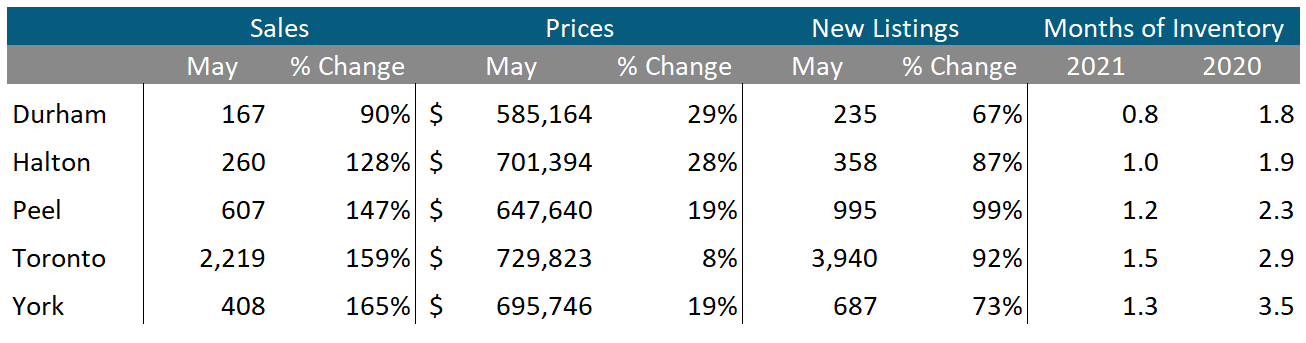
The surge in condos sales continued in May across the entire GTA. Average prices were up across the suburban regions, along with the City of Toronto. Also indicative of strong market conditions, current MOI levels are below last year’s levels for all five regions.
Greater Toronto Area Market Trends
All Market Performance by Neighbourhood Map, Toronto and the GTA
All above live data also available on realosophy.com
More Data for Realosophy Clients
Realosophy clients can access the same information above plus additional information on every home for sale, including building permit history, environmental alerts and more. Visit Realosophy Buyer Service or contact your Realosophy agent for more details on activating your Realosophy.com PRO account.