
Signs that the market is still moving quickly, but not as out-of-control as it was months ago.
Read the Latest on the Market Now:

Want to hear more? Join author John Pasalis each month for a free public webinar on the latest data & insights on the market now. Learn more
Anyone following the latest headlines about Toronto’s housing market, and my own updates on Twitter, has by now heard that Toronto’s housing market is showing signs of cooling. But I appreciate that these types of headlines can leave many buyers confused about what “cooling” really means.
Active buyers who are still seeing 10+ offers on the homes they are bidding on are certainly not feeling any ‘cooling’. Buyers considering entering the market are wondering if a cooling market means prices will fall in the near future, like right after they’ve bought (i.e., the dreaded ‘buying at the peak’ problem).
The best way to make sense of this cooling trend is to think of the housing market as a car that was driving at over 200 km/h in March, but has now decelerated to a more reasonable 120 km/h in June. The market is still moving quickly, but not as out-of-control as it was months ago.
We can see these changes by looking at changes in a couple of metrics between March and June.
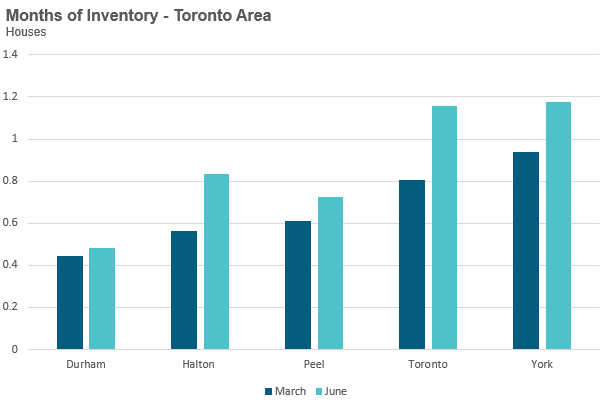
The months of inventory (MOI) gives us a good measure of how hot the market is at any given point in time - the lower the inventory the hotter the market.
An MOI between 4-6 months is generally considered a “balanced market” with anything below 3, a hot seller’s market.
MOI for houses was below 1 month for all five municipalities in March, a sign of an overheating housing market. Inventory levels have increased slightly since then, but still remain in seller’s market territory.
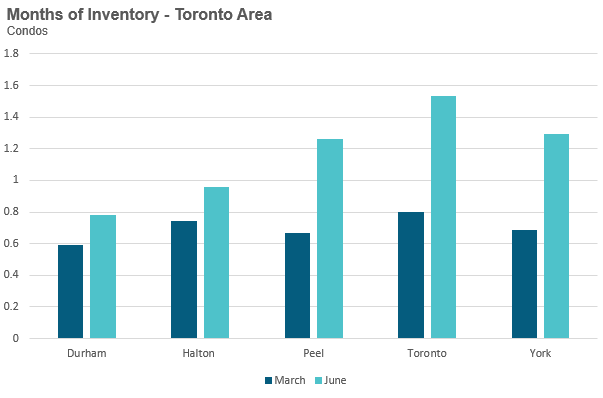
 Next, we can see a bigger shift in the MOI between March and June in the condo market, in particular in Peel, Toronto and York Region.
While the GTA’s housing market is still in seller’s market territory, this slight increase in inventory since March has taken some of the heat out of the market. Houses and condos for sale are seeing fewer showings and fewer offers on their offer nights. We are also seeing a decline in the number of homes selling for more than the owner’s asking price in both segments.
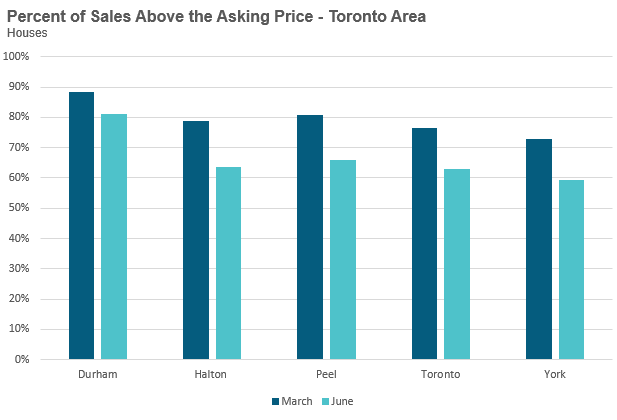
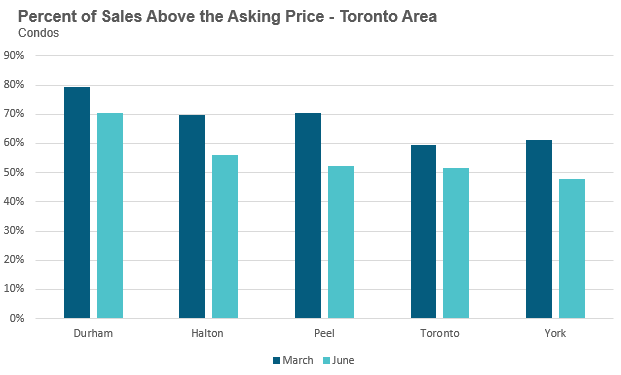
A decline in the number of homes selling for over the asking price means an increase in those selling for under the seller’s list price, bringing the average down. We are also seeing an increase in the number of homes selling with a condition on financing or home inspection, something that was rare back in March.
This cooling trend we are seeing today is a seasonal trend we typically see as we move into the summer months of July and August. The market usually cools in the summer as many active buyers hit pause on their search to take a summer break. Many of these buyers jump back into their home search in September.
What the fall market will look like will largely depend on how many new buyers enter the market and the volume of homes listed for sale. While it’s impossible to predict these trends, my instinct is that we’re likely to see the market continue to moderate for the remainder of the year.
The Move Smartly Monthly Toronto Area Market Report is powered Realosophy Realty Inc. Brokerage, a residential real estate brokerage serving Toronto and the GTA. A leader in real estate analytics, Realosophy educates consumers at Realosophy.com and MoveSmartly.com and helps clients make better decisions when buying and selling a home.
Email report author John Pasalis, Realosophy President
Published: July 27, 2021


