A deep data dive takes us past some familiar complaints to find the real reasons our supply of homes can't meet demand.
It has long been argued by many housing analysts and economists that the current price acceleration trends we are seeing in the housing market in the Toronto area are entirely due to a “lack of supply” and that the cause of this lack of supply is municipal and provincial constraints on zoning (see my discussion on this earlier in this report) and “red tape” which slows down the construction of new housing.
While more could be done to remove some supply side constraints (as discussed above), blaming supply tends to be a perennial “one size fits all” solution.
A recent data trend illustrates why this one-note explanation risks us missing out on other — equally noteworthy — explanations for what is going on in the market.
The first problem is a tendency to ignore demand-side explanations.
Under the current Liberal government, which first came to power in 2015, Canada has seen a super-charged number of immigrants and non-permanent residents moving to Canada from roughly 300,000 per year to as much as 500,000 just preceding the Covid-19 pandemic (which resulted in a sharp drop in these numbers due to international travel and border restrictions).
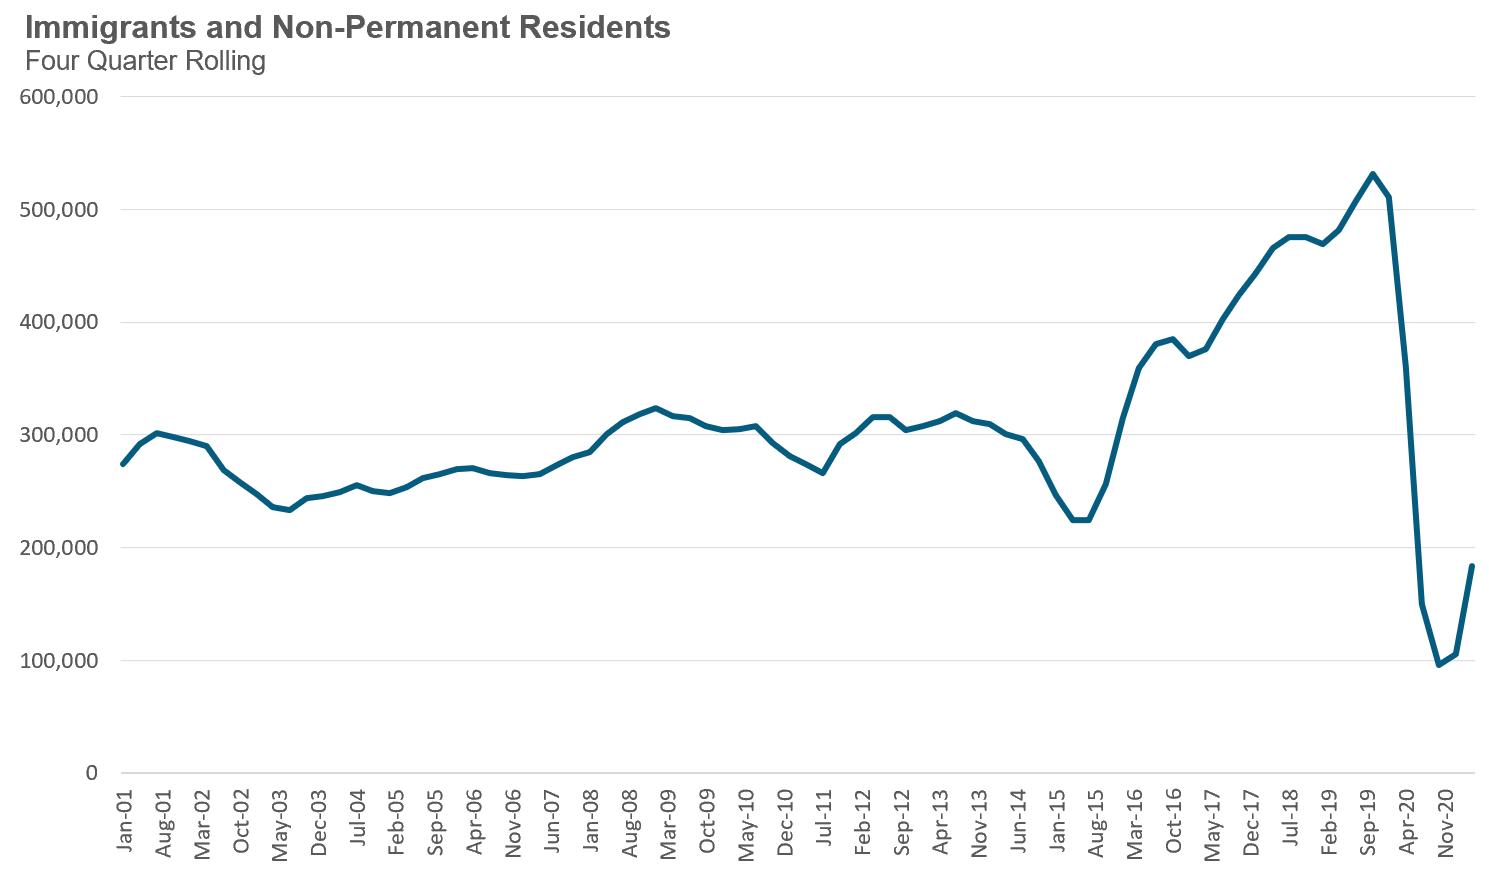
Given this, economist Mike Moffatt recently posed an intriguing question on Twitter:

The short answer to his question is that municipalities don’t change their official plans in response to demand shocks like this — at least not immediately — such plans are typically long-term in nature, reviewed and updated every 5-10 years.
So when our federal government accelerates our population growth and local authorities and market actors like municipalities and builders don’t respond fast enough to accommodate this new demand — the resulting surge in housing prices is pretty much economics 101 as demand is fast outstripping supply under Trudeau’s government.
Another problem is confusing longer-term trends with shorter-term ones and we are seeing some interesting things when it comes to the latter right now.
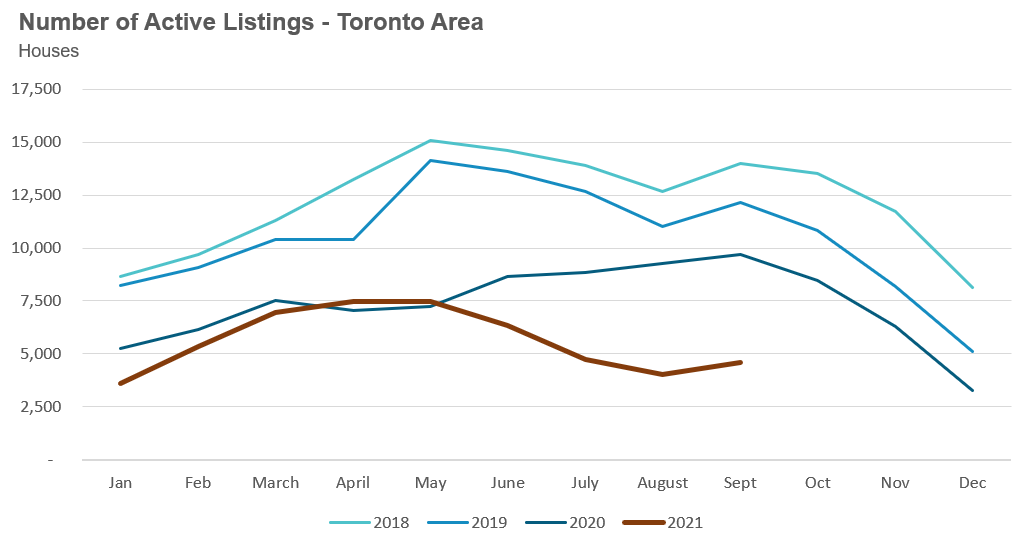
One of the key drivers behind Toronto’s rapid appreciation in house prices over the past month has been a rapidly declining number of homes available for sale. Last month, there were just 4,607 houses available for sale (“active listings”), well below the 10- year average of 11,368 for the month of September.
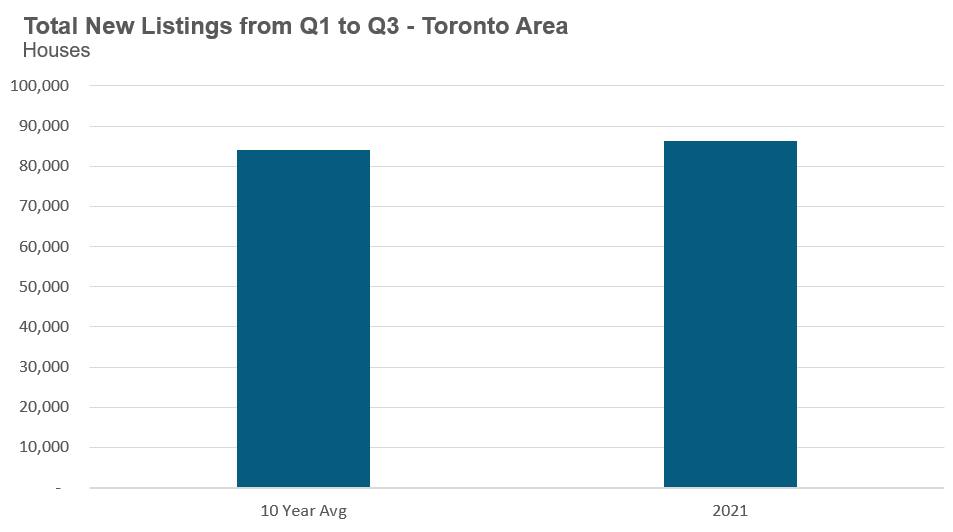
When we look at the volume of new listings that have come on the market during the first three quarters of 2021 in comparison to the 10-year average for those quarters, we see that new listings are 3% ahead of the 10-year average. This suggests that ‘new listing’ levels are not a key driver of the currently low number of ‘active listings’ we are saying, as many have been suggesting on social media and in the media.
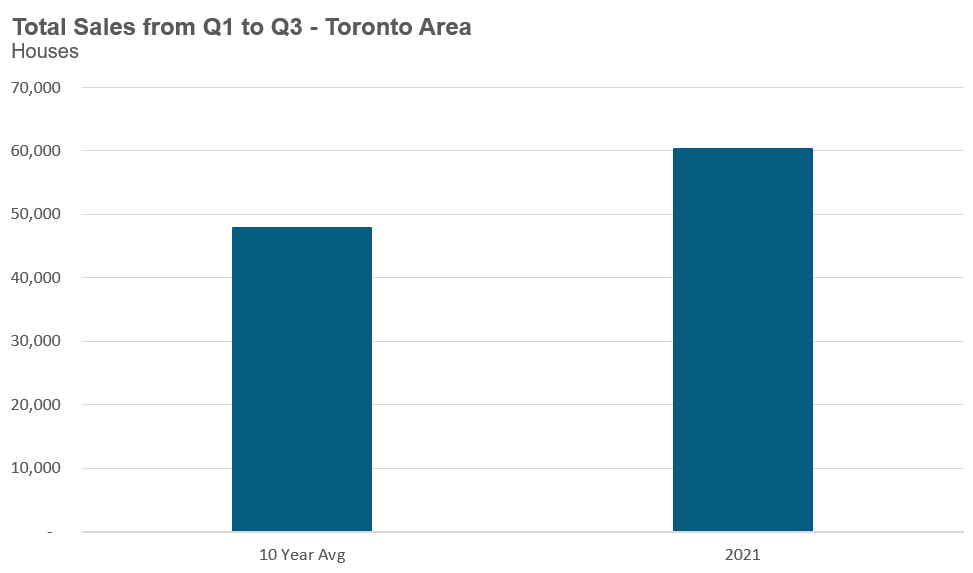
If we look at the number of sales over the same period, the first three quarters this year, against the 10-year average for the same period, we find that sales this year are 26% above the 10-year average. In terms of actual home sales, an extra 12,366 homes sold this year when compared to the 10 year average.
This jump in sales numbers suggests that notably strong demand has been the key driver of this current trend. Given the unprecedented impact of the Covid-19 pandemic, which saw many seeking more spacious living accommodations, coupled with the significant monetary and fiscal stimulus introduced to reduce economic fallout, it’s reasonable to think that these factors may have contributed to a sudden surge in demand for houses in the Greater Toronto Area.
It’s this sudden surge in demand that has resulted in a record low number of ‘active listings’ available. Even though the number of ‘new listings’ was in line with historical trends, the additional 12,366 sales this year, driven by this demand, has resulted in fewer homes being available for sale at any given point in time.
Returning to the supply side, it’s puzzling to see that while sales this year are up 26% over the 10-year trend, new listings are only up 3% over the same periods because a surge in sales would normally lead to an increase in new listings.
A significant number of today’s home buyers (who are contributing to the high number of sales) are also home owners and normally when these owners are upsizing or downsizing to a new home, they sell their current property — which is why we’d expect to see new listings higher than what we’re currently seeing.
One of the reasons new listings haven’t accelerated much is that many homeowners who are upsizing (say from a condo to a house) or downsizing try to hold on to their current home as an investment property rather than sell it.
Recent research published by credit rating agency Equifax found that the number of people adding a fourth mortgage or more (i.e., investors with more than four properties, etc.) surged at twice the rate as the number of first-time borrowers. A recent report from the Canadian Housing Statistics Program also found a sharp rise in the number of buyers looking for investment properties in Canada.
We can see this trend as well by looking at how new rental listings have changed over time.
The chart below shows the number of houses listed for rent during the first three quarters of each year in the City of Toronto. Unlike the condo market, where a rise in rental listings is largely the product of new condo building and unit completions, the same is not true for the low-rise house market. Not only is the rate of construction of new low-rise houses much lower, they are not popular with traditional real estate investors as an investment the way that condos are.
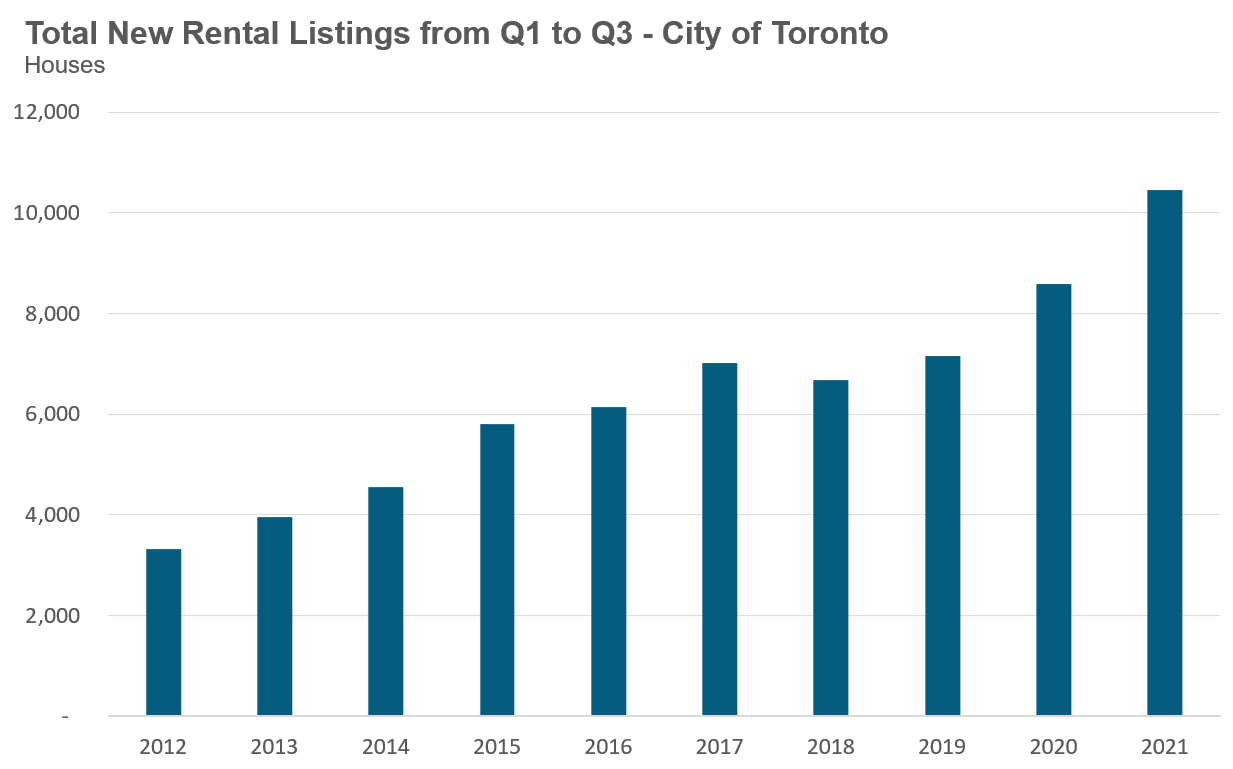
Out of all the regions in the Greater Toronto Area, the City of Toronto saw the most dramatic increase in rental listings between the pre-COVID year of 2019 and the current year, an increase of 46%. Part of this is likely due to the Covid-led urban exodus trend over the past year that saw many people abandon urban living in favour of more rural properties. A fair number of these homeowners who relocated appear to have kept their existing homes and simply rented them out rather than selling them.
Of course, a surge in new listings doesn’t necessarily mean that this is the result of people moving out of their houses and renting them out. It’s possible that this is just the product of the high turnover of existing rentals as more renters move out of the city.
To address whether this is the case, we looked at all new rental listings in a given year and looked back in time to see whether the last transaction on the same property was a lease or a sale. If the last transaction was a lease then we considered this property part of the current rental pool (e.g., as an existing landlord appears to be renting out their houses because their current tenants are moving out); however, if the last transaction was a sale, then we classified this as new rental inventory coming on the market (e.g., as these houses were either previously owner-occupied or newly purchased and are newly being rented out).
What we found was that virtually all of the growth in new rental listings in 2021 was the result of properties that had not been rented out before. This gives some weight to the explanation that new rentals, and not just high turn over of existing rentals, are a key part of the story and that part of this is owners who are hanging on to their properties and renting them out when they buy other ones. Anecdotally, at my own brokerage, Realosophy Realty, we are often asked by clients who are looking to buy a new home if we can help them ‘run the numbers’ to see if they can hold on to their existing homes as rental investments.
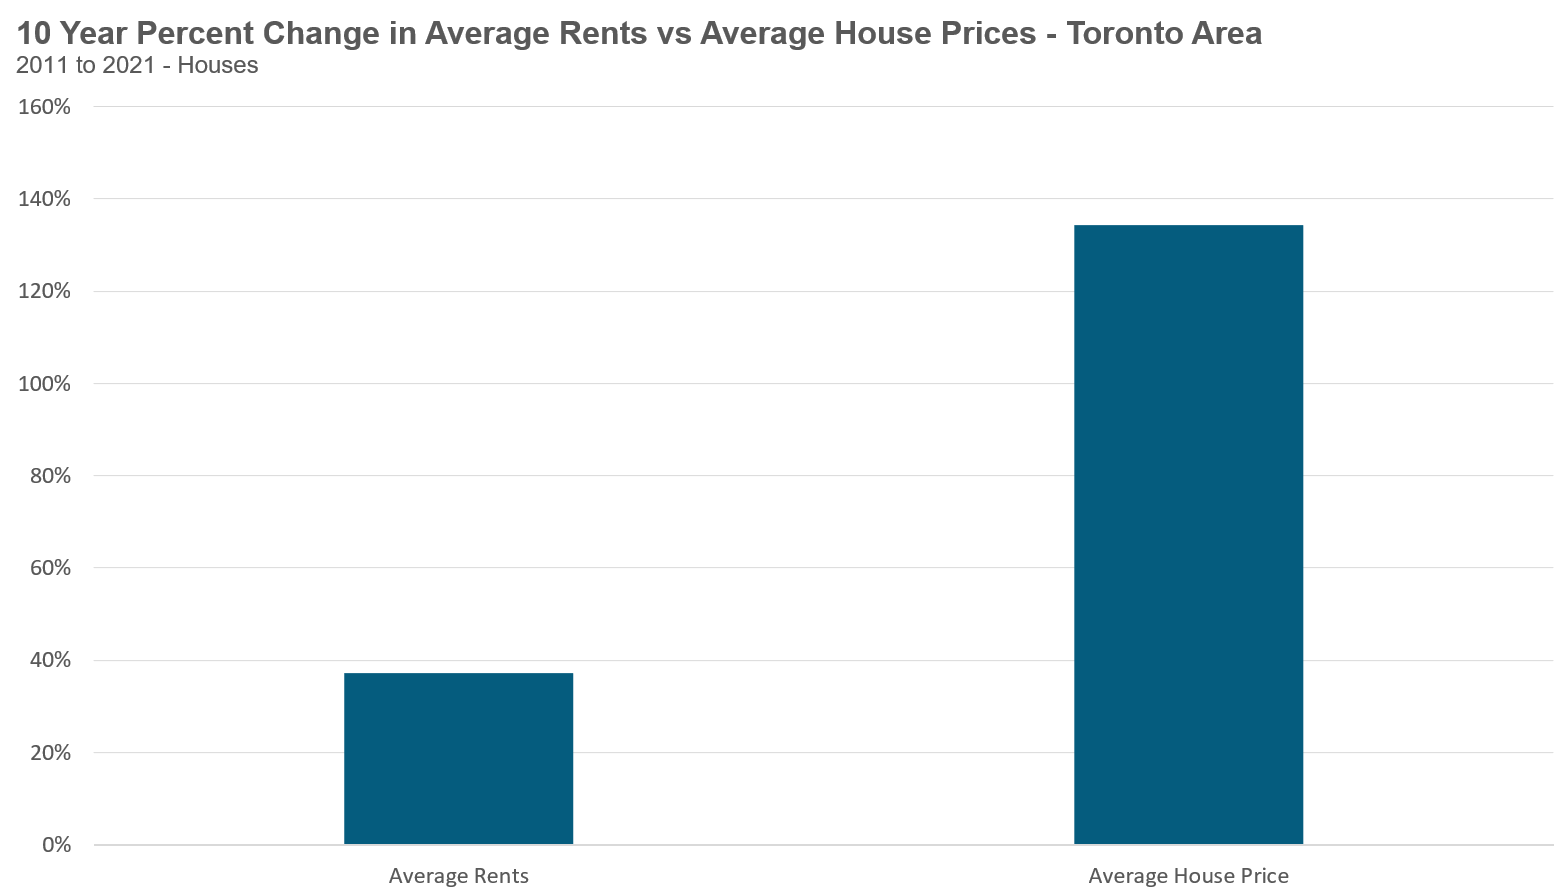
Returning to the issue of housing affordability, I often hear economists arguing that strong demand from investors is a good thing for our housing market since these investors are adding to the rental supply and thus making renting more affordable.
But while house rents are rising at a rate that is slightly above the rate of inflation, house prices have surged 134% in ten years — I think policy makers should be a bit more concerned about how investors might be contributing to the rapid acceleration in house prices.
One policy solution would be to see our government put regular home buyers ahead of wealthy investors by tightening mortgage lending criteria for investors who are buying multiple properties, presumably both increasing supply as fewer homeowners would be able to keep their existing homes after they buy another and reducing demand, which is not a bad thing in a market like Toronto where nearly 1 in 4 homes are bought by investors (according to research from the Bank of Canada).
However, this is not one of the policy proposals put forth by the Liberals in their recent re-election campaign, which, like that of the other parties, focussed largely on the need to build more new housing — which is what happens when you only see ‘long-term supply’ problems regardless of what else the data is actually saying.
Read our full monthly Move Smartly market report for Oct 2021 here
John Pasalis is President of Realosophy Realty, a Toronto real estate brokerage which uses data analysis to advise residential real estate buyers, sellers and investors.
A specialist in real estate data analysis, John’s research focuses on unlocking micro trends in the Greater Toronto Area real estate market. His research has been utilized by the Bank of Canada, the Canadian Mortgage and Housing Corporation (CMHC) and the International Monetary Fund (IMF).
Follow John on Twitter @johnpasalis
Email John
Published: November 03, 2021