
Cold weather and snow storms in January did nothing to cool down Toronto’s red hot housing market.
Hit play to watch John's video report above and read the story below
As Featured in the Move Smartly Report:
FREE PUBLIC WEBINAR: The Market Now with John Pasalis
Join John Pasalis, report author, leading market analyst and Move Smartly contributor, and President of Realosophy Realty, in a free monthly webinar as he discusses key highlights from this report, with added timely observations about new emerging issues, and answers your questions. A must see for well-informed Toronto area real estate consumers.
The Market Now
The average house price for January 2022 was $1,627,691, up 28% over the same month last year and up 23% since August.
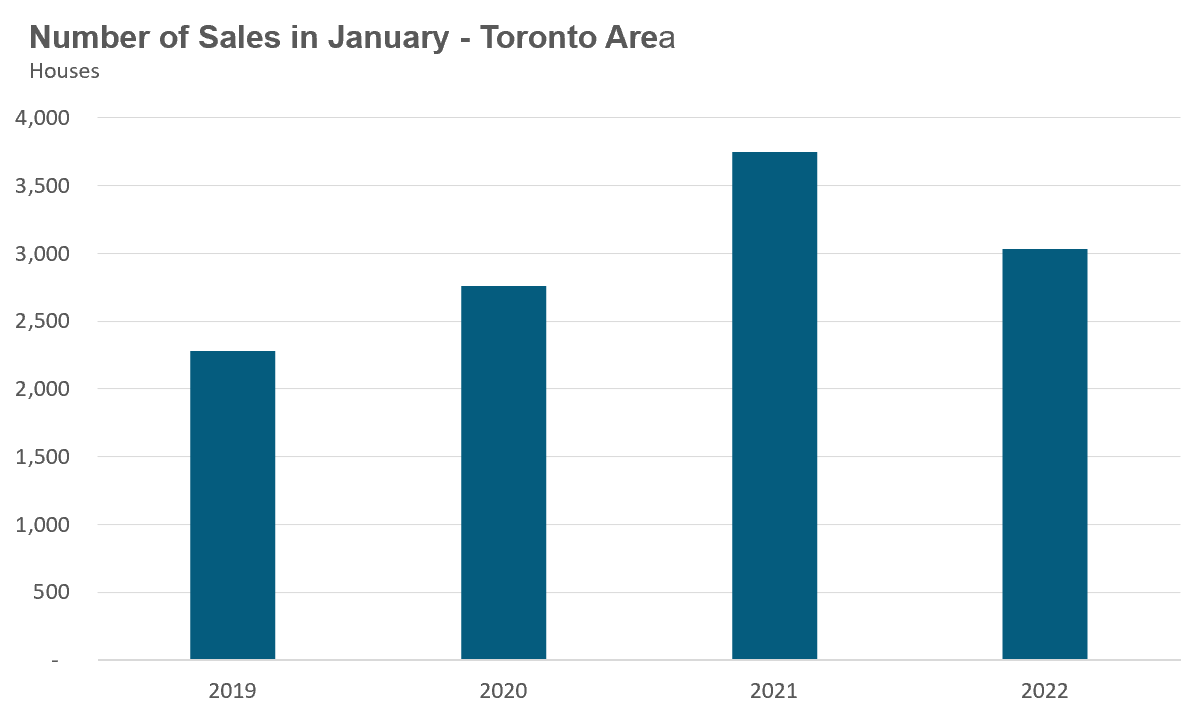
House sales were down 19% on a year-over-year basis in January, but well above pre-Covid 19 pandemic levels for January in 2019 and 2020.
New listings in November were down 15% over last year while the number of active houses for sale at the end of January fell to just 2,427, a 33% decline over last year.
The average price for a house in January was $1,627,691, up 28% over last year and up 23% since August. The median house price in January was $1,450,000, up 31% over last year.
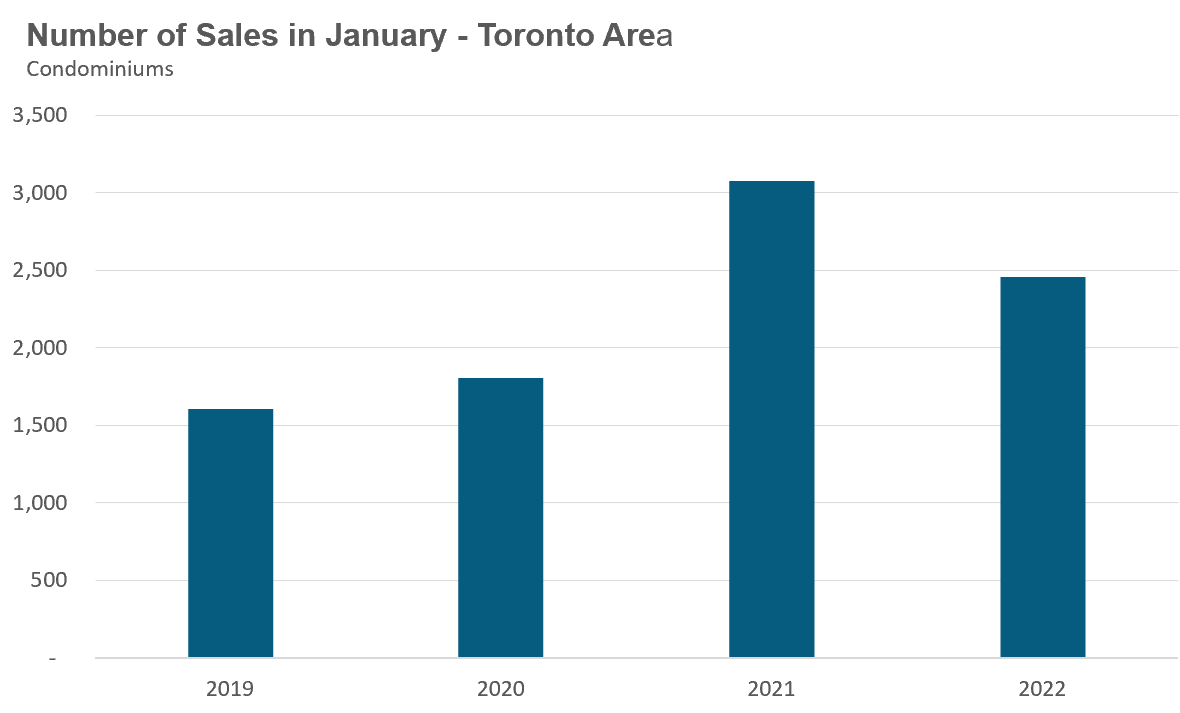
Condominium (condo) sales were down 20% in January over last year, but well above the pre-Covid 19 levels for the same month in 2019 and 2020.
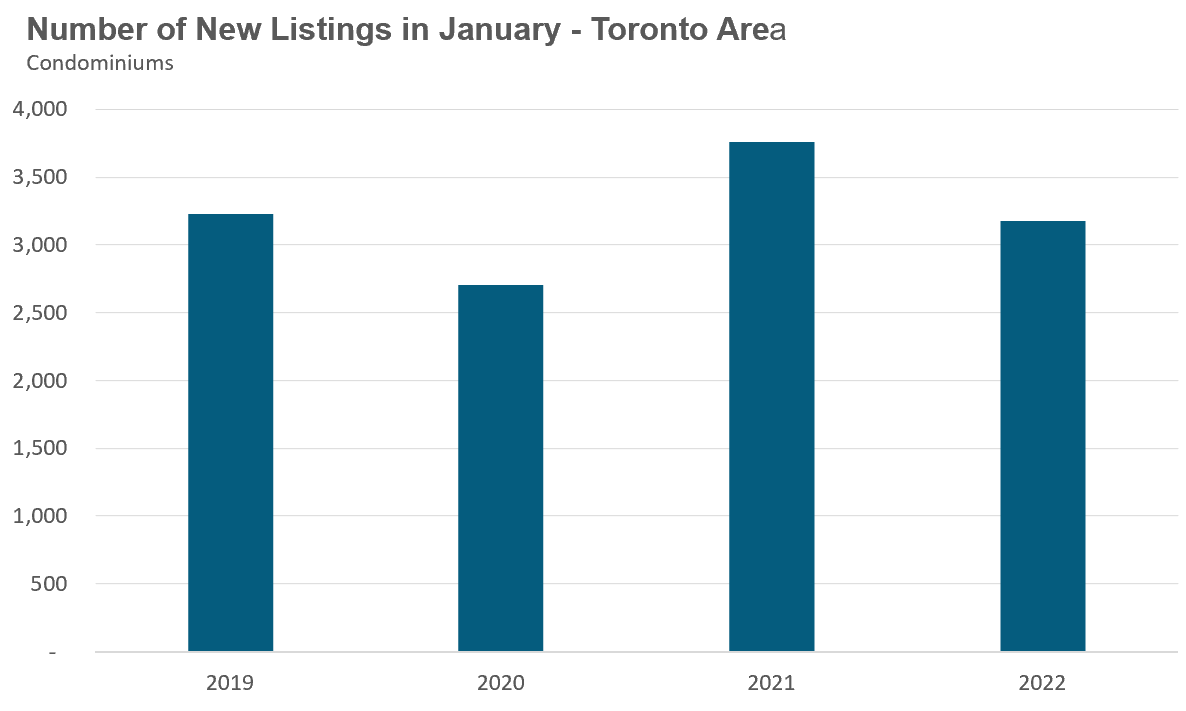
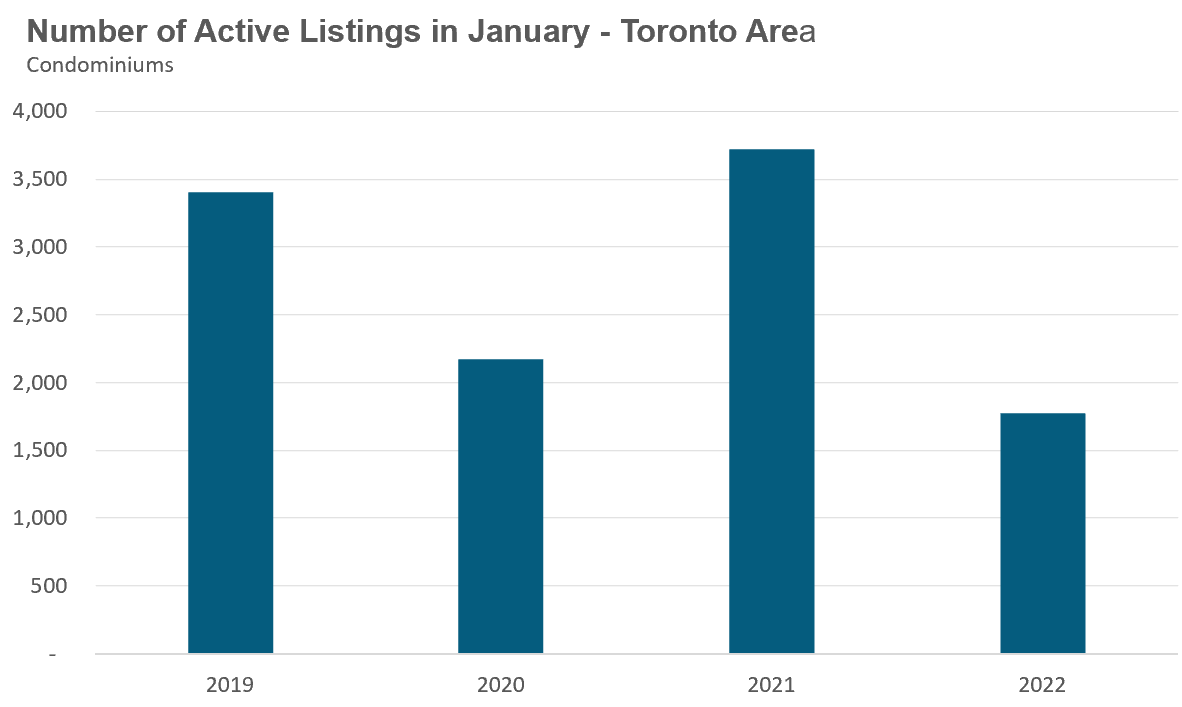
New condo listings were down by 16% in January over last year, but above the volumes in 2020. The number of condos available for sale at the end of the month, or active listings, was down 52% over last year.
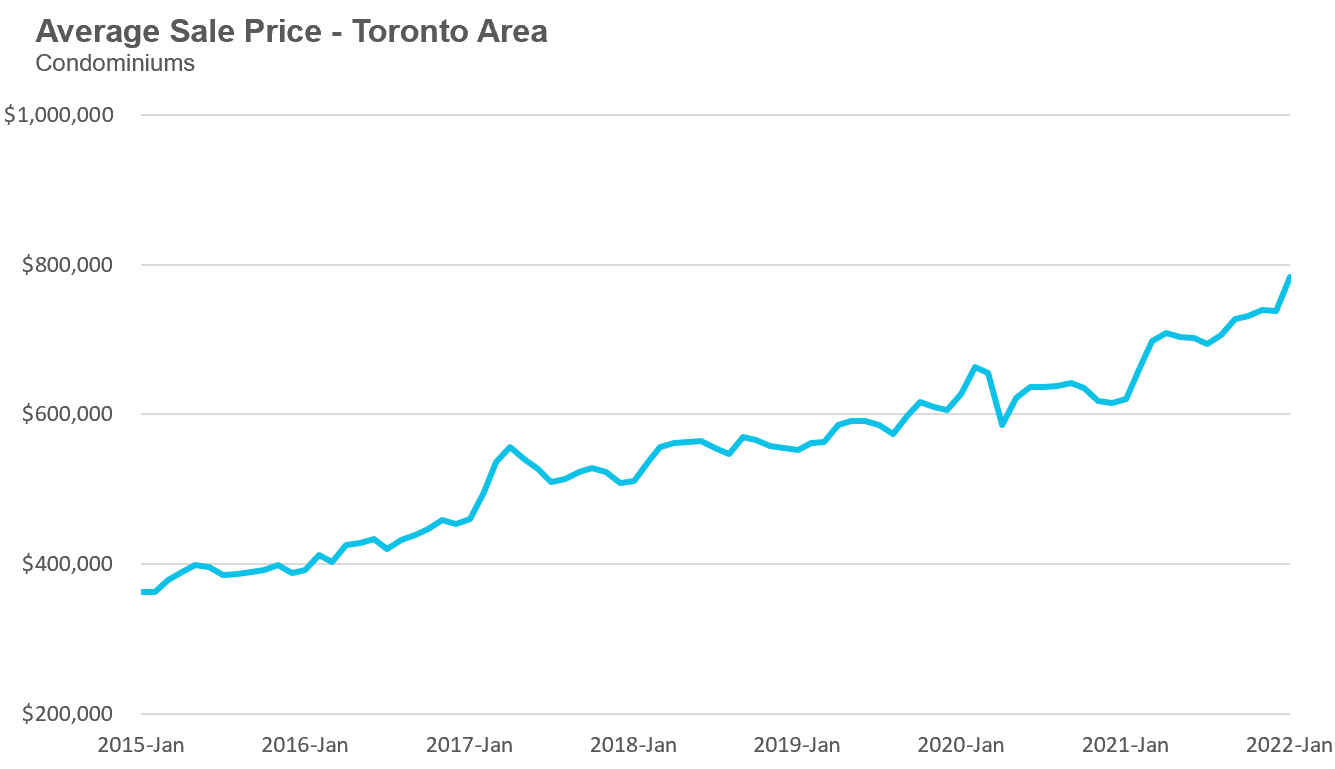
The average price for a condo in November reached $783.942, up 26% over last year; the median price for a condo in January was $722,000, up 24% over last year.
On February 16th this month, my new online course starts. If you are planning to buy a home or are already home buying — whether for first time or the fifth time — this course will teach you how to get an edge in Toronto’s competitive real estate market, understand where the market is heading and more. Click on the image below to see more details and sign up.

Monthly Statistics:
House Statistics
House sales (detached, semi-detached, townhouse, etc.) in the Toronto area in January 2022 were down 19% over the same month last year, but were above levels for the same month in pre-Covid 2019 and 2020.
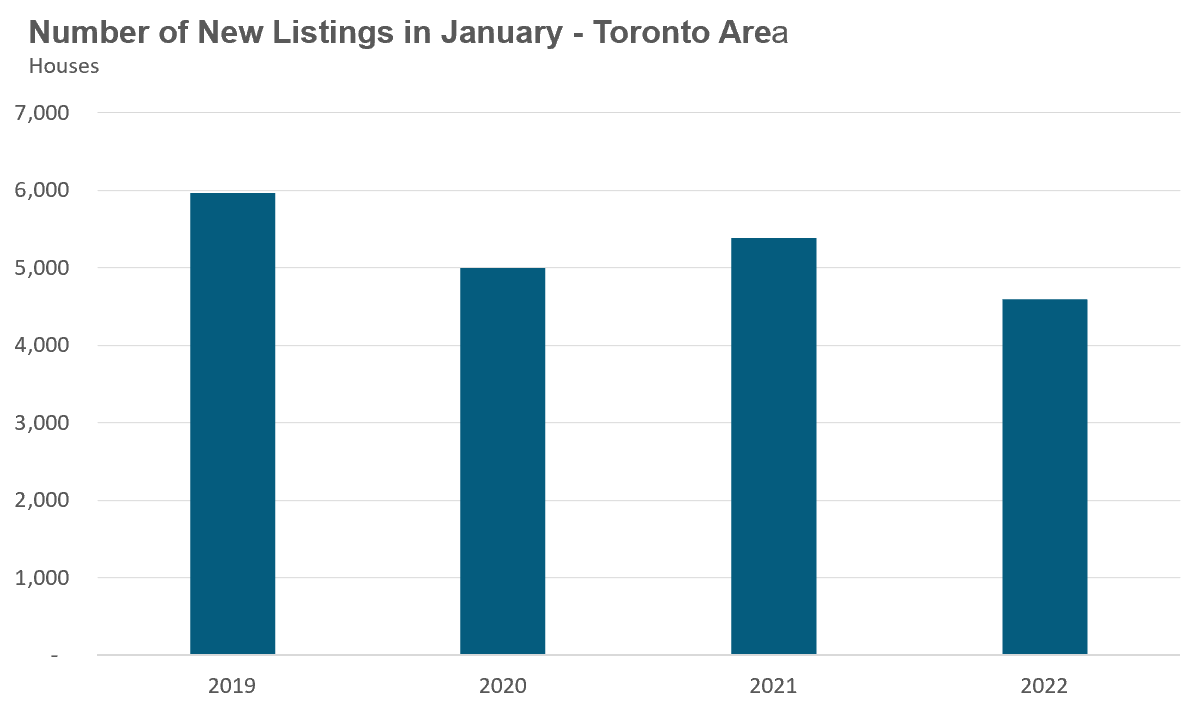
New listings in January were down 15% over last year, and below the volumes seen in 2019 and 2020.
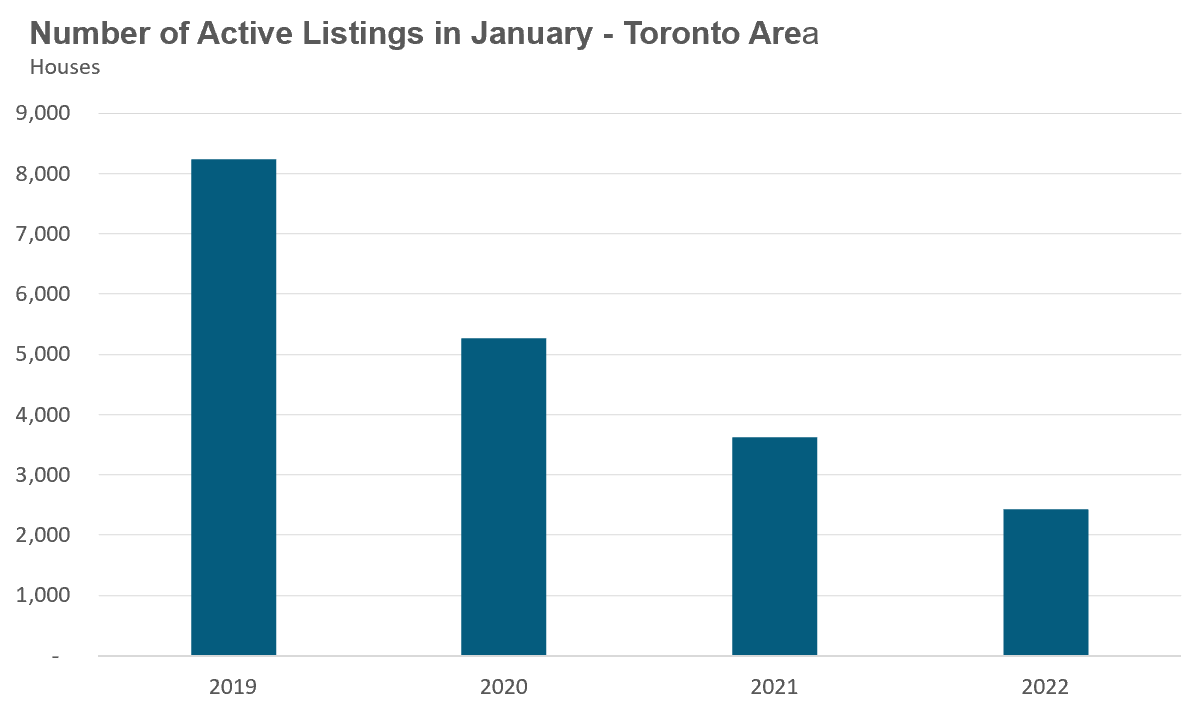
The number of houses available for sale (“active listings”) was down 33% when compared to the same month last year and 54% below the inventory levels seen in 2020. Toronto’s dwindling inventory is partly due to the decline in new listings last month, but the bigger factor is the surge in demand we saw during the second half of 2021.
This acceleration in demand absorbed much of the active inventory in 2021 which means we started the year with fewer active listings from last year. In 2018, for example, we ended the year with just over 8,000 active listings compared to December 2021 where we ended the year with just over 1,500 active listings. The low number of active listings that carried over from 2021 contributed to the tight market conditions at the start the year.
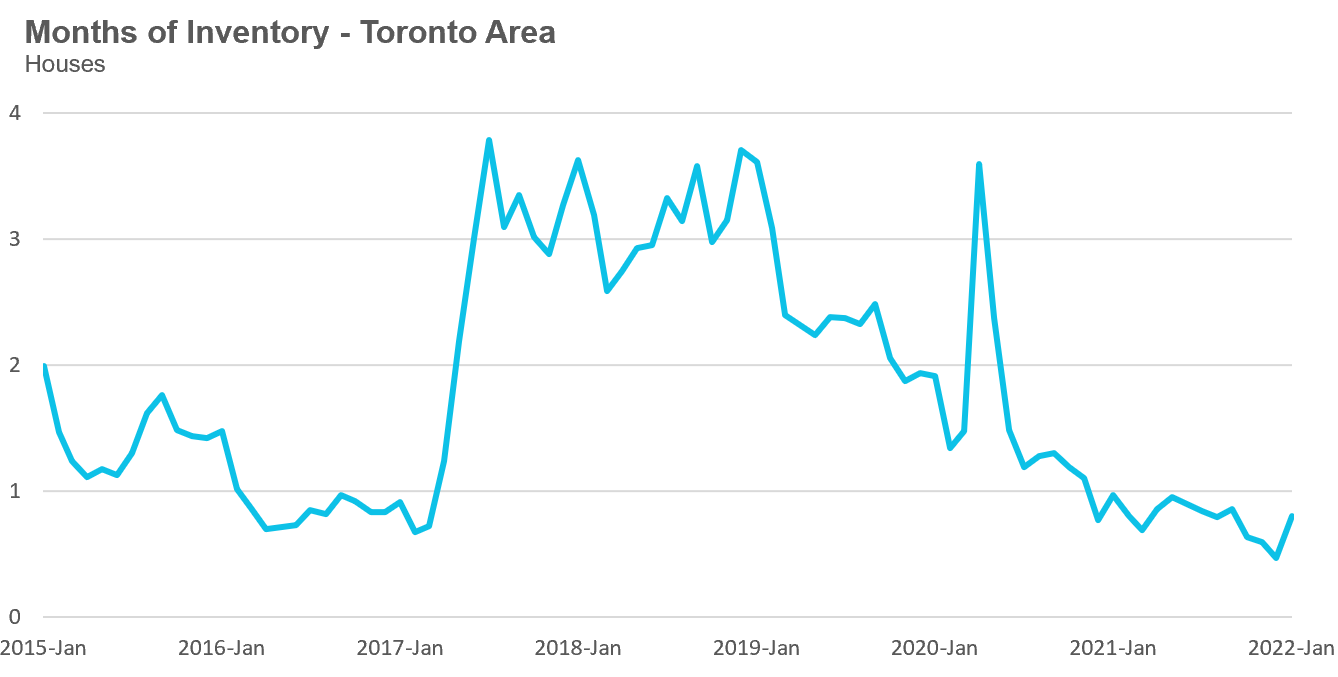
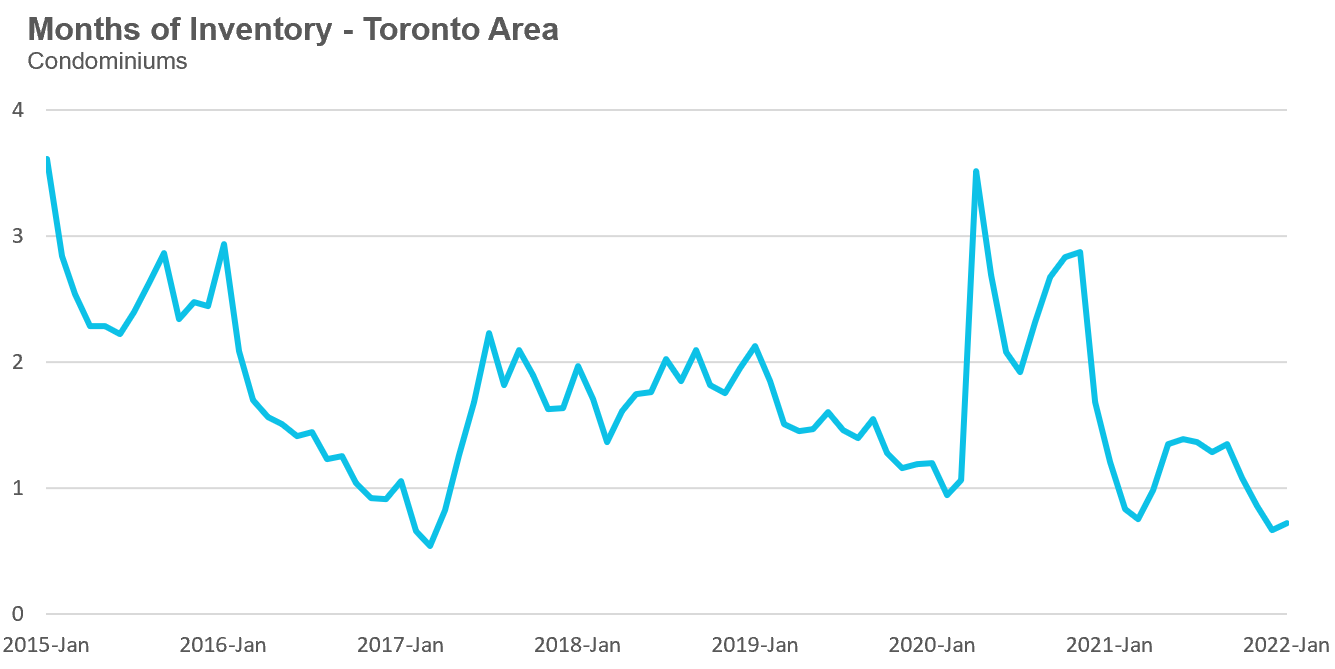
The Months of Inventory ratio (MOI) looks at the number of homes available for sale in a given month divided by the number of homes that sold in that month. It answers the following question: If no more homes came on the market for sale, how long would it take for all the existing homes on the market to sell given the current level of demand?
The higher the MOI, the cooler the market is. A balanced market (a market where prices are neither rising nor falling) is one where MOI is between four to six months. The lower the MOI, the more rapidly we would expect prices to rise.
This January, the market remained very competitive with under 1 MOI.
While the current level of MOI gives us clues into how competitive the market is on-the-ground today, the direction it is moving in also gives us some clues into where the market may be heading. The MOI has been below a very competitive 1 MOI for the past twelve months.
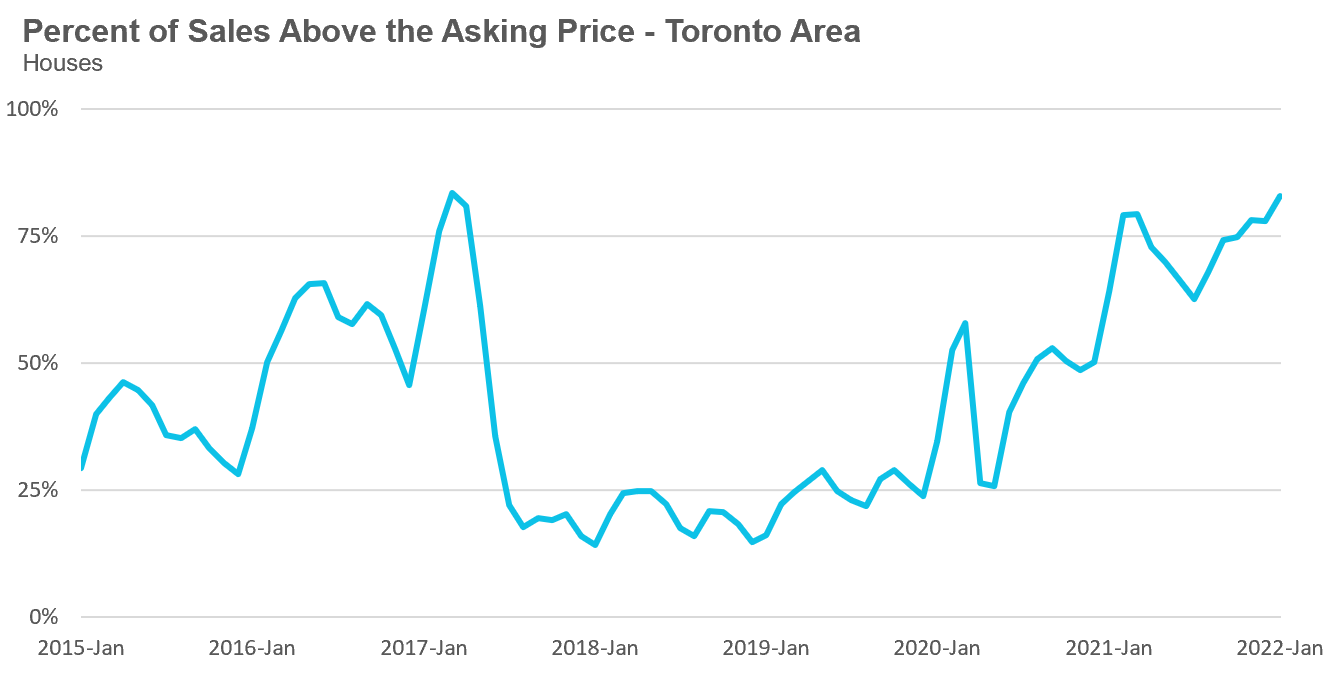
Over the past 5 years, the share of houses selling for more than the owner’s asking price climbed from 68% in August to 83% in January.
After a brief plateau in house prices during the first half of 2021, average house prices have been accelerating since September 2021. The average price for a house has climbed from $1.32M in August to $1.627M in January 2022, a 23% increase in just 5 months and up 28% over last year.
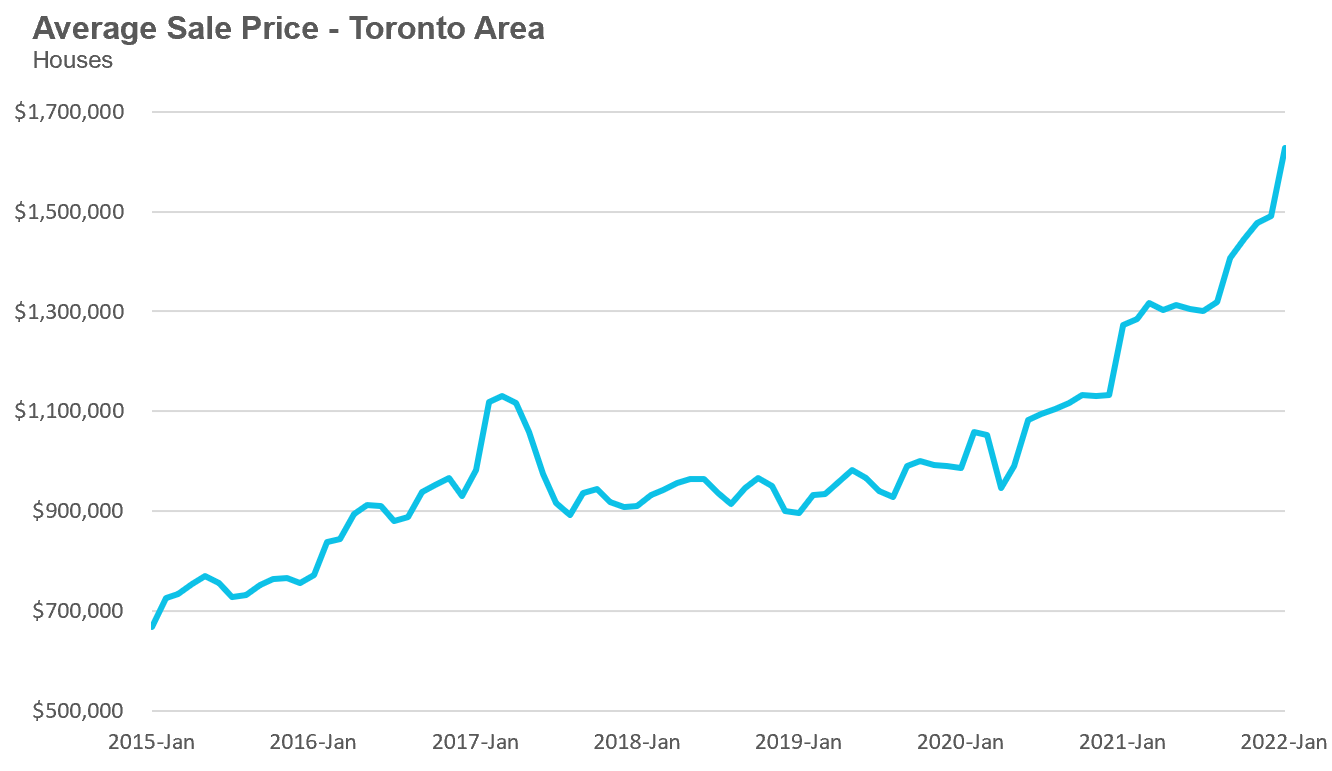
The median house price in January was $1,450,000, up 31% over last year when the median house price was $1,103,500.
The median is calculated by ordering all the sale prices in a given month and then selecting the price that is in the midpoint of that list such that half of all home sales were above that price and half are below that price. Economists often prefer the median price over the average because it is less sensitive to big increases in the sale of high-end or low-end homes in a given month which can skew the average price.
Condo Statistics
Condo (condominiums, including condo apartments, condo townhouses, etc.) sales in the Toronto area in January 2022 were down 20% over last year and up 26% compared to pre-Covid 2020.
New condo listings were down by 16% in January over last year, but well above the volumes in 2019 and 2020.
The number of condos available for sale at the end of the month, or active listings, was down 52% over last year, a period that saw a surge in condo listings due to declining prices, falling rents and rising vacancy rates.
The strong demand helped keep the MOI below 1 MOI for the month of January.
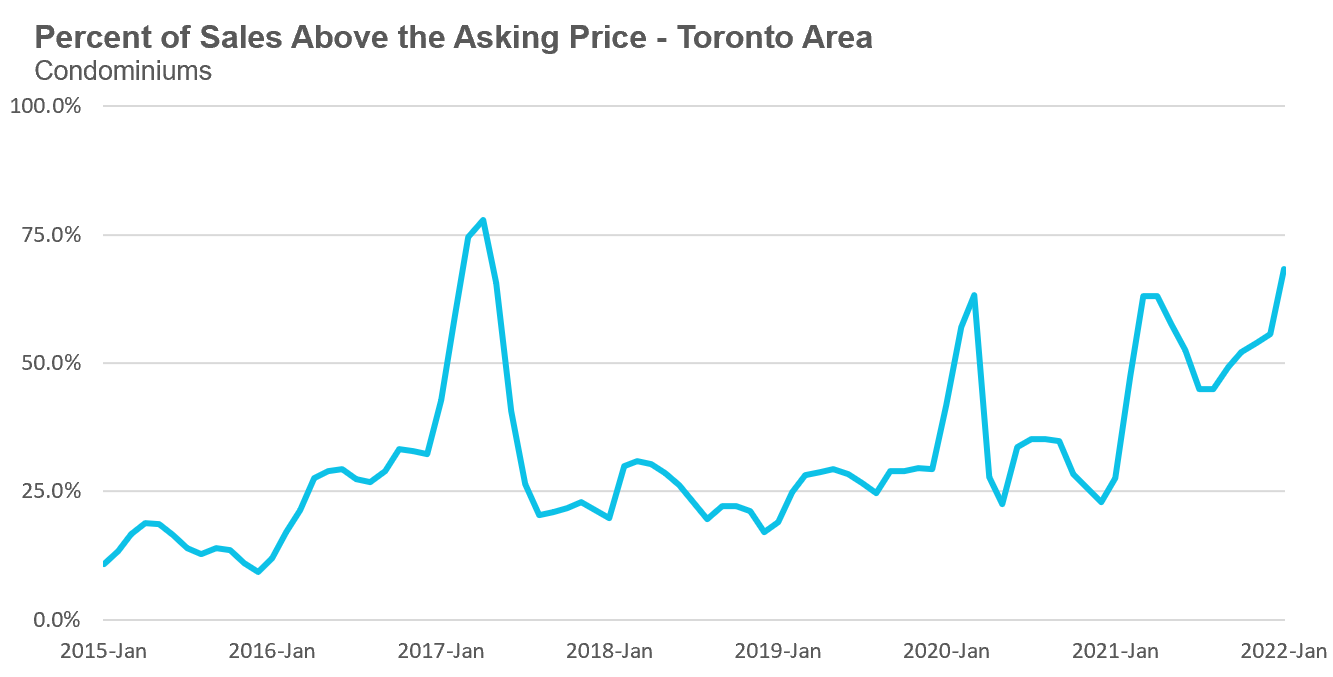
The competition for condos picked up significantly with the share of condos selling for over the asking price rising from 45% in August to 68% in January.
Average condo prices in January reached $783.942, up 26% over last year. The median price for a condo in January was $722,000 up 24% over last year.
Regional Trends
Houses
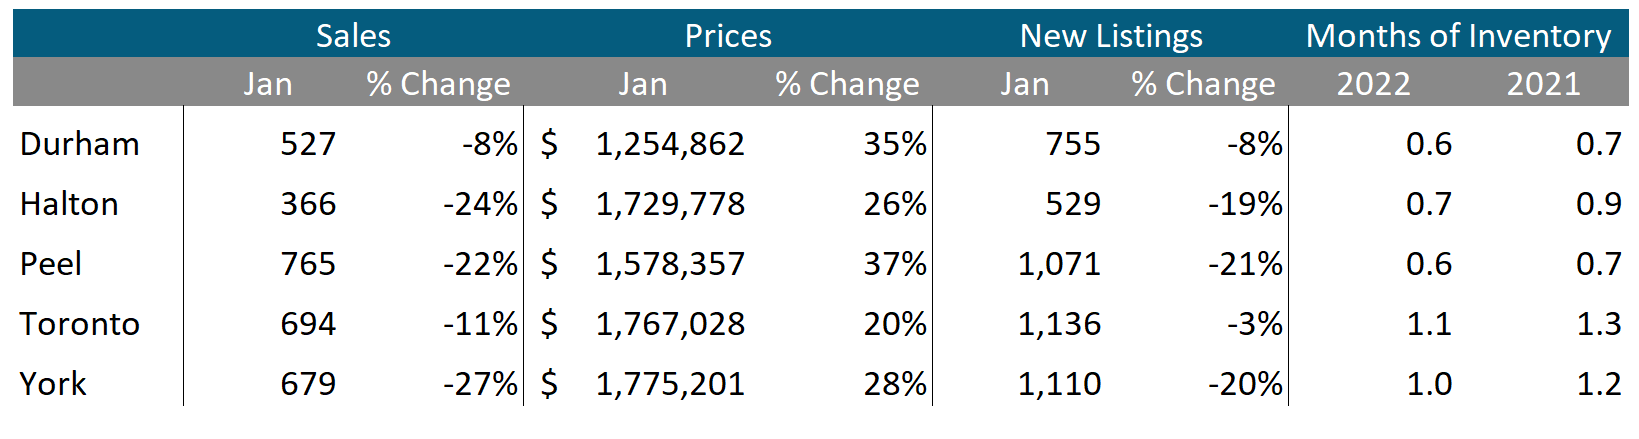
Sales across all five regions in the GTA were down in January while average prices were up on a year-over-year basis. The decline in new listings helped keep the market competitive with MOI below 1 across the entire GTA, indicating a strong seller’s market.
Condos
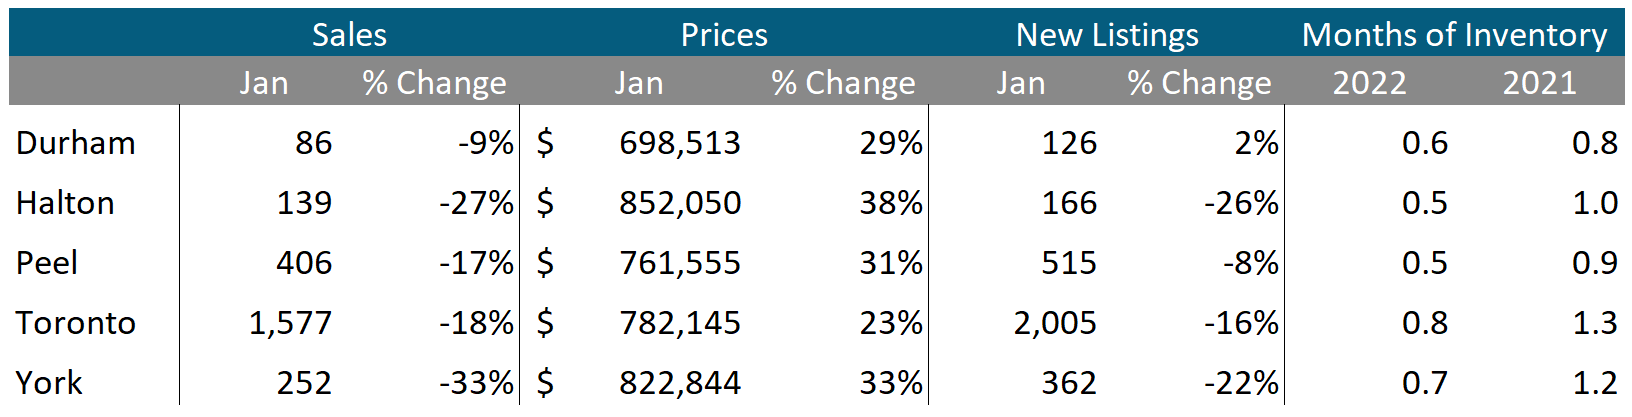
Condo sales were up in Durham but down across the rest of the GTA in January. Average prices were up double digits in all five regions. Current MOI levels are below 1 across the GTA signalling a strong seller’s market.
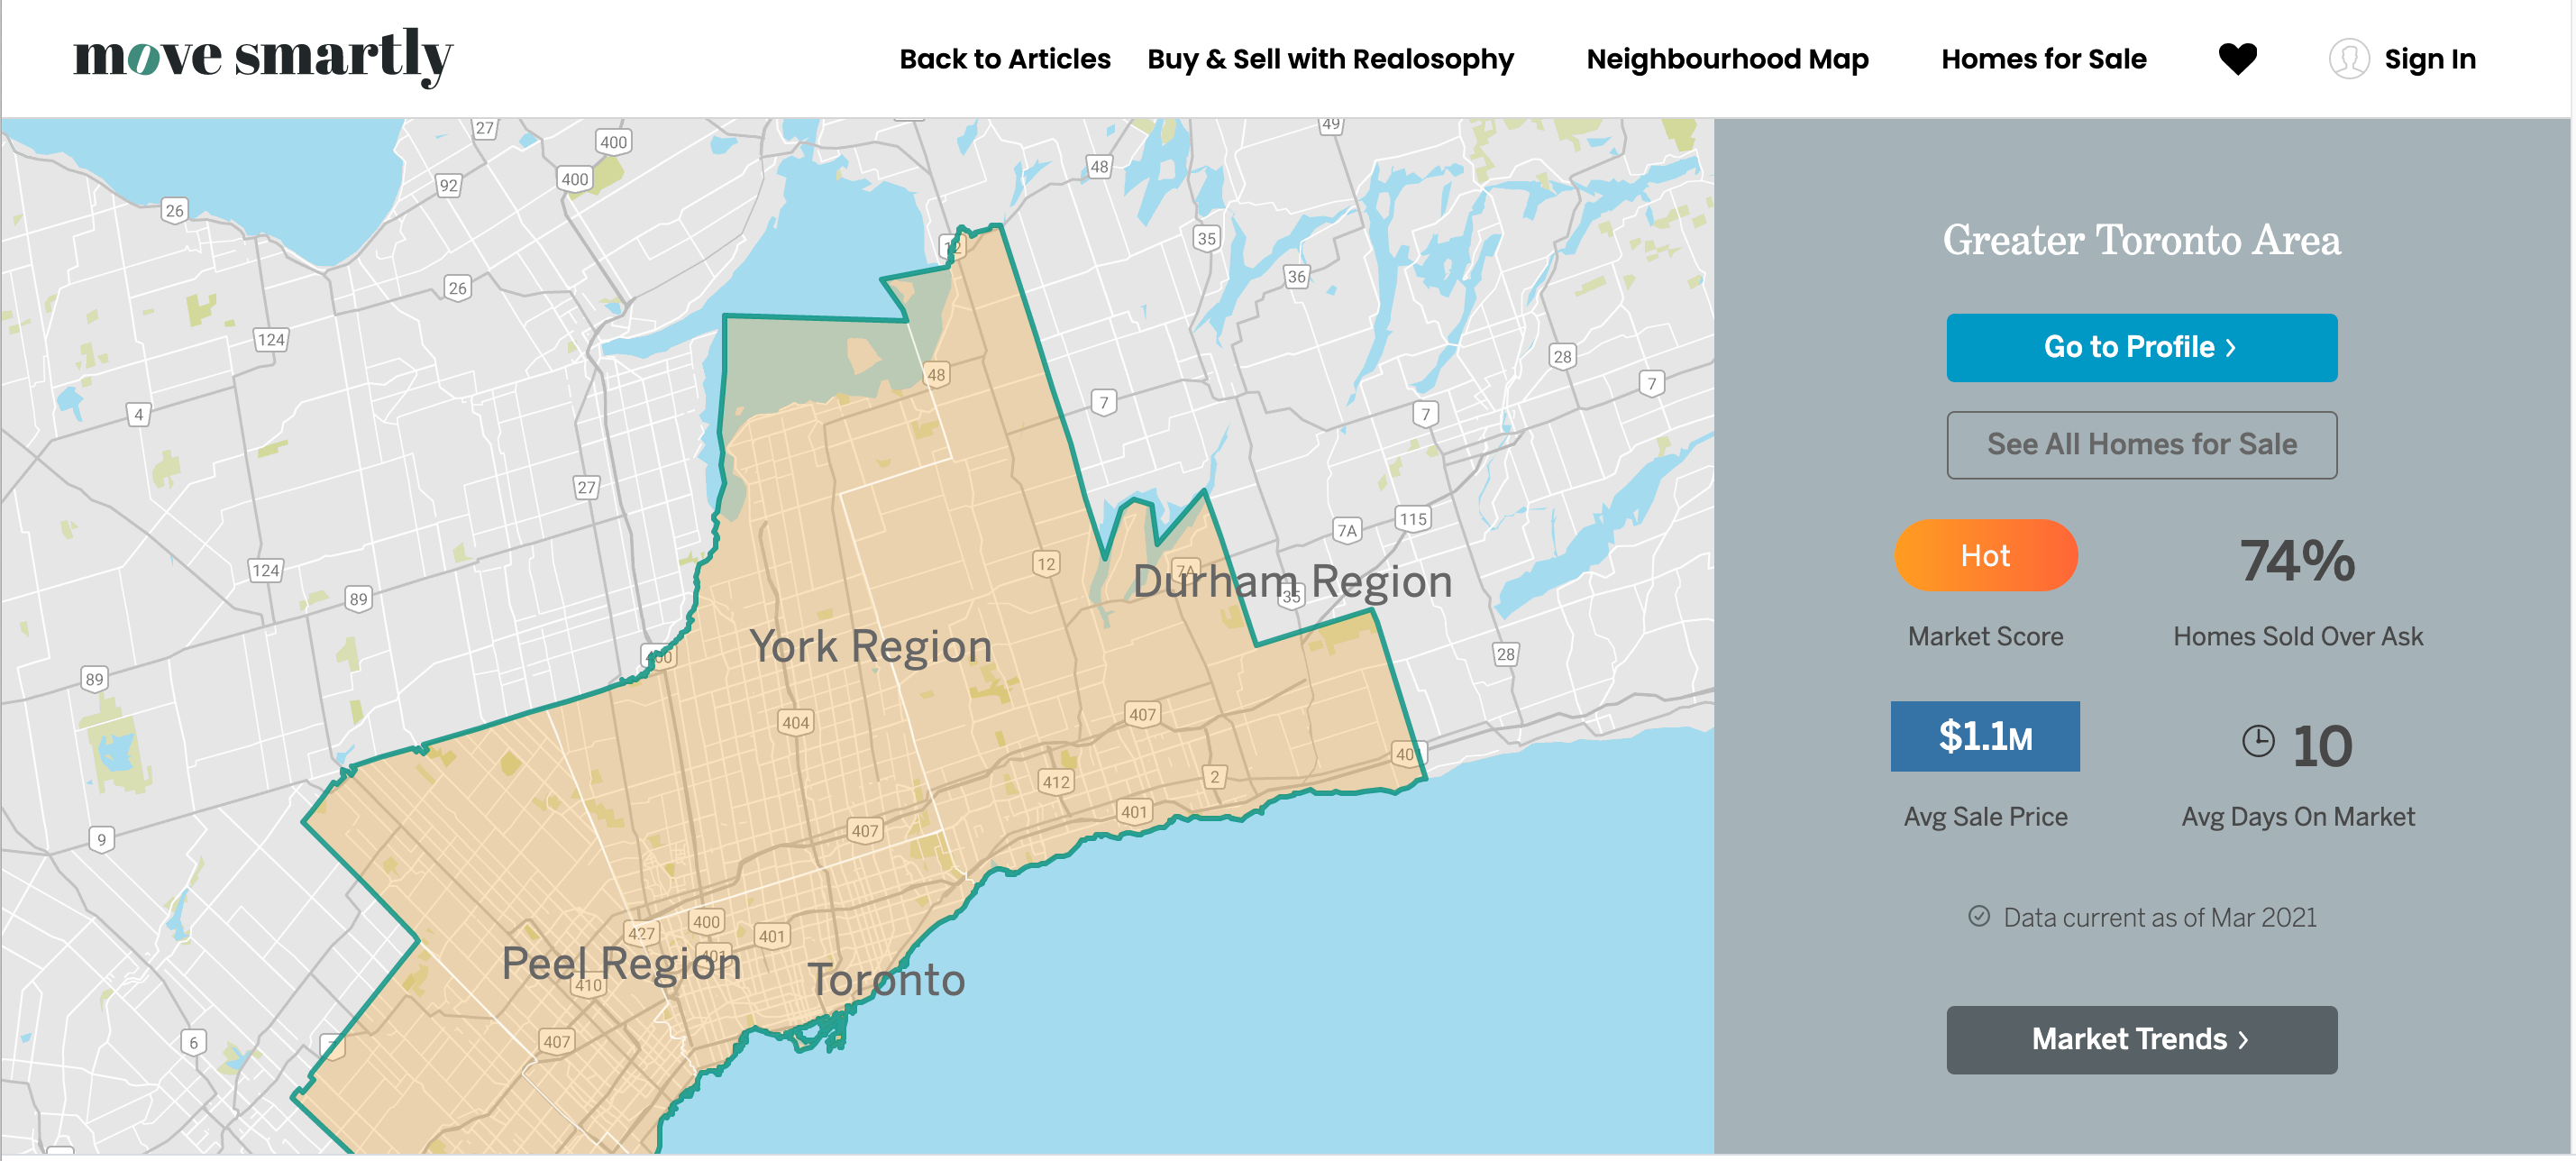
Browse All Real-Time Regional Market Trends on Movesmartly.com:
Greater Toronto Area Market Trends
All Market Performance by Neighbourhood Map, Toronto and the GTA
Top Image Credit: Getty/iStock
The Move Smartly monthly report is powered Realosophy Realty Inc. Brokerage, an innovative residential real estate brokerage in Toronto. A leader in real estate analytics, Realosophy educates consumers at Realosophy.com and MoveSmartly.com and helps clients make better decisions when buying and selling a home.
Published: February 07, 2022


