Latest numbers continue to show a stalemate - for now.
As Featured in the monthly Move Smartly Report

FREE MONTHLY WEBINAR: The Market Now with John Pasalis - Next Session Wed Nov 16th 12PM ET
Join John Pasalis, report author, leading market analyst and Move Smartly contributor, and President of Realosophy Realty, and in a free monthly webinar as he discusses key highlights this month's report and answers your questions. A must see for well-informed Toronto area real estate consumers.
Register now to get recording of latest session and access to future sessions.
The Market Now
Looking at the most recent statistics for the Greater Toronto Area (GTA) market for the latest month available, October 2022, we are seeing that even as sales numbers remain at 20-year lows, home prices have stabilized since July in part because there are relatively few homes available for sale as new listings were also at a 20-year low in October.
The average price for a house was $1,309,055 in October, down 22% from the most recent peak of $1,679,429 in February, and down 9% over the same month last year. The median house price in October was $1,130,000, down 24% from $1,485,000 in February, and down 11% over last year.
House sales in October were down a whopping 47% over last year while new house listings were down 10% compared to last year. The number of houses available for sale at the end of the month, or active listings, was up 91% over last year, when demand was notably high; excluding that year, the active listings number today is well below historical norms for the month of October.
The Months of Inventory (MOI) which is a measure of inventory relative to the number of sales each month (see Monthly Statistics section below for more information on this measure) was unchanged at 2.3 MOI in October, indicating tight supply conditions.
The average price for a condo fell to $739,099 in October, down 12% from the most recent peak of $840,444 in March, but still up 1% over last year. The median price for a condo in October was $667,750, down from $777,000 in March, but again up 1% over last year.
Condo sales in October were down 53% over last year and below pre-COVID sales volumes for the month in 2019. New condo listings were down 16% over last year while the number of active condo listings was up 44% over last year. The MOI was unchanged at 3.3 MOI in October, indicating that supply is slightly less constrained than for houses.
For detailed monthly statistics for the Toronto Area, including house, condo and regional breakdowns, see the final section of this post below.
On The Ground: How Low Active Listings Are Keeping Prices Flat
Toronto’s housing market continues to remain very sluggish with very few sales.
However, this low level of sales is not entirely down due to a drop off of buyer demand, but also seller supply, as very few homes are being made available for sale.
The relatively tight inventory of homes available for sale has made this market challenging for buyers eager to purchase a home. Many clients at my own brokerage are eager to buy, but they also don’t want to compromise too much because — unlike in the very hot competitive market conditions we’ve been seeing in so many past years — right now, they don’t feel like there is any urgency to buy.
Because of this, the nicest homes that are coming onto the market each week are receiving a lot of interest while homes that have features that buyers might find slightly less desirable are sitting on the market for months.
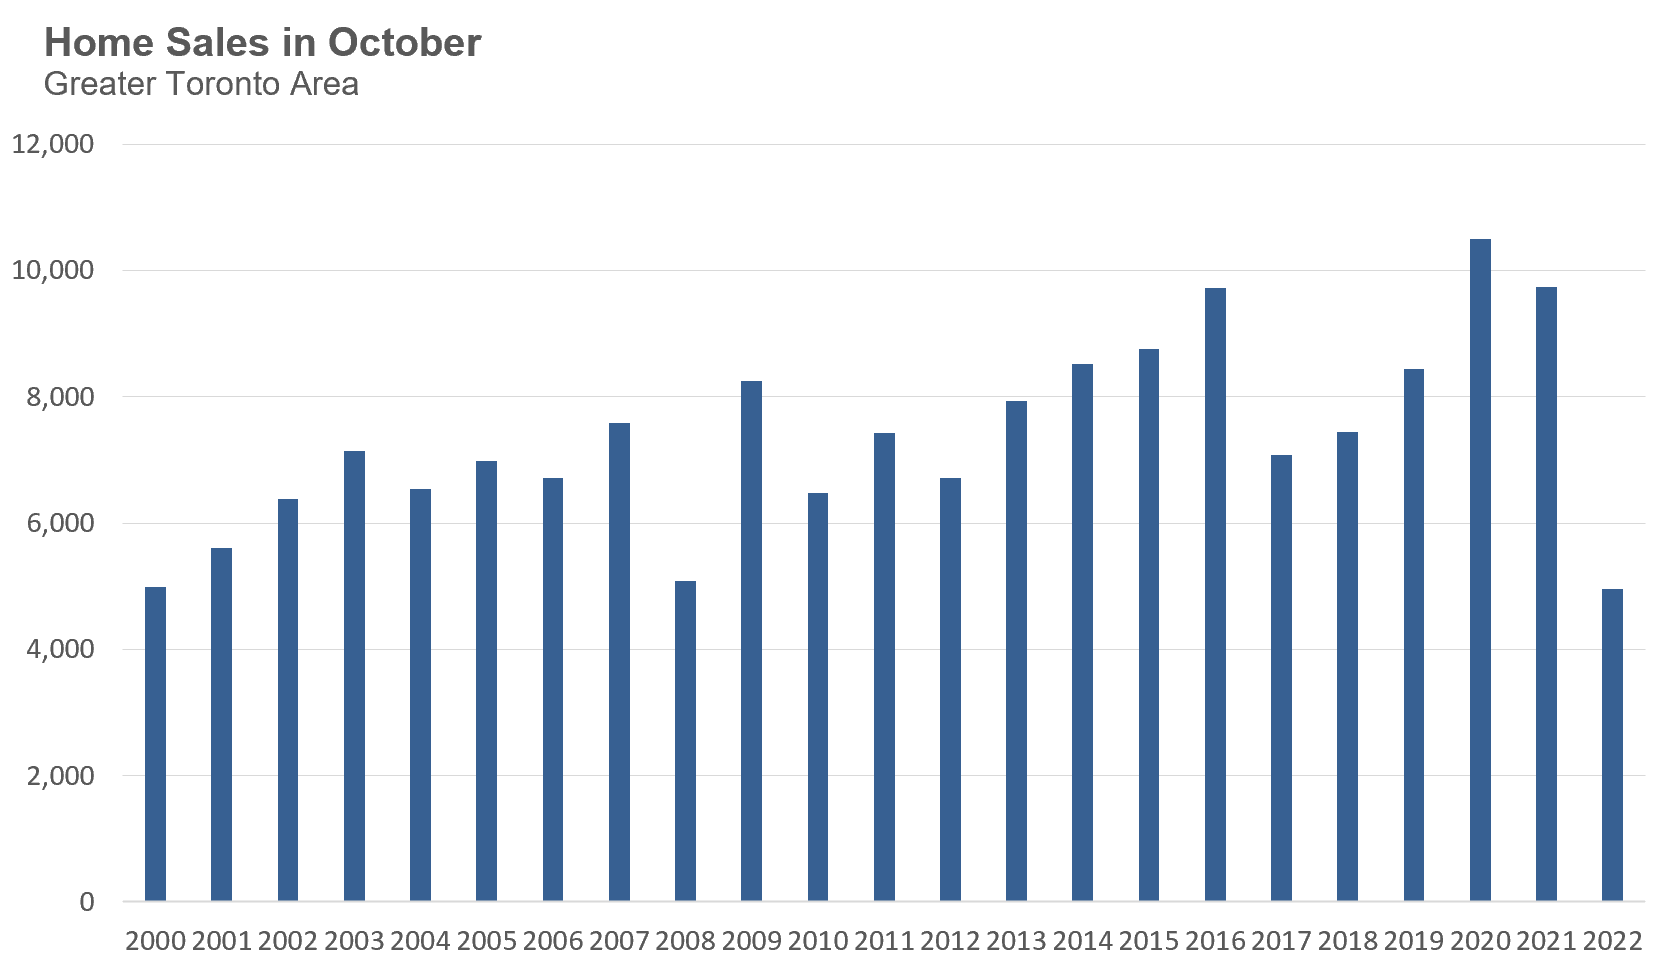
In the chart below that shows the number of homes that sold during the month of October in the GTA since 2000, we can see that sales last month were at their lowest level since 2000.
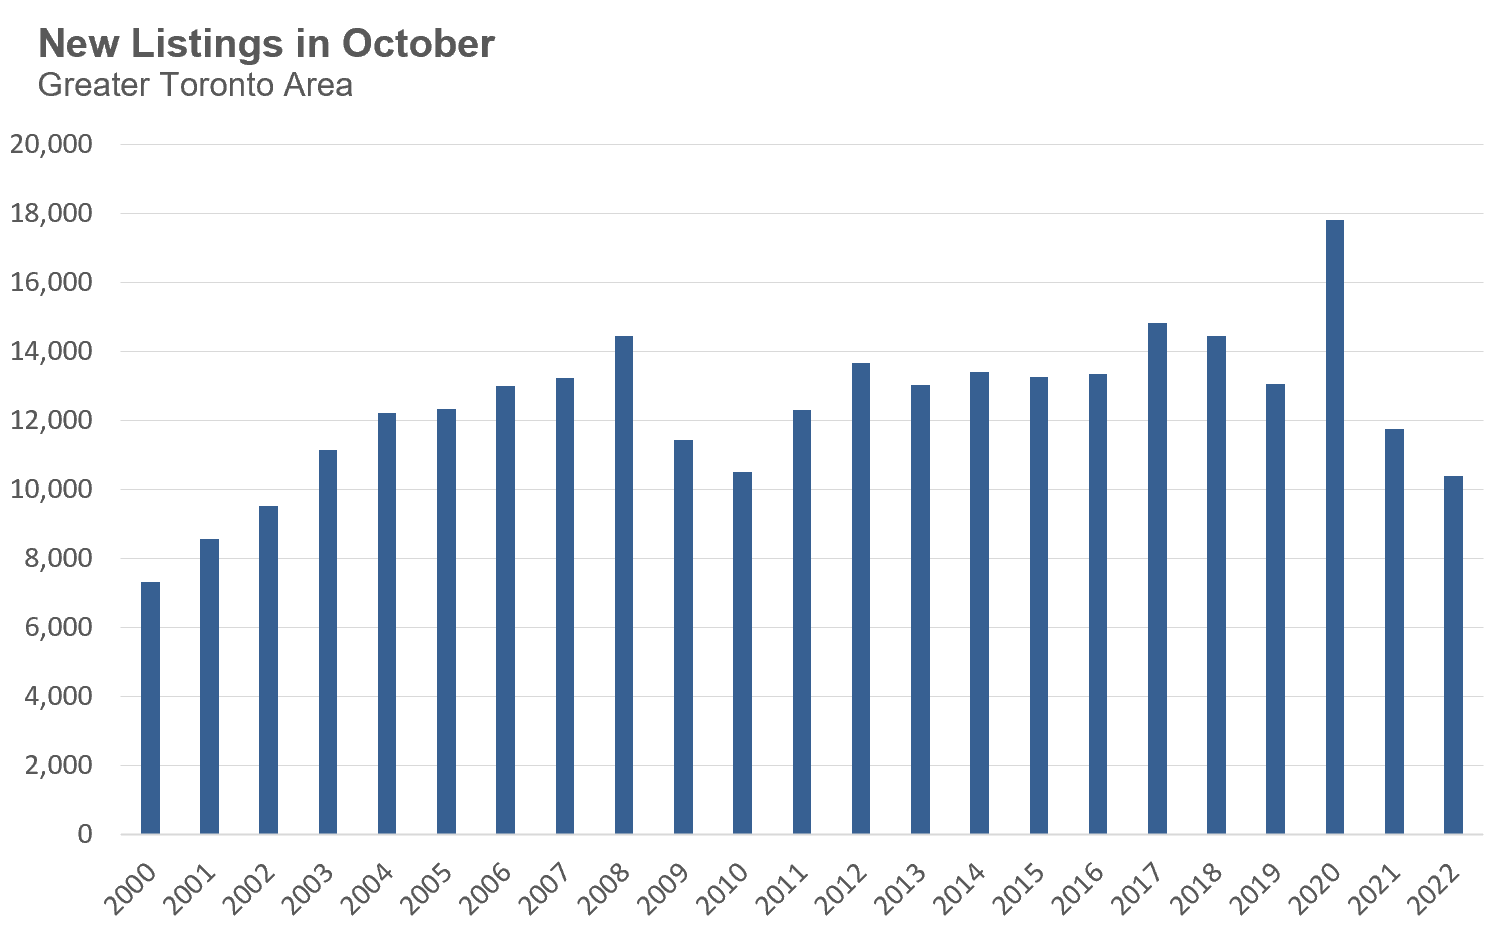
New listings last month were at their lowest level since 2002.
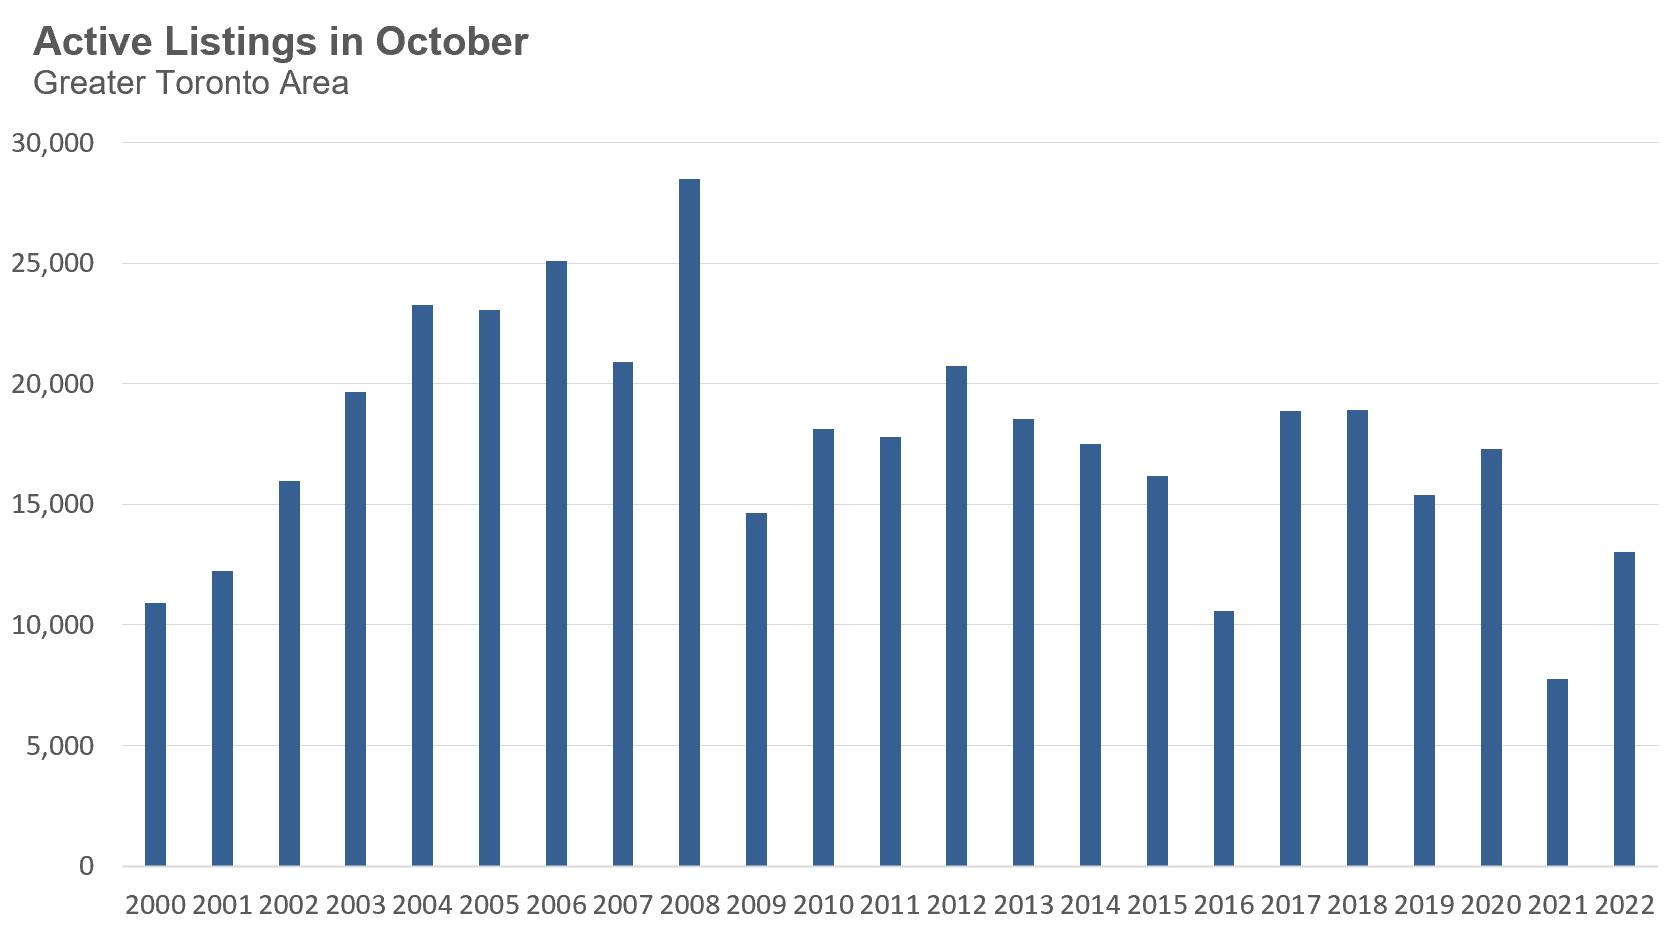
When looking at the active listings on the market, we see that active listings were lower in 2016 and 2021 due to the fact that the housing market was in the midst of a housing bubble in those years in which buyer demand overwhelmed supply. Those two years aside, the last time we had so few homes on the market for sale for the month of October was in 2001.
While higher interest rates have definitely driven much of the decline in demand we have seen since the first quarter of this year, part of the soft sales volume today is also a function of the fact that there are relatively few homes available for sale. Buyers can only buy what is available for sale.
The last time October sales were close to this year’s volumes was during the financial crisis in 2008, but the big difference between then and now is that there were 28,000 homes available for sale at that time compared to just 13,000 today.
This lack of seller activity resulting in a low inventory of homes available for sale has helped to keep home prices relatively flat since July.
Monthly Statistics
House Statistics
House sales (low-rise detached, semi-detached, townhouse, etc.) in the Greater Toronto Area (GTA) in October 2022 were down 47% over the same month last year and represents a 20-year low for the month of October. Home sales were also down over the previous month, a period when sales are usually up month over month.

New house listings in October were down 10% over last year, and represent a 20-year low for the month of October.

The number of houses available for sale (“active listings”) was up 91% when compared to the same month last year, but still well below pre-COVID levels for the month of October. It’s worth noting that the low inventory levels in the second half of 2021 were due to a surge in demand as the market accelerated towards the peak in February 2022.

The Months of Inventory ratio (MOI) looks at the number of homes available for sale in a given month divided by the number of homes that sold in that month. It answers the following question: If no more homes came on the market for sale, how long would it take for all the existing homes on the market to sell given the current level of demand?
The higher the MOI, the cooler the market is. A balanced market (a market where prices are neither rising nor falling) is one where MOI is between four to six months. The lower the MOI, the more rapidly we would expect prices to rise.
While the current level of MOI gives us clues into how competitive the market is on-the-ground today, the direction it is moving in also gives us some clues into where the market may be heading.
The MOI for houses remained unchanged at 2.3 MOI in October.

The share of houses selling for more than the owner’s asking price increased slightly to 30% in October.

The average price for a house in October was $1,309,055 in October 2022, well below the peak of $1,679,429 reached in February and down 9% when compared to the same month last year.

The median house price in October was $1,130,000, down11% over last year, and below the peak of $1,485,000 reached in February.
The median is calculated by ordering all the sale prices in a given month and then selecting the price that is in the midpoint of that list such that half of all home sales were above that price and half are below that price. Economists often prefer the median price over the average because it is less sensitive to big increases in the sale of high-end or low-end homes in a given month which can skew the average price.
Condo Statistics
Condo (condominiums, including condo apartments, condo townhouses, etc.) sales in the Toronto area in October 2022 were down 53% over last year and well below pre-COVID sales volumes for the month of October.

New condo listings were down 16% in October over last year and in line with historical listing volumes for the month of October.

The number of condos available for sale at the end of the month, or active listings, was up 44% over last year.

Condo inventory levels remained unchanged at 3.3 MOI in October.

The share of condos selling for over the asking price was unchanged at 19% in October.

The average price for a condo in October was $739,099, down from the peak of $840,444 in March, but up 1% over last year. The median price for a condo in October was $667,750, up 1% over last year, but down from $777,000, the March peak.

Regional Trends
Houses
Average prices were down over last year across all five regions with York and Durham Regions seeing the biggest decline in prices. Sales were down significantly across all regions and inventory levels were well ahead of last year’s level.

Condos
Average condo prices continue to be flat or up over last year in all five regions. Sales were down significantly across all regions and inventory levels were well ahead of last year’s level.

Browse Real-Time Market Trends on Movesmartly.com:
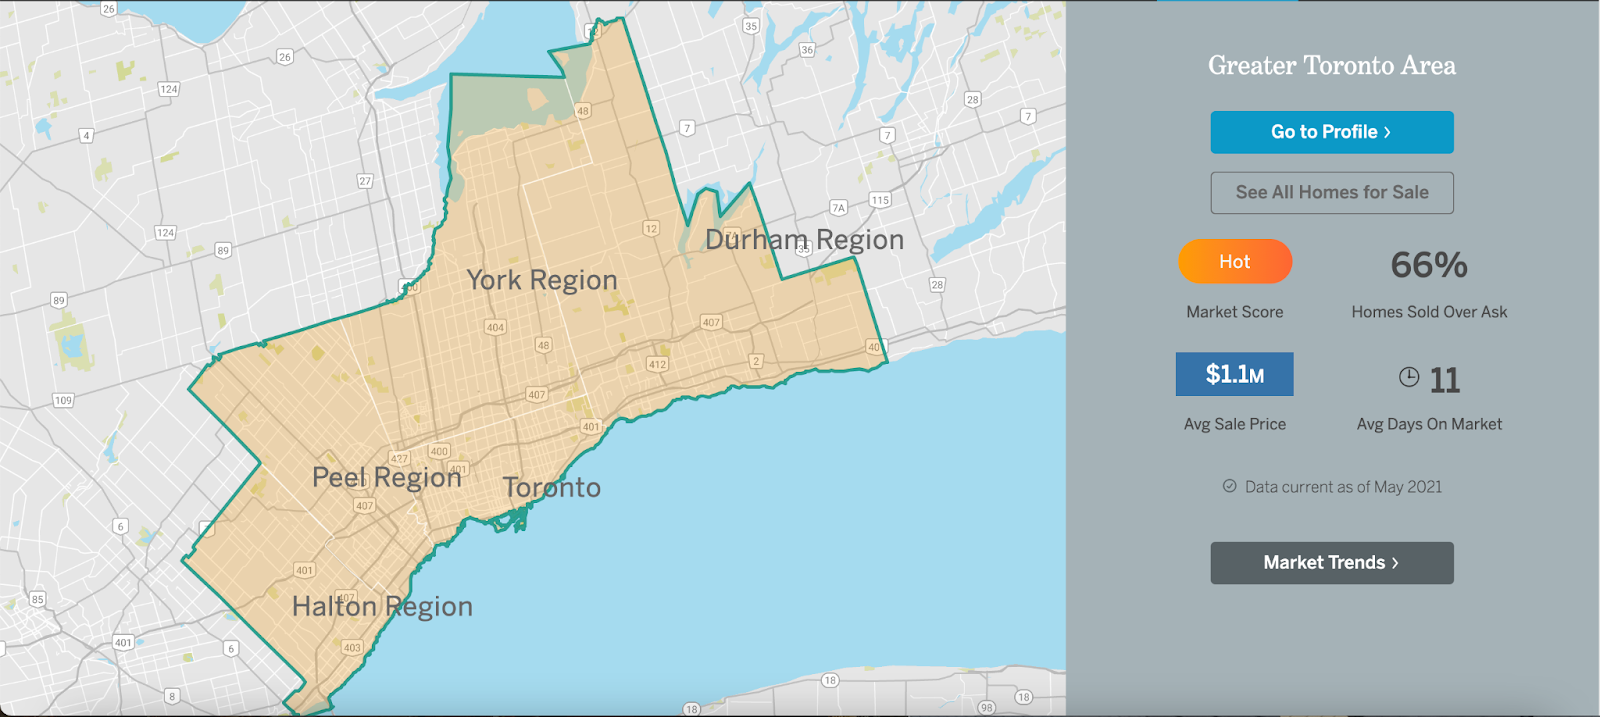
See Market Performance by Neighbourhood Map, All Toronto and the GTA
Greater Toronto Area Market Trends
LIVE ONLINE SESSION: The Market Now with John Pasalis - Next Session Wed Nov 16th 12PM ET - Sign up now!

Top Image Credit: Getty/iStock
The Move Smartly monthly report is powered by Realosophy Realty Inc. Brokerage, an innovative residential real estate brokerage in Toronto. A leader in real estate analytics, Realosophy educates consumers at Realosophy.com and MoveSmartly.com and helps clients make better decisions when buying and selling a home.
Published: November 14, 2022