
A closer look at weekly, rather than monthly numbers, reflects the same market slowdown being seen on-the-ground in the Toronto area real estate market.
As Featured in this month's Move Smartly Report:

The Market Now: By the Numbers
House Prices Rise Again, But So Does Inventory
Monthly Numbers Recap
In last month's report, I argued that the market was still hot but likely to cool, and the latest statistics for Toronto’s housing market for June confirmed that Toronto’s housing market is starting to cool down after a hot start to the year.
Average and median house prices for the latest month, June 2023, are up year-over-year for the second month in a row. (Last month marked the first time they were up since last June 2022).
Year-over-year, the average price for a house in the Toronto area was $1,451,777 in June, up 6% over the same month last year. Last month's median house price was $1,275,000, up 6% over last year (for a more detailed explanation of these two measures, see the Monthly Statistics section link below).
House sales in June were up 13% over last year, while new house listings were down 19%. The number of houses available for sale at the end of the month, or active listings, was down 7% over last year.
The current balance between supply and demand is reflected in the Months of Inventory (MOI), which is a measure of inventory relative to the number of sales each month (for a more detailed explanation of this measure, see the Monthly Statistics section link below). In June, MOI for houses increased from 1.3 in May to 1.9 in June, indicating that the market is beginning to cool.
The average price for a condominium (condo) in the Toronto Area was $767,261 in June, which is unchanged over last year. The median price for a condo in June was $693,000, down 2% over last year.
Condo sales in June were up 23% over last year, while new condo listings were down 3% over last year. The number of active condo listings was down 5% over last year. The MOI increased from 1.6 in May to 2.3 in June, indicating that the condo market is also cooling down and remains less competitive than the market for low-rise houses.

WATCH LIVE: The Market Now with John Pasalis - Thurs July 13th 2023 12PM ET
Join John Pasalis, report author, for key highlights of this month's report and responses to your questions. Sign Up Now >
Weekly Data Trends
While the year-over-year statistics continue to suggest the market is rebounding, with both average prices and number of sales are up, in times of a changing market, month-over-month trends are a better indicator of the market’s current direction.
The first sign that the market had turned a corner was when we saw the Months of Inventory (MOI) of homes available for sale begin to trend up in the second half of last month. This chart below shows the MOI by houses (low-rise) and condos, calculated weekly.
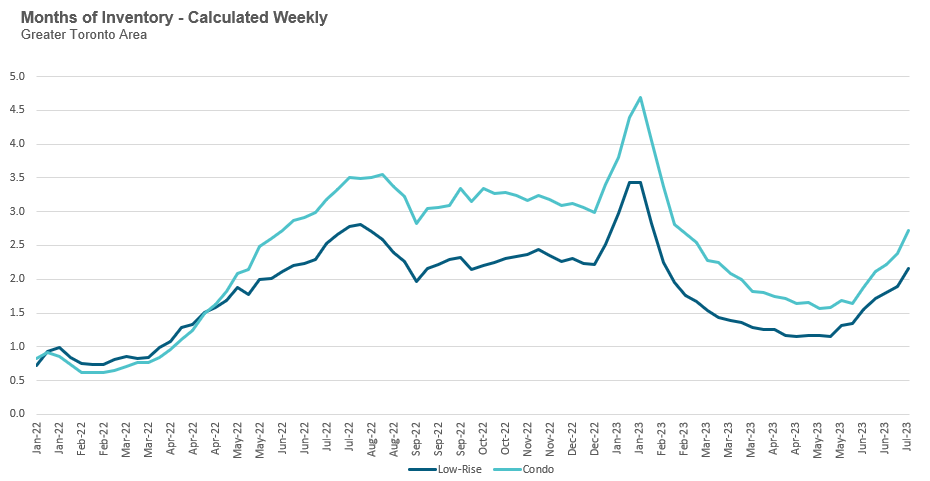
When the MOI begins to trend up, it means that the supply of new listings coming onto the market is outpacing the demand from buyers — causing inventory levels to increase.
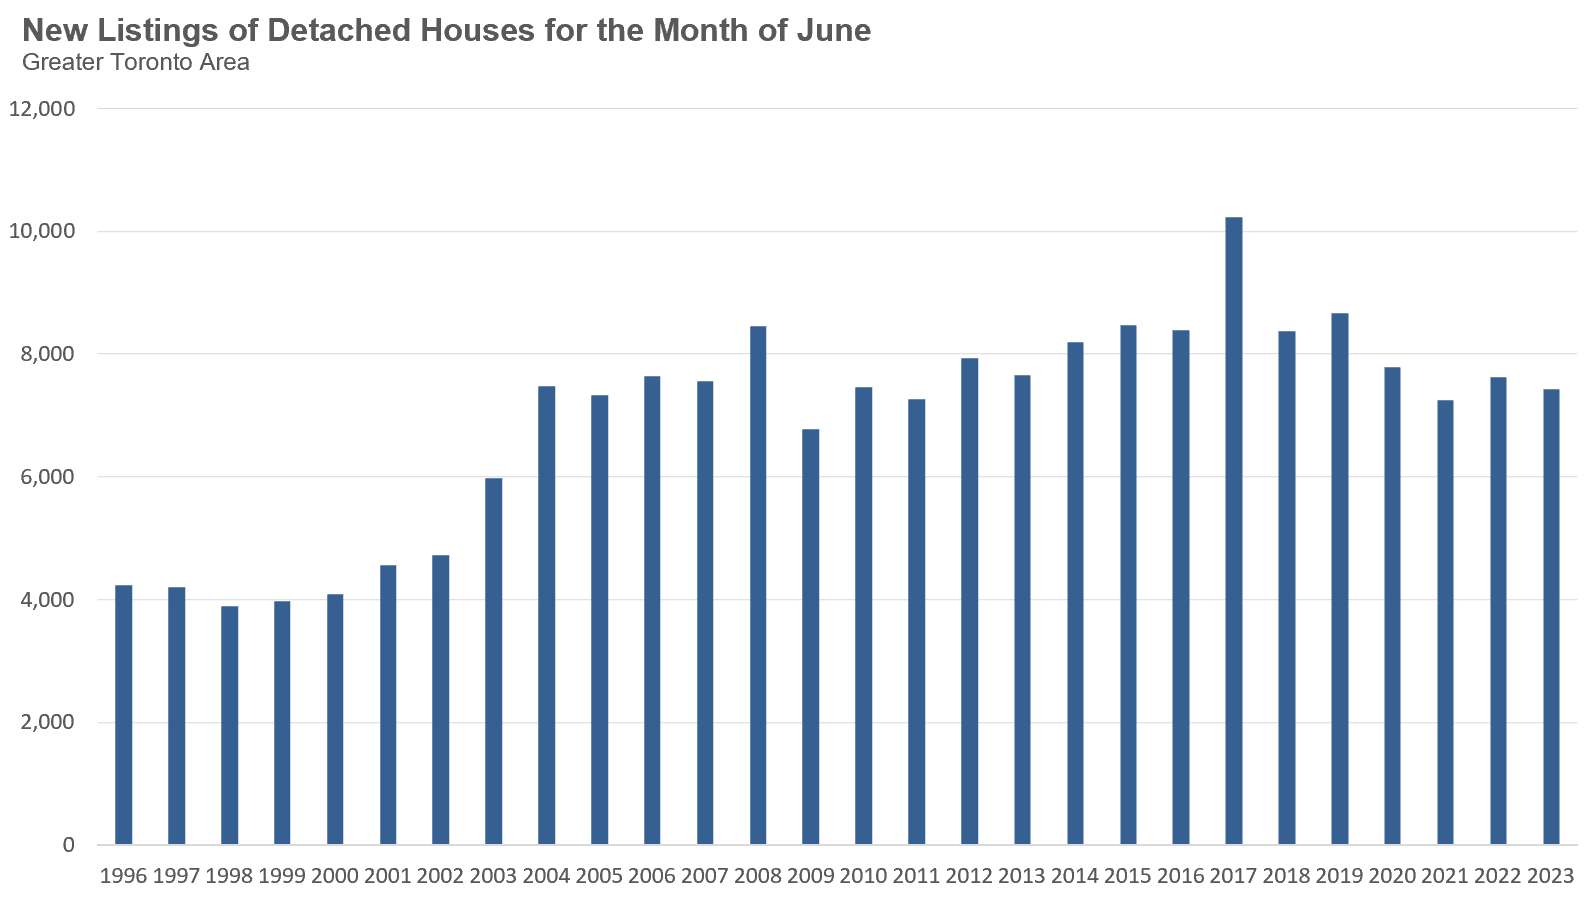
New listings have been at 20-year lows for most of this year, but we are beginning to see new listing volumes return to more normal levels. New listings of detached homes are still 10% below the previous 10-year average, but this is a notable change.
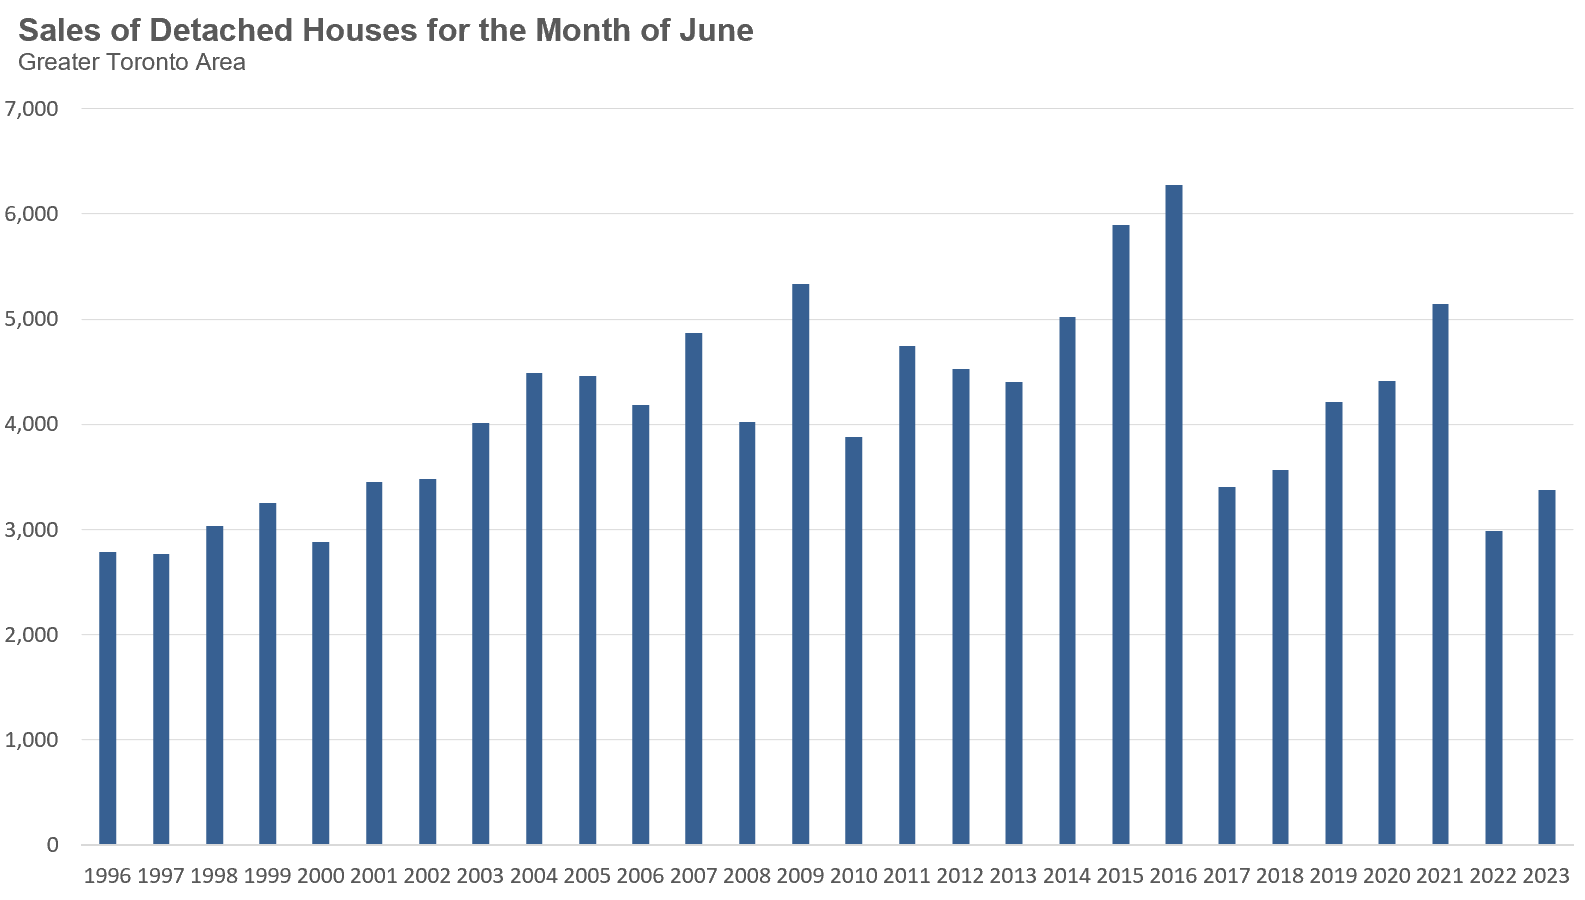
Sales of detached homes, however, have not recovered as much and are 25% below the previous 10-year average.
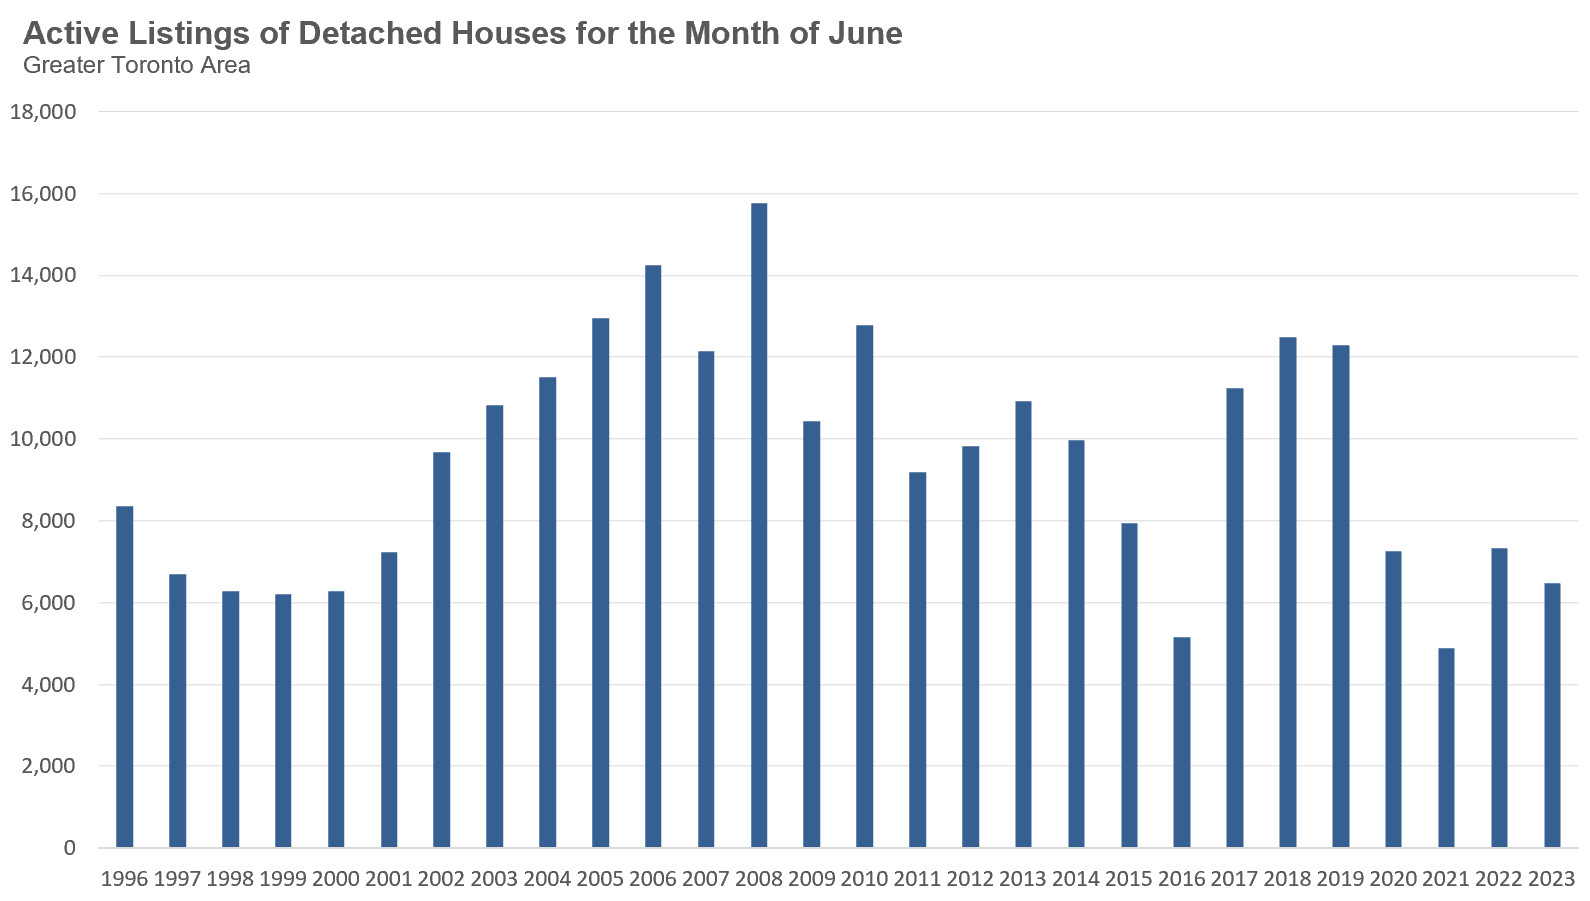
Active listings continue to be well below historical levels for the month of June, but this trend will likely reverse over time if new listings continue to outpace sales.
Unlike the market for detached homes, condo market statistics, including sales, new listings and active listings, are far more in line with the previous 10-year average for the month of June.
The Market Now: On the Ground
Sellers See Fewer Bidding Wars as Market Cools
We are also seeing the market slowdown reflected in above weekly numbers in the on-the-ground trends in the Toronto housing market as well.
When the housing market begins to cool, one of the first trends my brokerage sales team and I see is an increasing number of homes that are being listed with an artificially low price and a scheduled offer date that fails to sell on their offer night. In some cases, the home fails to sell because the seller has received no offers; in other cases, the home has received offers, but the seller was unwilling to accept any of them. In these situations, the most common next step for the seller is to increase their list (‘asking’) price (from the previous artificial low price) to a price they are actually willing to accept.
Today’s sellers need to be more mindful of how they price their home for sale. Every seller dreams of getting 20 buyers competing for their home, with the eventual winner paying way more than expected, but these types of outcomes become less common as the market slows down. Depending on the home and neighbourhood, the best strategy for a seller may be to list their home for a price they are happy with and to wait for the right buyer.
It is also important to note that many of our buyer clients have gone from being eager to buy as soon as possible to being a bit more patient in waiting for the right home as they see inventory increasing and view more homes for sale.
Given these trends, I suspect the market will remain far more balanced and less competitive in the months ahead.
For detailed monthly statistics for June 2023, the entire Toronto area market, including house, condo and regional breakdowns, see all monthly stats in the full report here.
Browse Real-Time Market Trends on Movesmartly.com:
See Market Performance by Neighbourhood Map, All Toronto and the GTA
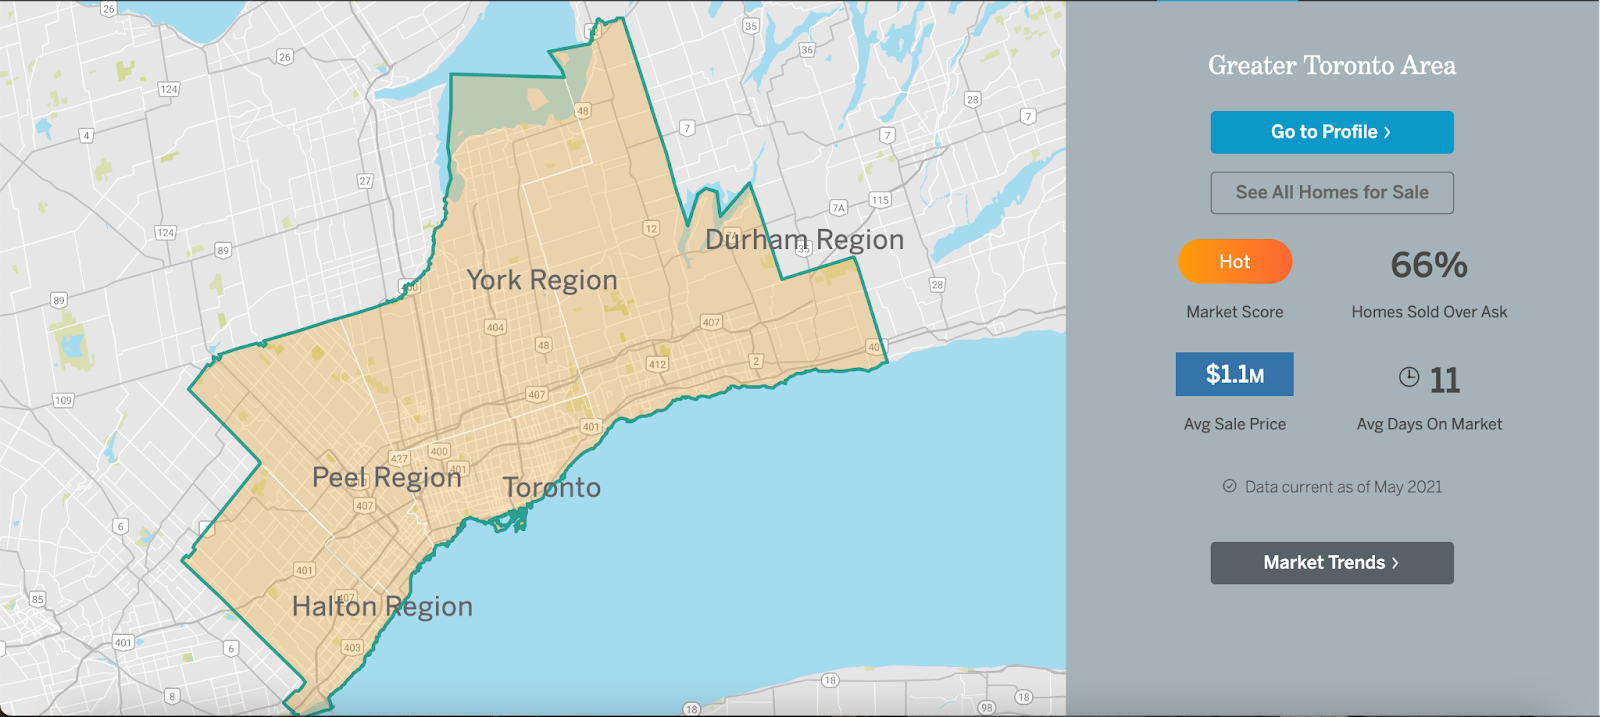
Greater Toronto Area Market Trends
Top Image Credit: Getty/iStock
The Move Smartly monthly report is powered by Realosophy Realty, an innovative residential real estate brokerage in Toronto. A leader in real estate analytics, Realosophy educates consumers at Realosophy.com and MoveSmartly.com and helps clients make better decisions when buying and selling a home.
John Pasalis is President of Realosophy Realty. A specialist in real estate data analysis, John’s research focuses on unlocking micro trends in the Greater Toronto Area real estate market. His research has been utilized by the Bank of Canada, the Canadian Mortgage and Housing Corporation (CMHC) and the International Monetary Fund (IMF).
Published: July 12, 2023


