Areas that rose the highest during the Covid-boom are falling the most.
As Featured in the monthly Move Smartly Report for August 2022 - read story below and go to report to read all stories for the month
FREE PUBLIC WEBINAR: The Market Now with John Pasalis
Join John Pasalis, report author, leading market analyst and Move Smartly contributor, and President of Realosophy Realty, and in a free monthly webinar as he discusses key highlights this month's report and answers your questions. A must see for well-informed Toronto area real estate consumers.
Register now to get recording of latest session and access to future sessions.
As discussed in this and my past few reports, Greater Toronto Area (GTA) low-rise house prices have seen a sudden and dramatic decline in prices since peaking earlier this year in February 2022.
In this month’s data dive, we will take a closer look at how much median house prices are down across each of the municipalities in the Greater Toronto Area.
The reason I’m looking at median prices for this investigation is because average prices sometimes lead to overly dramatic headlines, such as this one for King City earlier this month. Focusing on median prices allows us to measure the price changes in a way that is more indicative of actual market trends.
As I stated when sharing monthly stats recently, the median price is calculated by ordering all the sale prices in a given month and then selecting the price that is in the midpoint of that list such that half of all home sales were above that price and half are below that price. Economists often prefer the median price over the average because it is less sensitive to big increases in the sale of high-end or low-end homes in a given month which can skew the average price.
Before looking at the municipalities that have been hardest hit over the past five months, I thought it would be helpful to first look back to see which municipalities saw the biggest rise in house prices during the COVID-19 pandemic period.
Since February 2020 was the last full month of home sales before the province of Ontario introduced their first COVID-19 related lockdown, this month was used as the median pre-COVID house price for each municipality. Prices in the GTA peaked in February 2022 (and condos prices in March 2022), making the COVID housing boom period exactly two years.
The table below shows the two-year appreciation in median house prices for the municipalities in the Greater Toronto Area.
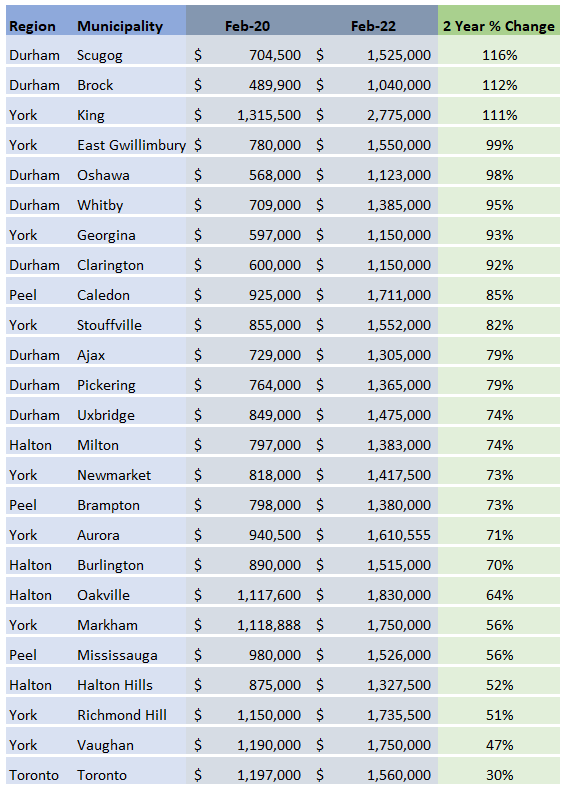
It’s worth noting that the three municipalities with the highest price appreciation typically have relatively few sales in any given month (15 to 30 sales each month), which can skew even the median. That being said, the trend is clear that many municipalities saw house prices roughly double in just two years with the worst performing suburban municipalities still showing a roughly 50% increase in prices over two years; notably, the City of Toronto saw prices rise 30% over the two years, well below the price growth seen in the suburbs.
The chart below shows the dollar and percentage decline in median house prices since the peak in February 2022. Note that many of the regions that saw the most rapid increase in prices (in the table above) are seeing the biggest decline in price in this table below.
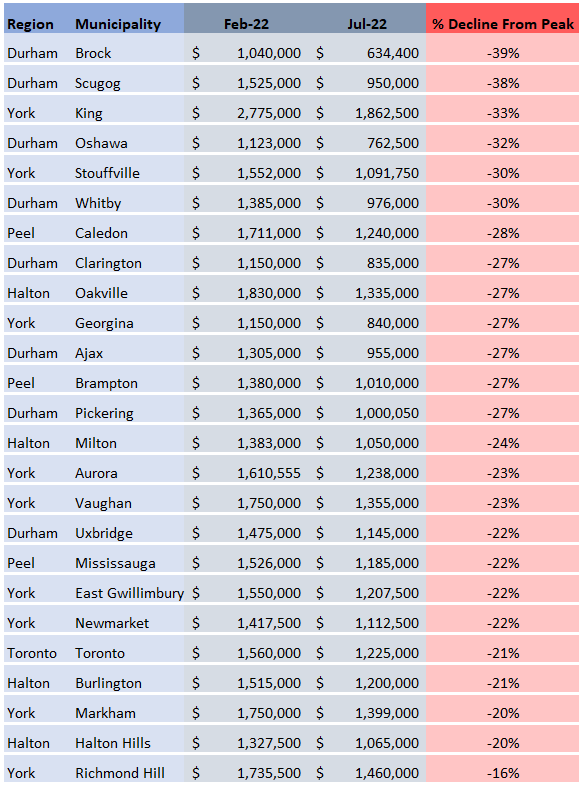
If we look to see which municipalities have median house prices today that are closest to their pre-COVID level, there’s only one municipality that stands out — the City of Toronto.
Median house prices in the City of Toronto in July of this year were just $28,000 above their pre-COVID level in February 2020. Even though the City of Toronto’s 21% decline in median prices was among the lowest in the GTA, the 21% decline set prices back to just above their pre-COVID level because the city had the lowest rate of appreciation of all the municipalities during the COVID boom.
The following charts compare the median house price for each municipality in February 2020 (pre-COVID), February 2022 (the Covid-boom market peak) and last month.
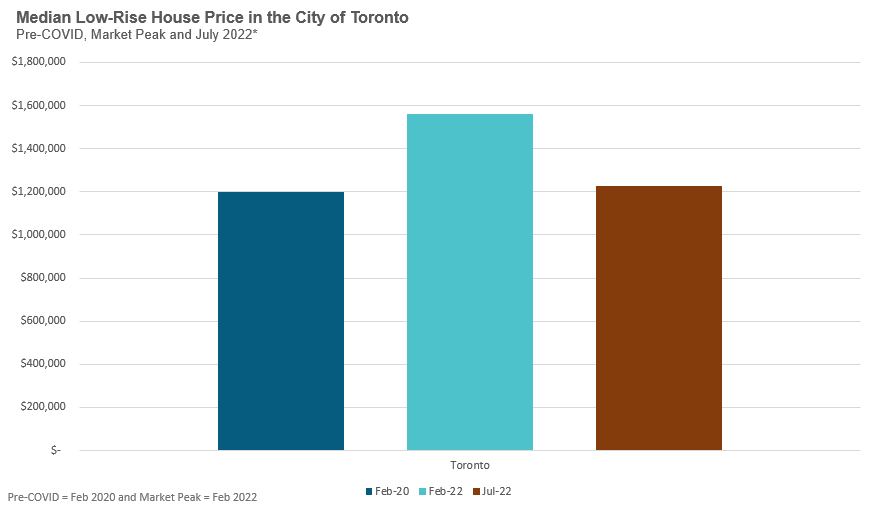
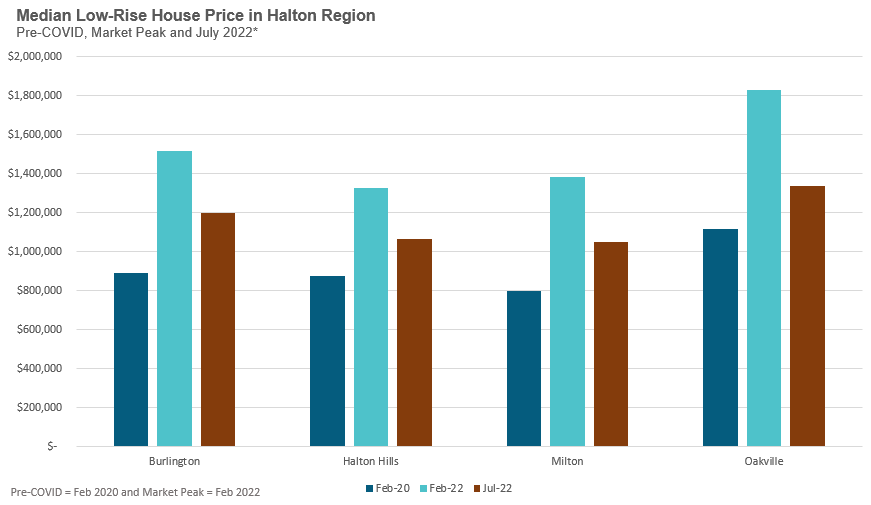
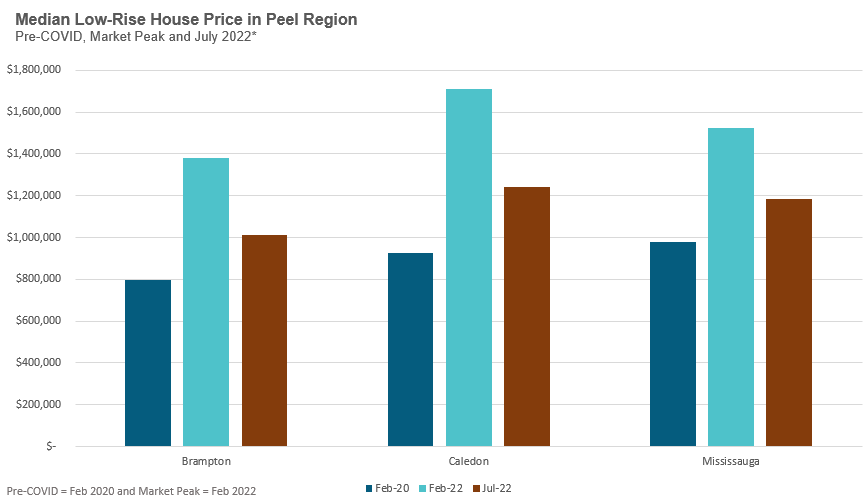
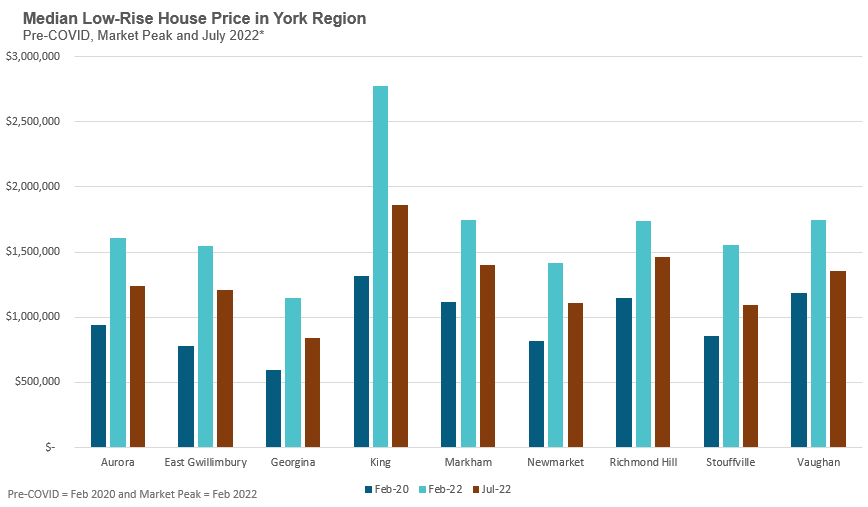
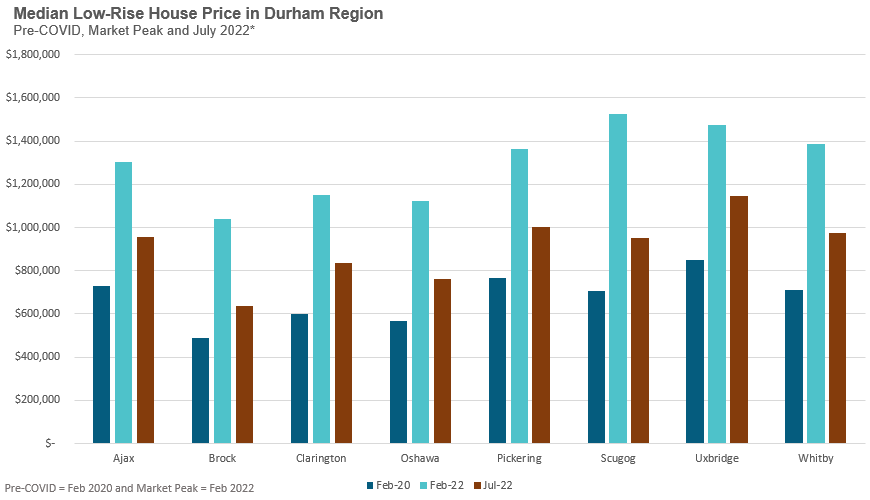
As these charts again show, municipalities that have experienced the biggest price rises during the boom have experienced the biggest drops — as we move into the fall market, we will need to see if prices begin to fall further to erase more of the gains seen during the boom throughout the GTA, or begin to stabilize as consumers begin to adjust to our 'new normal'.
.png?width=600&name=Public%20Webinar%20%E2%80%93%20July%202022_MoveSmartly_%20600x300%20(3).png)
Top Image Credit: Getty/iStock
The Move Smartly monthly report is powered by Realosophy Realty Inc. Brokerage, an innovative residential real estate brokerage in Toronto. A leader in real estate analytics, Realosophy educates consumers at Realosophy.com and MoveSmartly.com and helps clients make better decisions when buying and selling a home.
John Pasalis is President of Realosophy Realty. A specialist in real estate data analysis, John’s research focuses on unlocking micro trends in the Greater Toronto Area real estate market. His research has been utilized by the Bank of Canada, the Canadian Mortgage and Housing Corporation (CMHC) and the International Monetary Fund (IMF).
Published: August 31, 2022