
Toronto’s housing market continued to cool as we moved towards the end of the summer season.
As Featured in this month's Move Smartly Report:
The Market Now: By the Numbers
Toronto Area Listing Increasing
Monthly Numbers Recap
Toronto’s housing market continued to cool as we moved towards the end of the summer season.
Year-over-year, the average price for a house in the Toronto area was $1,328,313 in August, up 1% over the same month last year, but down 10% since May. Last month's median house price was $1,160,000, up 5% over last year.
House sales in August were down 12% over last year, while new house listings were up 17%. The number of houses available for sale at the end of the month, or active listings, was up 27% over last year.
The current balance between supply and demand is reflected in the Months of Inventory (MOI), which is a measure of inventory relative to the number of sales each month (for a more detailed explanation of this measure, see the final section of this report). In August, MOI for houses increased to 2.9, a sharp increase from 1.3 in May, just three months ago, indicating a slowing market.
The average price for a condominium (condo) in the Toronto Area was $737,582 in August, which is up 1% over last year. The median price for a condo in August was $675,000, unchanged over last year.
Condo sales in August were up 8% over last year, and new condo listings were up 22% over last year. The number of active condo listings was up 25% over last year. The MOI increased to 3.4. Much like the market for houses, this is a rapid increase from 1.6 in May, indicating a slowing.
For detailed monthly statistics for August 2023, the entire Toronto area market, including house, condo and regional breakdowns, see the final section of this month's Move Smartly market report.

WATCH LIVE: The Market Now with John Pasalis - Thurs August 10th 2023 12PM ET
Join John Pasalis, report author, for key highlights of this month's report and responses to your questions. Sign Up Now >
The Market Now: On the Ground
Toronto’s Precarious Fall Market
August is typically a relatively quiet month for Toronto’s housing market since many buyers hit pause to enjoy the summer weather, but the decline in sales in the Toronto area’s housing market last month was not just about a seasonal dip in sales.
When we look at the number of homes sold for the month of August back to 2000, we see that home sales this year were at a 20-year low.

What’s driving this decline in sales?
Before June 2023, the sentiment among home buyers in the Toronto area was relatively optimistic, driven by an expectation that the Bank of Canada (BoC) was done raising their policy rate and would be cutting interest rates sooner rather than later. The BoC’s decision to increase its policy rate in June 2023 shifted the sentiment overnight. This change in sentiment, coupled with an increase in fixed-rate mortgages, rapidly cooled the demand for homes.
Today’s home buyers are paying over 6% for a mortgage, which has weighed on people’s ability to afford today’s home prices.
On the other hand, new listings for August are in line with historical levels. On the ground, we are beginning to see more owners listing their investment properties for sale to deleverage.

The 20-year low in sales and a strong volume of new listings have helped drive up the number of homes available for sale (see the Data Dive section in this month's Move Smartly market report).
One important trend we will need to keep a close eye on in the months ahead is the volume of new listings coming on the market for sale. If the volume of new listings accelerates well above historical norms, and sales remain at 20-year lows, this could put pressure on home prices in the months ahead.
This delicate balance between sales and new listings will drive the future path of home prices during the fall market.
But one important fact to remember is that the trends we observe for the GTA do not necessarily reflect what is going on in every region or house type.
Any imbalance between supply and demand can vary significantly across regions and house types. For home buyers and sellers, it will be important to understand the local market dynamics in the areas you’re considering.
Monthly Statistics: August 2023
For detailed monthly statistics for August 2023, the entire Toronto area market, including house, condo and regional breakdowns, see all monthly stats in the full report here.
Browse Real-Time Market Trends on Movesmartly.com:
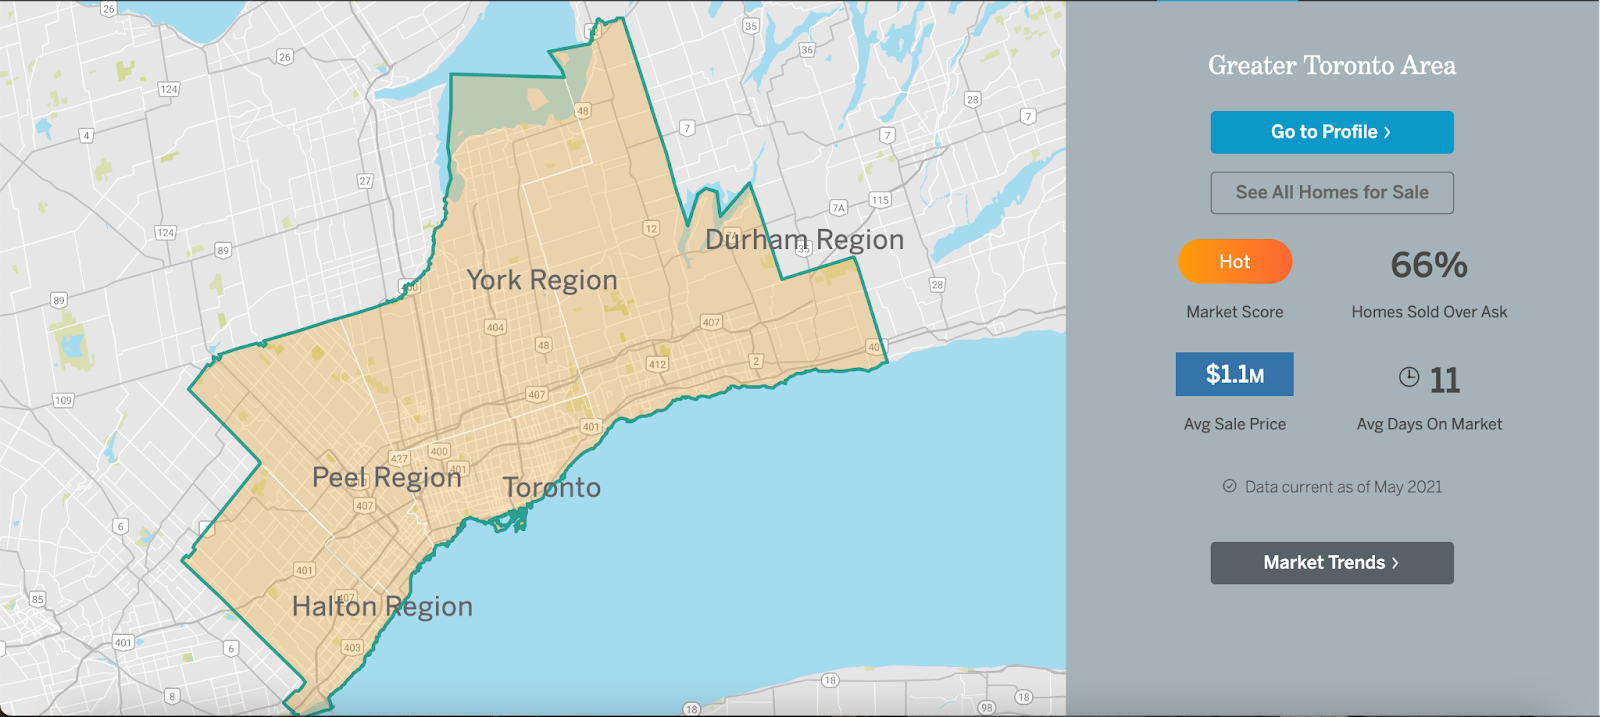
See Market Performance by Neighbourhood Map, All Toronto and the GTA
Greater Toronto Area Market Trends
Top Image Credit: Getty/iStock
The Move Smartly monthly report is powered by Realosophy Realty, an innovative residential real estate brokerage in Toronto. A leader in real estate analytics, Realosophy educates consumers at Realosophy.com and MoveSmartly.com and helps clients make better decisions when buying and selling a home.
John Pasalis is President of Realosophy Realty. A specialist in real estate data analysis, John’s research focuses on unlocking micro trends in the Greater Toronto Area real estate market. His research has been utilized by the Bank of Canada, the Canadian Mortgage and Housing Corporation (CMHC) and the International Monetary Fund (IMF).
Published: September 12, 2023


