MoveSmartly_Mar2021_Report-Cover
Download a PDF version of this guide.
Download Report

Chapters

1

Toronto Market Now: Signs of 'Excessive Exuberance'

2

Key Issue: Does Toronto Have a Home Supply Problem?

3

Key Issue: Are the Bank of Canada and CMHC Fuelling a Housing Bubble?

4

Data Dive: The Incredible Turnaround of Toronto's Condo Market

5

Monthly Statistics

Get Our Monthly and Special Reports in Your Inbox.

Have questions about this unpredictable market? John is hosting a monthly webinar for past and present clients of Realosophy Realty. Hear key takeaways from this month's report and get answers to your questions.

Sign Up Now

The Market This Month

The Toronto Area housing market continues to boom, with the market for houses particularly showing signs of ‘excessive exuberance’ amongst buyers.

In February, house (detached, semi-detached, townhouse) sales were up 46% over last year (2020), and have doubled when compared against 2018 and 2019 sales volumes. Months of Inventory (MOI) remains low at 0.8 (a seller’s market) and 79% of houses sold for more than the seller’s asking price.

On a more positive note for buyers, house price increases are moderating slightly with a 21% increase over last year (compared to the 29% year-over-year increase seen last month). House prices in the City of Toronto were up by just 12% which helped pull down the overall average. We also saw little to no change in average suburban house prices from January to February.

Turning to the Toronto area condominium (condo) market, sales for condos were up 52% over last year continuing a rebounding trend that began in December (see ‘The Data Dive’ in this report). 48% of Toronto area condos sold for more than the seller’s asking price. Year-over-year average condo prices fell in 2020, but since then have recovered with the average condo price last month now the same year-over-year. The MOI for condos is perhaps most indicative of this turnaround, having decreased from 3.5 in November (a balanced market) to 0.8 in February (a seller’s market).

“Where Have all the Houses Gone?” asked a New York Times headline last month, noting the significant decline in the number of homes available for sale (the inventory of houses) in many U.S. cities.

Similar questions have been raised about Toronto’s housing market over the past six months as low inventory levels have led many economists and housing analysts to conclude that reluctant sellers are the problem as this Toronto Star article notes “sellers don’t want strangers traipsing through their homes in a pandemic and that is causing people to hold off listing.”

But many are confusing inventory with supply. The inventory of houses reflects the number of properties available for sale at any given point in time, usually measured at the end of a month. The supply of new listings refers to the number of properties being listed for sale by sellers each month.

Toronto’s housing market during the Covid-19 pandemic has not had a shortage of supply. Since June 2020, new listings have been up by 31% year-over-year and last month alone new listings were up 43%.

Inventory levels are low because the demand for houses amongst buyers is significantly outpacing the supply of new listings. Housing supply can never respond fast enough when sales are rising 50% over last year. What we are seeing today is a demand shock caused by Covid-19 related shifts in demand (for larger homes, etc.), record low interest rates and an irrational exuberance in the market (more on this in the next section).

Once this demand shock is behind us, I suspect Toronto’s housing market will not look as undersupplied as it does today.

“What we get worried about is when we start to see extrapolative expectations, when we start to see people expecting the kind of unsustainable price rises we've seen recently go on indefinitely, and they're basing their decision on those kinds of assumptions. … When we see people starting to buy houses solely because they think prices are going to go up, that is a warning sign for us. We are starting to see some early signs of excess exuberance.”

- Bank of Canada Governor Tiff Macklem

Last month, both Bank of Canada Governor Tiff Macklem and the Canadian Mortgage and Housing Corporation (CMHC) CEO Evan Siddall indicated that they are concerned by “extrapolative expectations” and “excess exuberance” in the housing market — a concern I first wrote about in my December 2020 Move Smartly report.

While policy makers are concerned about the types of narratives Governor Macklem notes above, they must also ask themselves if they have played a role in creating these narratives, an issue I discussed on a recent BNN Bloomberg interview.

To be clear, I’m not suggesting that policy makers caused the boom we are seeing in the housing market today. This has been largely driven by a Covid-19 pandemic-induced change in consumer preferences which is pushing buyers out of cities and into the outer suburbs in search of larger homes with bigger backyards. But the “Covid urban exodus” is not the entire story.

Most critics of policy makers have argued that the monetary and fiscal policy measures introduced at the start of the pandemic have overstimulated the economy. Of course, hindsight is 20/20, and at the time of the unprecedented economic lockdowns necessitated by the unprecedented nature of Covid-19, these fiscal and monetary measures were understandably deemed to be necessary.

It’s worth noting that the federal government made the prudent decision to delay their planned easing of the stress test which was scheduled to take effect in April 2020. The change would have made the test more dynamic ensuring that the mortgage qualifying rate is roughly 200 basis points above the average mortgage rate. As it stands today, home buyers are qualifying for their mortgage at a rate that is roughly 300 basis points higher than today’s mortgage rate. Even though mortgage rates have declined due to Covid-19, this decline did not materially impact how much home buyers can borrow.

That said, we still find ourselves with a booming housing market in Toronto and across Canada. Can new macro-prudential policies be introduced to help cool the housing market now? Certainly. However, I think policy makers continue to make their biggest mistakes in what they are saying or ‘signalling to the market’, not what they are doing policy-wise.

The difference between a housing boom and a housing bubble has less to do with a specific policy and more to do with the beliefs of buyers — specifically the belief that home prices will keep going up at a rapid rate indefinitely and if they don’t hurry up and buy now, they’ll never be able to afford a home. These are the same beliefs Governor Macklem raised concerns about last month.

These types of narratives can impact home buying decisions in a number of ways.

It typically leads to rapidly rising prices because home buyers believe that they need to pay 5% more than what a similar home sold for last month just to “get into the market” and win a home — especially when they find themselves competing with 50 other buyers for a home. This is largely the reason why home prices are rising by over 30% per year in many of the Toronto area suburbs at present.

Another side effect is that it can accelerate many first time buyer’s home buying decisions. A home buyer who was planning on buying a home in 2022, for example, will instead decide to move up their plans and buy immediately when they see prices rising 20-30% per year. It’s the only rational response when they believe homes will be significantly more expensive a year from now.

So what does a home buyer’s irrational exuberance have to do with the Bank of Canada and CMHC?

Most economists continue to believe that home buying decisions are driven entirely by rational factors like policy and macroeconomic changes in the market. In effect, home buyers are a bunch of “rational actors” who simply respond to what policymakers do, such as introduce mortgage stress tests, in an orderly and predictable way. Pull the policy lever down — more buyers buy homes. Push the policy lever up — fewer buyers buy homes.

Behavioural economists on the other hand don’t believe that we are as rational and predictable as economists like to think we are. They believe that our decision making is prone to biases and that collective narratives and beliefs can play a big role in our decision making.

In his book, Narrative Economics, economist Robert Shiller unpacks how narratives can drive major economic events.

So how have policy makers shaped the beliefs and narratives we are seeing in the market today? I’ve touched on some of these issues in past reports, but I’ll summarize them here for clarity.

The Belief: House Prices Can Only Go Up!

In 2020, at the height of the first round of Covid-19 lockdowns, CMHC forecasted that home prices in Canada will fall 9 to 18%.

The problem with CMHC’s messaging at the time was that their reports didn’t suggest that prices might fall, they said prices will fall. They were so certain of their view that they suggested that home buyers should question the motivation of anyone who suggests otherwise as merely “whistling past the graveyard.”

Many Canadians took the cautious narrative seriously.

When prices didn’t fall and instead accelerated rapidly in the third and fourth quarters of 2020, the narrative changed dramatically. The narrative Canadians took away from CMHC’s promise of a collapse in home prices was that if an incredibly deep, unprecedented pandemic-induced recession can’t take Canada’s housing market down, nothing will!

The Belief: Home Prices Aren’t Too High, There’s Nothing to Worry About!

By September 2020, it was clear that a housing market crash was not going to happen, sales were up by over 40% and prices were rising by double digits.

This is the time when CMHC should have stepped up to caution against exuberance in the market — but they didn’t. In September 2020, they were still sticking to their incorrect forecast telling people that prices were primed for a decline.

Not only did CMHC’s warning of future price changes get the direction wrong (they should have warned about rapid acceleration vs a decline) they actually concluded in December 2020 that there was low-risk of price acceleration, overheating or overvaluation in Toronto.

The Bank of Canada shared a similar narrative. Last month was the first time they expressed any concern about “early signs” of exuberance in the housing market, but even that was met with little concern; in response to house prices rising by over 30% in many Canadian cities, Governor Macklem had this to say last month: “[W]e’re a long way from where we were in 2016-2017 when things were really hot.”

The Belief: Prices Will Keep Going Up!

The Bank of Canada has had a consistent message since the start of the pandemic — interest rates will remain low for a long time and the Bank has a lot of policy tools available to ensure that the economy and housing market continue to boom.

Our central bank is effectively telling home buyers and investors that they will do everything possible to keep the housing boom going. They have made cheap money and rapid house appreciation the “new normal” which is materially influencing how home buyers behave.

These narratives and beliefs about the future direction of home prices lead home buyers to speed up their buying plans and have helped to push prices up by over 30% in the Toronto Area suburbs.

In a recent thoughtful Twitter thread, CMHC CEO Evan Siddall did acknowledge that CMHC could have been clearer about their forecasts.

“We meant to contribute to a discourse, even though it was hard to be precise about future. In hindsight, we could have made that clearer.”
— Evan Siddall

Because it’s always easier to criticize rather than offer a solution, I’m regularly asked what policy makers can do to cool the housing market and my answer is the same. The first and most effective thing they can do is to stop telling Canadians there’s nothing to worry about when it comes to our housing market. Do tell us that our government is concerned about the rapid acceleration in prices and if the market doesn’t cool down naturally, it will introduce policies that aim to cool the market.

This change in narrative alone may be enough to take a considerable amount of heat out of the market while policy makers research and plan potential policy measures.

While the Toronto Area’s hot suburban housing market has received most of the media attention lately, the City of Toronto’s volatile condo market over the past year deserves further discussion.

Toronto’s condo market went on a wild roller coaster ride over the past twelve months. The wild swings in the market have had a lot to do with rapid changes in demand and supply happening at different points over the past twelve month period.

First, it helps to understand the basic storyline before looking at any charts because the charts are difficult to interpret without understanding the general context around the swings in supply and demand throughout the year.

Toronto’s condo market was incredibly competitive leading up to the first quarter of 2020. Inventory levels were gradually declining from two months of inventory at the start of 2019 to one month of inventory in the first quarter of 2020.

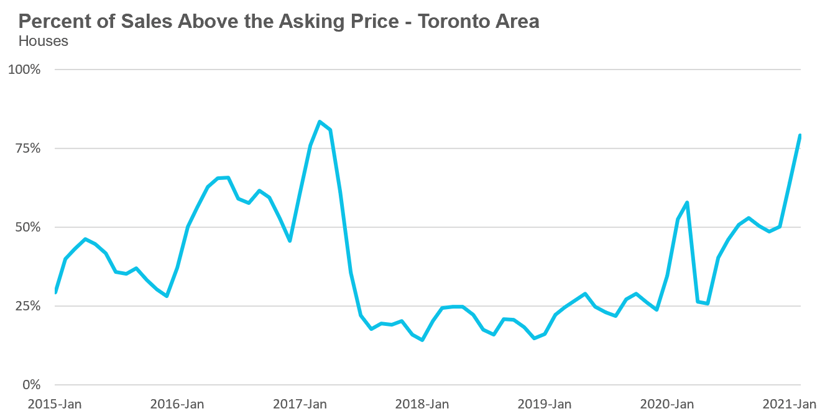
Then in February 2020, something strange happened. The condo market went from being very competitive to a speculative frenzy. All of a sudden there was an incredible urgency on the ground from home buyers and investors wanting to buy a condo. For all of 2019 and the first month of 2020, roughly 30% of condo units were selling for above the seller’s asking price. In February 2020, that ratio went up to 57% and by March it peaked at 64%.

The share of properties selling above the seller’s asking price is a good barometer of frenzy in the market. It serves as a decent proxy for the additional demand — the shadow demand — in a market that is not captured by the number of sold transactions alone. By shadow demand, I mean the thousands of buyers bidding on a property each month who did not successfully make a purchase. The higher the share of sold properties over asking, the higher the shadow demand.

As buyers pulled out of the market in April 2020 due to the first round of the Covid-19 lockdowns, this pushed up the inventory of available condominiums from an MOI of 1 in March to an MOI of 3.7 in April 2020. (As a quick reminder MOI, or Months of Inventory, is the amount of time it would take for every home currently on the market to sell assuming no new homes came on the market for sale).

By June 2020, condo buyers returned to the market and by July the MOI had fallen to just over 2. Even though new listings were also picking up in June and July, demand was strong enough to keep the overall inventory level down.

But in August the number of condos listed for sale surged, up by over 100% from the previous year, and were up by over 80% in September and October.

This spike in new listings cooled the condo market and again pushed the MOI back up to 3.

The interesting thing about this period between September and November of 2020 is that the on-the-ground-experience of sellers and their agents was far more bleak than these three months of inventory would suggest.

An MOI of 3 is normally a relatively balanced market with homes selling, but without as many bidding wars.
But in actuality, condos for sale were struggling to even get showings (visits from buyers and their agents) during this period. Agents were lucky if two to three buyers would visit their condo listings in any given week.

Condos that would have received ten offers just six months ago were languishing on the market for months with very few showings.

Why did condo listings spike in the third quarter of 2020? While I have not analyzed the data closely enough to answer this with more certainty, I can suggest some potential reasons.

Firstly, the condo rental market was also struggling during this period, as Covid-19 impacts saw many renters move out of their units to move in with family and friends given the shutdown of many work and education settings, resulting in a surge of rental listings and falling rents. Some investors likely decided to take their money off of the table by selling their units at that time.

Similarly, condo investors who were using their units as Airbnb rentals to generate income likely had their units vacant since the onset of the Covid-19 pandemic and the virtual standstill of travel and tourism.

Combined with the City of Toronto’s new policies limiting Airbnb rentals to one’s principal residence, some of these investors may have also decided to list their units for sale.

Finally, it’s likely that a number of condo owners who lived in their units as a primary residence decided to sell and move to a larger single family house with more outdoor space as a result of the need for entire families to work, study and live from home together due to Covid-19.

While the prospects for the condo market looked bleak as late as November, we once again saw a dramatic shift in the market.

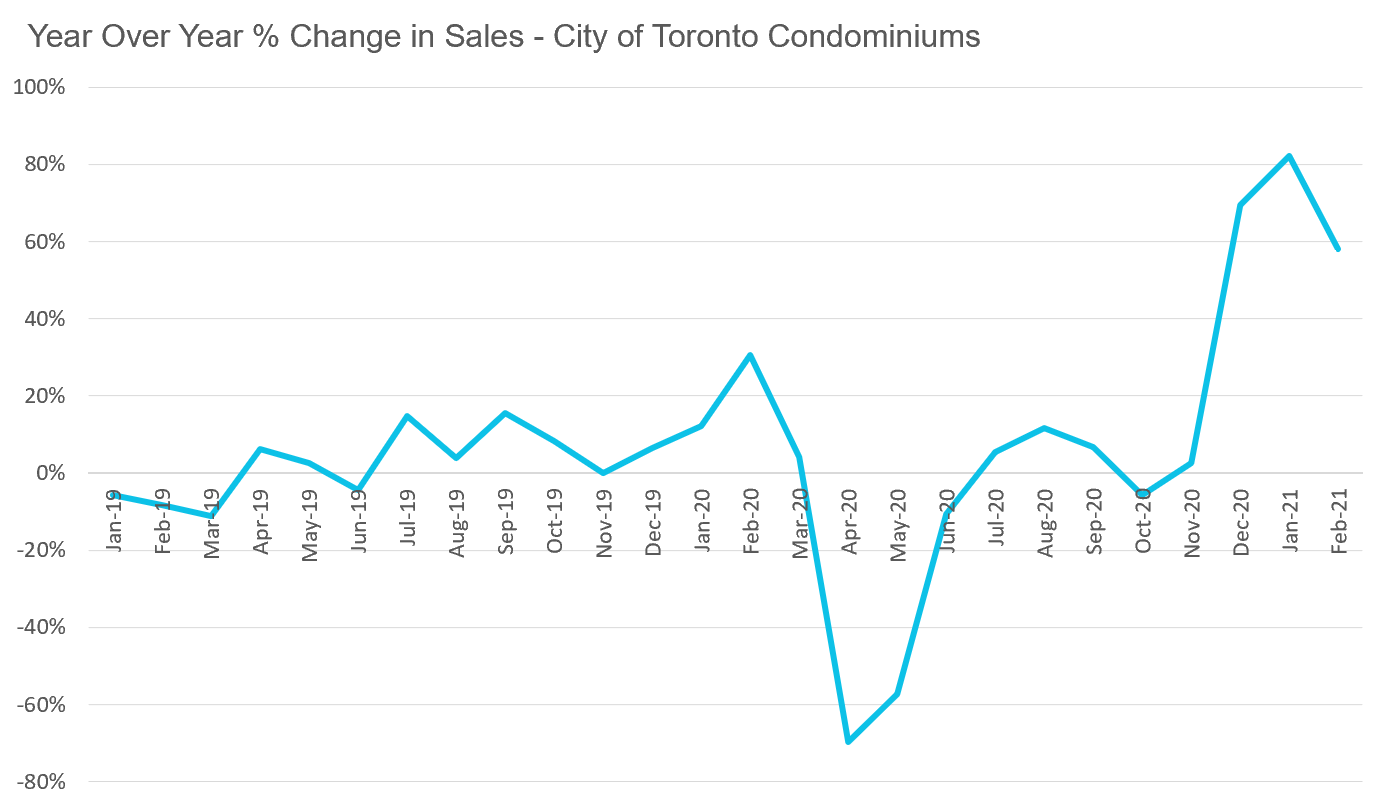
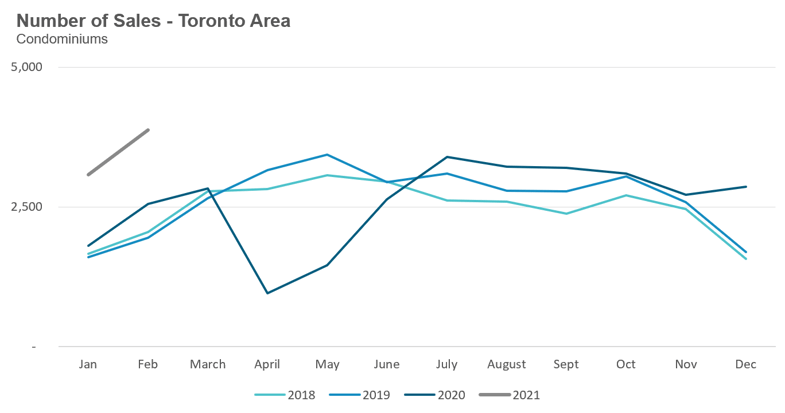
The very next month, condo sales were up 69% over the previous year and this trend continued into the new year. Condo sales in January were up 82% year-over-year and up 58% in February.

This dramatic surge in demand pushed condo inventory levels from an MOI of 3.5 in November to under 1.0 in February.

In February of this year, 41% of condominiums sold for more than the seller’s asking price. Aside from the peak of the market in February and March 2020, this is the highest share of transactions selling for more than the seller’s asking price since 2017.

The next question is what is behind this surge in demand in Toronto’s condo market over the past three months? I’m confident that the biggest driver of this change is renewed demand from condo investors.

When looking at the number of condo sales during this three month condo boom from December 2020 to February 2021 against the same three month period in the previous year by unit size, we can see that the biggest increase in sales was for small condo units under 600 sq. ft. These tend to be the units that investors are most interested in.

1_DataDive_CondoSqft

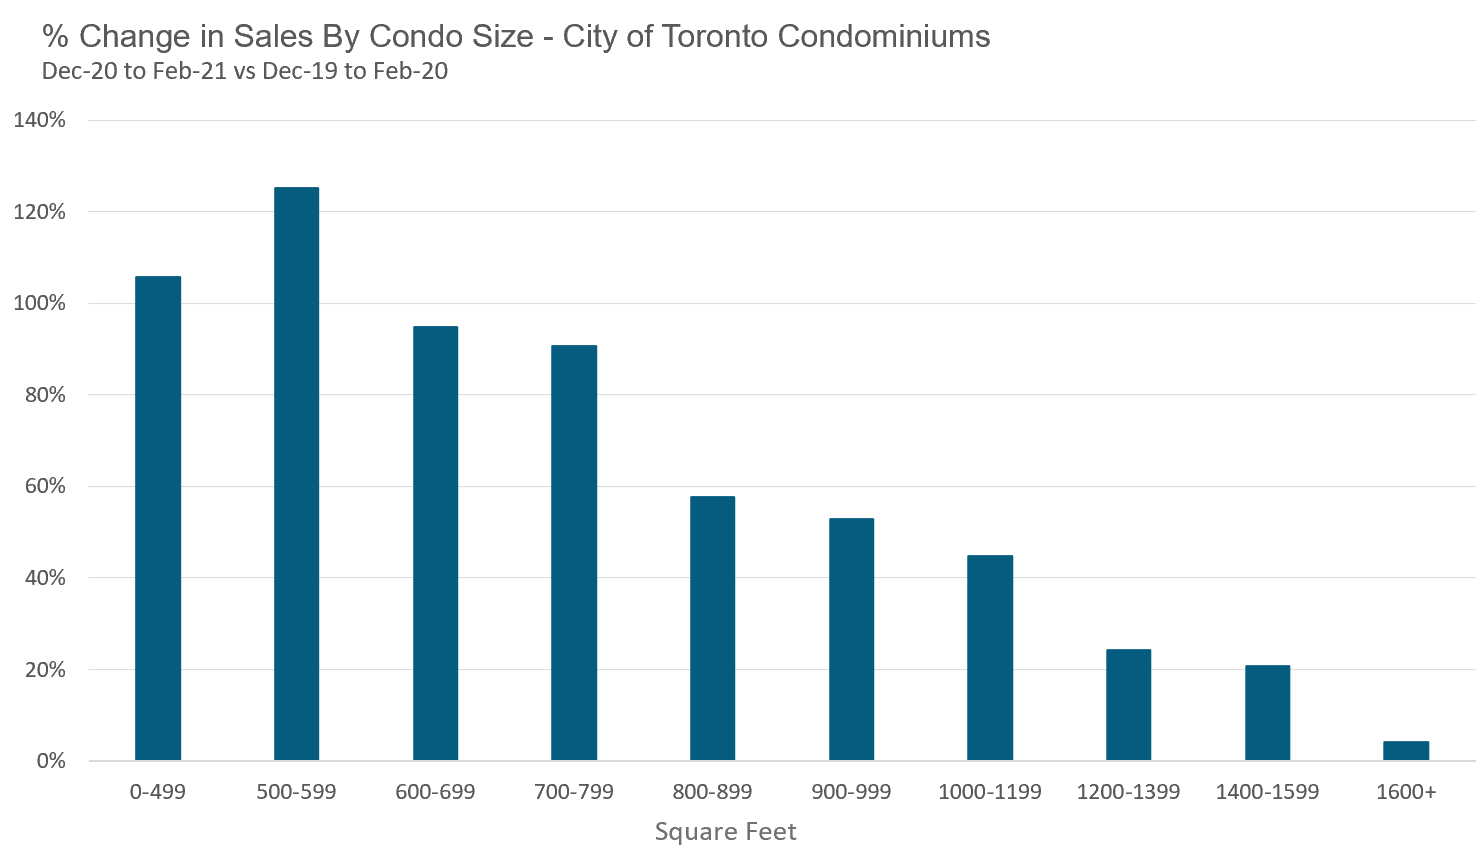
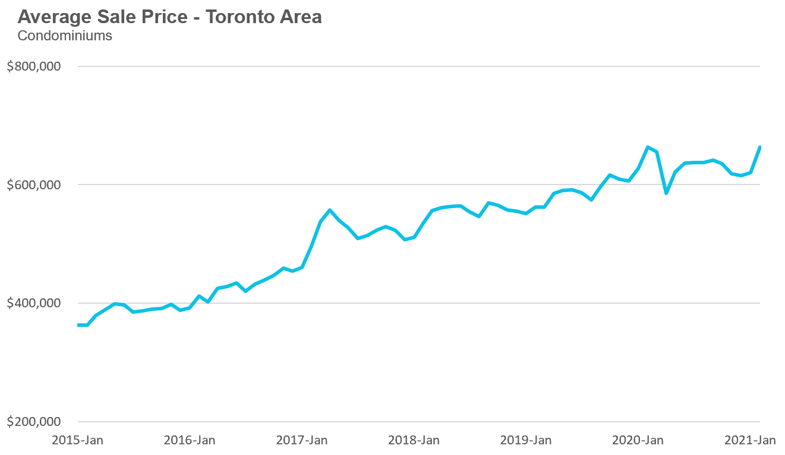
This demand from investors was driven by a number of factors. Firstly, condo prices in Toronto had fallen by roughly 10% from their peak in the first quarter of 2020 so investors jumped in to “buy the dip,” as they sought value.

Secondly, by late November 2020, there was more news and projected timelines for the roll-out of the Covid-19 vaccine with the hope that the majority of Canadians would be vaccinated by September 2021. This left investors feeling confident that demand for condo rentals would return later this year; the surge in house prices in the suburbs also reinforced the perception that it was only a matter of time before condo prices would start to rebound.

What’s next for the condo market?

I suspect this surge in demand from investors will continue and will push prices up with it.

Investors are listening to and will follow the messages they are getting from Ottawa:

Money is cheap, and it’s going to stay that way for a long time.

House prices are not too high – they have room to go higher.

Policy makers have plenty of tools to ensure this housing boom continues.

We’ll see where this all leads us.

Now, we’ll take a look at a few charts highlighting the roller coaster year for condos.
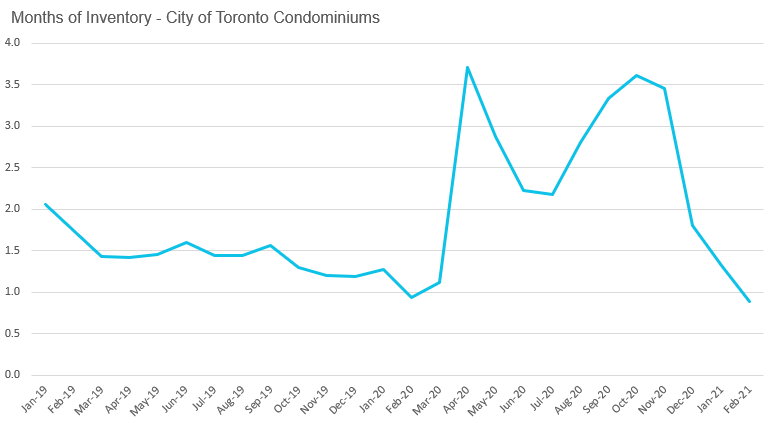
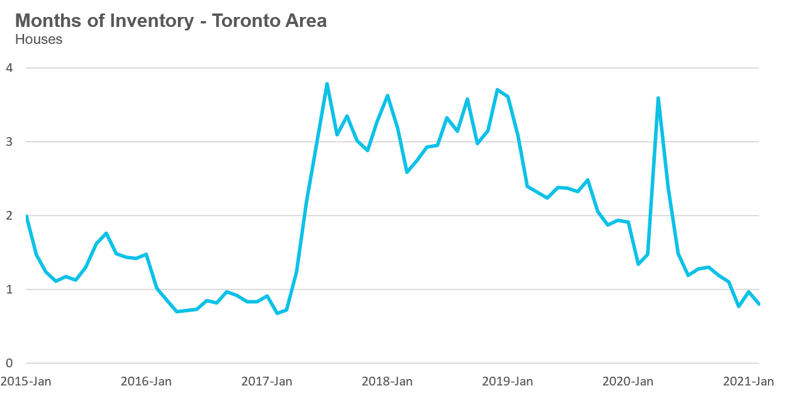
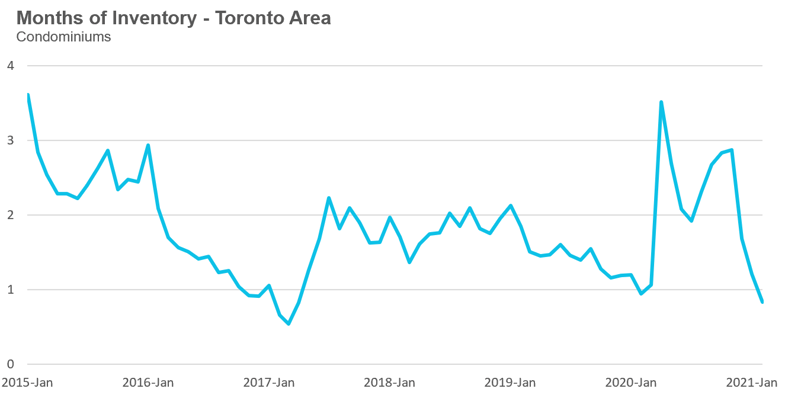
Since MOI is a measure that includes both the supply and demand at any given point in time, it does the best job of capturing the volatility in the condo market over the past twelve months.

The MOI declining right up to the onset of the Covid-19 pandemic in March 2020 was a sign of the market heating up. We then see MOI spike at the start of the pandemic-induced lockdown. MOI started to decline again in June and July, rising in August due to the surge in new listings, then decline rapidly again as sales picked up beginning in December 2020.

2_DataDive_MOI

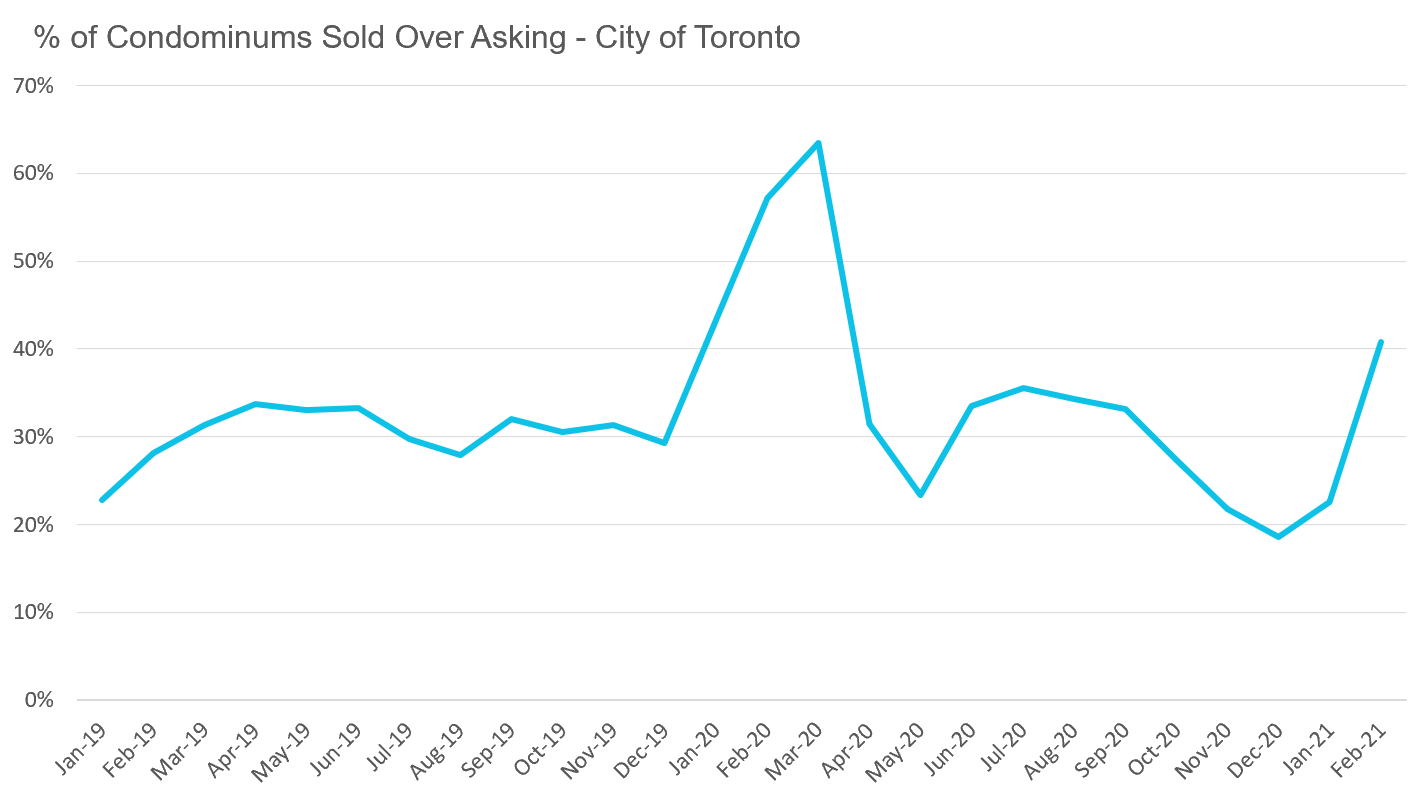
Looking at the share of properties that sold over the seller’s asking price captures just how competitive the market was back in February and March 2020, and now again with the sudden rebound over the past few months, which has pushed the % over asking ratio above 40% in February 2021.

3_DataDive_OverAsking

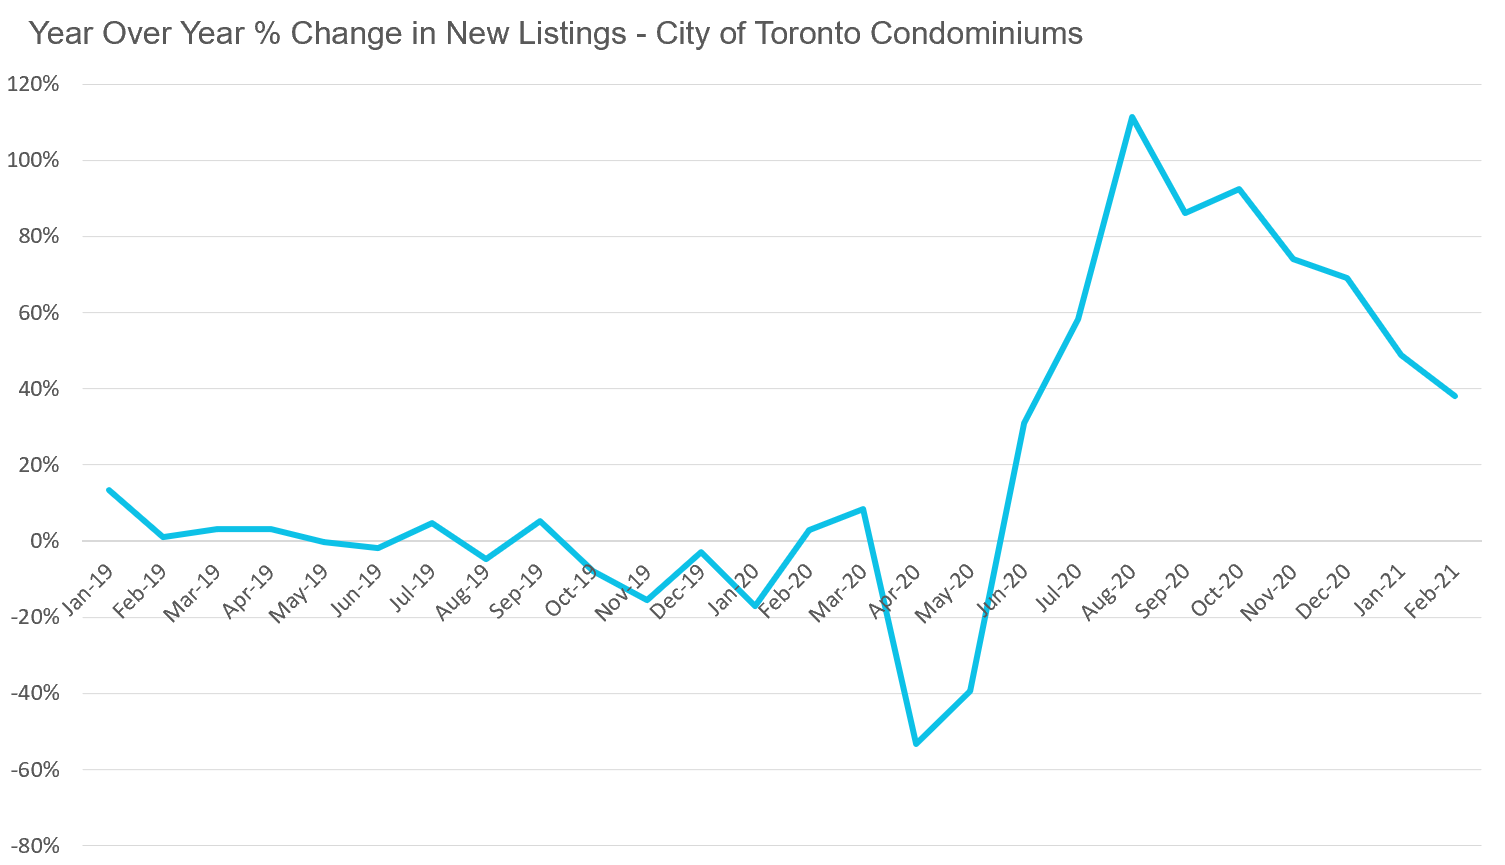
When looking at the change in new listings (below) we can see the spike in condos listed for sale during the second half of 2020.


4_DataDive_NewListings


The year-over-year change in sales really captures how aggressive and sudden this turnaround in the condo market was over the past three months.


5_DataDive_Sales


House Statistics

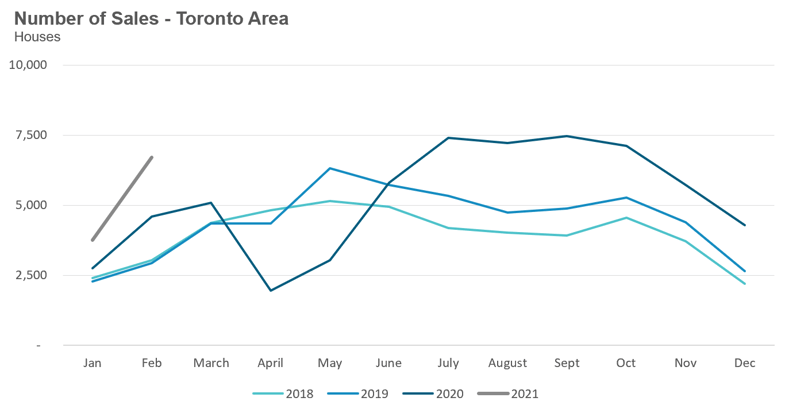
House sales (detached, semi-detached, townhouse, etc.) in the Toronto area in February 2021 were up 46% over the same month last year and more than double the sales volume in 2018 and 2019.

6_House_Sales

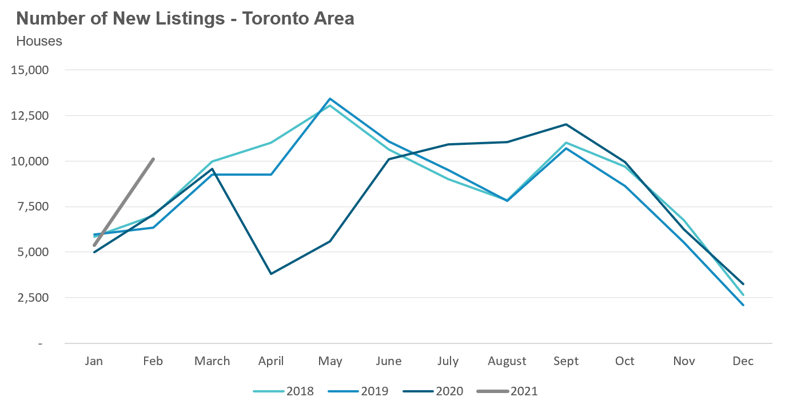
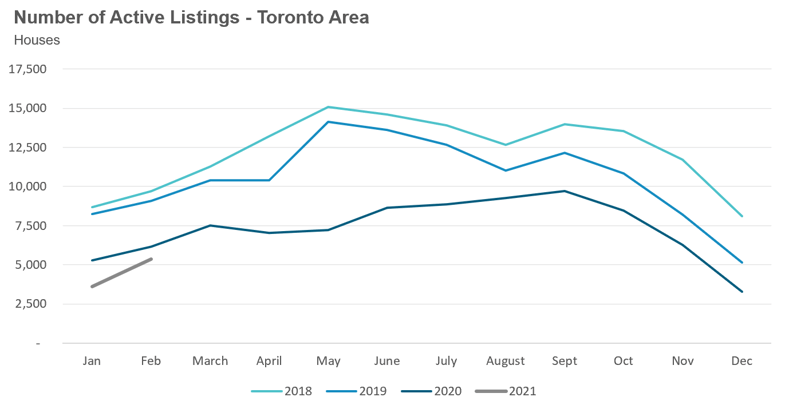
New listings in February were up 43% over last year while the number of homes available for sale (“active listings”) was down 13% when compared to the same month last year.


7_House_NewListings

8_House_ActiveListings

The Months of Inventory ratio (MOI) looks at the number of homes available for sale in a given month divided by the number homes that sold in that month. It answers the following question: If no more homes came on the market for sale, how long would it take for all the existing homes on the market to sell given the current level of demand?

The higher the MOI, the cooler the market is. A balanced market (a market where prices are neither rising nor falling) is one where MOI is between four to six months. The lower the MOI, the more rapidly we would expect prices to rise.

The market remained very competitive in February with an MOI of just 0.8 months.


While the current level of the MOI gives us clues into how competitive the market is on the ground today, the direction it is moving in also gives us some clues into where the market may be heading. The MOI has remained relatively stable at or below 1 MOI for the past three months.  


9_House_MOI


The competition for houses has picked up considerably since December when 50% of houses were selling for more than the owner’s asking price. In February, 79% of houses sold for more than the owner’s asking price.


10_House_OverAsking


Strong demand coupled with very low inventory levels helped push average house prices up to another record high of $1.285M, up 21% over last year.

Median house prices are up by 25% over last year.

Condo Statistics

Condominium (condo) sales (condo apartments, condo townhouses, etc.) in February were up by 52% over last year.

12_Condo_Sales

New condo listings were up by 34% in February 2021 over last year while active listings were also up 34% over last year.

13_Condo_NewListings

14_Condo_ActiveListings

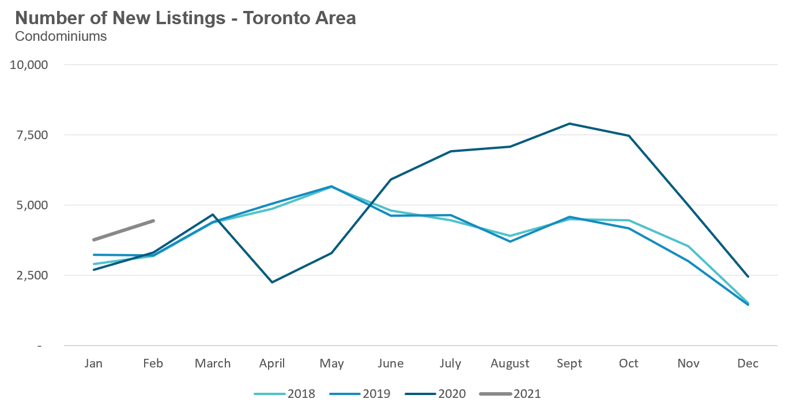
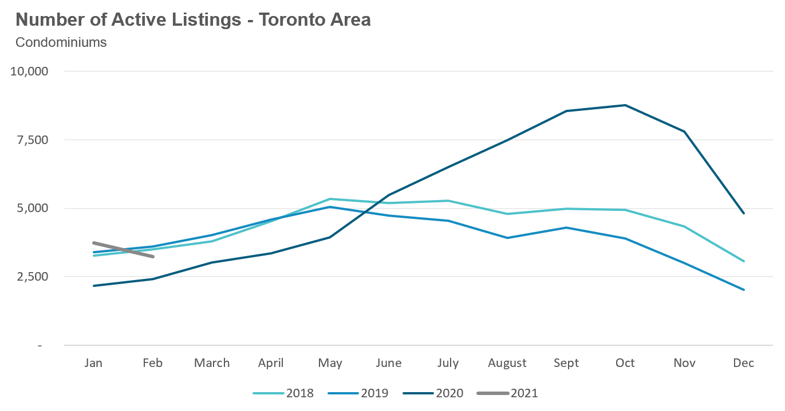
While active listings are still up over last year, the available inventory has been trending down since October when active condo listings peaked at 8,772.

This decline in active listings is leading to a more competitive condo market with the MOI decreasing from just under 2.9 months in November to 0.8 in February.


15_Condo_MOI


Toronto area condo prices are down 1% over last year. The decline in prices was due to the City of Toronto where prices were down 5%, while suburban condo prices were up over last year.
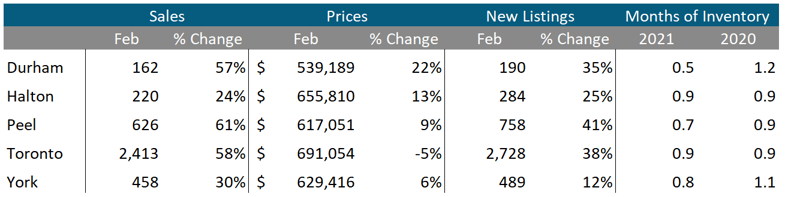
16_Condo_Price


Regional Trends

Houses

Sales across all five regions in the Greater Toronto Area (GTA) were up significantly in February. Average prices were up 23% to 38% in the suburbs while prices in the City of Toronto were up 15%. Despite an increase in new listings, inventory levels at or below 1 month across the entire GTA.
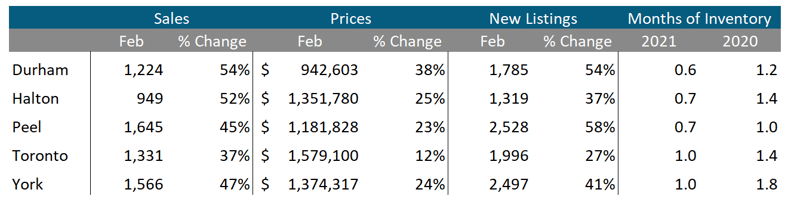
17_Regional_House

Condos

The surge in condo sales continued in February across the entire GTA. Average prices were up across the suburban regions with the City of Toronto recording a 5% decline in average price.

Inventory levels are at or below the same level as last year for all five regions.

18_Regional_Condo

Browse All Regional Market Trends live online:

Greater Toronto Area Market Trends
Durham Region Market Trends
Halton Region Market Trends
Peel Region Market Trends
City of Toronto Market Trends
York Region Market Trends

Market Performance by Neighbourhood Map, Toronto and the GTA


More Data for Realosophy Clients

Realosophy clients can access the same information above plus additional information on every home for sale, including building permit history, environmental alerts and more. Visit Realosophy.com/buy or contact your Realosophy agent for more details.

MoveSmartly_Mar2021_Report-Cover
Download a PDF version of this guide.
Download Report

Buying or Selling a Home in the Toronto Area?

Get straight answers to your questions at Realosophy Realty's popular, personalized no-obligation consultation.

Learn more at Realosophy.com