
A closer look at weekly, rather than monthly numbers, reflects the same market slowdown being seen on-the-ground in the Toronto area real estate market.
As Featured in this month's Move Smartly Report:

The Market Now: By the Numbers
Average Home Prices Trending Down in Toronto Area
Monthly Numbers Recap
In my last two monthly reports (see June and July), I discussed some early signs on the ground showing that Toronto’s housing market was beginning to cool. Two months later, the chill in Toronto’s housing market has become far more evident in the monthly data.
I’ll start by taking a quick look at the year-over-year trends in the housing market before taking a look at how the market has changed over the past two months.
Year-over-year, the average price for a house in the Toronto area was $1,353,902 in July, up 5% over the same month last year. Last month's median house price was $1,191,500, up 6% over last year.
House sales in July were up 15% over last year, while new house listings were up 15%. The number of houses available for sale at the end of the month, or active listings, was up 8% over last year.
The current balance between supply and demand is reflected in the Months of Inventory (MOI), which is a measure of inventory relative to the number of sales each month (for a more detailed explanation of this measure, see the final section of this report). In July, MOI for houses increased to 2.7, a sharp increase from 1.3 in May, just two months ago, indicating a slowing market.
The average price for a condominium (condo) in the Toronto Area was $762,239 in July, which is up 3% over last year. The median price for a condo in July was $690,000, unchanged over last year.
Condo sales in July were up 17% over last year, and new condo listings were up 16% over last year. The number of active condo listings was up 12% over last year. The MOI increased to 3.4. Much like the market for houses, this is a rapid increase from 1.6 in May, indicating a slowing.
For detailed monthly statistics for July 2023, the entire Toronto area market, including house, condo and regional breakdowns, see the final section of this report.
Recent Trends
A few noteworthy trends over the past couple of months are worth looking at.
As mentioned, when MOI increases, it’s generally a sign that the housing market is cooling down — and how quickly MOI increases tells us a lot about how quickly it’s cooling. When the MOI increases gradually, it’s a sign that the housing market is also cooling gradually, while a sharp increase in the MOI is a sign that the market is slamming on the brakes.
The sharp increase in the MOI we’re seeing over the past two months is an indicator that the market is cooling down rather quickly.
Another interesting trend is the change in average and median prices over the past two months. Average and median prices for low-rise houses are down 8% from the most recent highs reached in May. While average prices typically decline between May and July for seasonal reasons, as the summer months typically see buyers slowing down their search, the seasonal decline is typically less than 8%, suggesting that this recent price dip may be about more than just seasonality.
The City of Toronto saw median prices fall 10% between May and July, while the suburban regions saw median prices dip by 5% to 7%.
On the other hand, average and median condo prices have not changed very much over the past two months, an interesting trend given that inventory levels are already considerably higher for condos.

WATCH LIVE: The Market Now with John Pasalis - Thurs August 10th 2023 12PM ET
Join John Pasalis, report author, for key highlights of this month's report and responses to your questions. Sign Up Now >
The Market Now: On the Ground
Some Sellers Sticking to Unrealistically High Price Expectations
Over the past month, I have been noticing more and more homes listed for sale for relatively aggressive prices.
In some cases, the seller lists their home with an artificially low asking price to attract multiple buyer offers. After attracting multiple offers on their offer date, the sellers end up rejecting all the offers because none met their price expectations. The seller then relists their home for sale at the price they want and the home sits on the market for weeks as buyers refuse to meet the seller’s price expectations.
Some sellers are gradually reducing their prices, but some sellers are taking their homes off the market with a plan to relist them for sale in September. While this is a common approach agents take during the summer months when buyer activity typically cools down, it is going to be interesting to see how well this strategy works this year as we start to see the market perhaps cooling beyond typical seasonal patterns.
This year might be different because we are seeing a shift in the market due to today’s much higher interest rates. Some buyers are simply hitting pause because they can no longer afford to buy a home at today’s interest rates, in particular when they are being stress tested for a mortgage at approximately 8%.
We are also starting to hear more from existing owners with multiple properties who plan to list some of their investments for sale to deleverage.
What happens to home prices in the fall market will be driven by this delicate balance between supply and demand. If the volume of new listings increases more rapidly than the demand from buyers, we may see some downward pressure on prices. On the other hand, if we see even a modest increase in demand from buyers and no meaningful increase in new listings, we may see prices remain relatively flat for the rest of 2023, much like the second half of 2022.
Time will tell which path Toronto home prices take.
For detailed monthly statistics for July 2023, the entire Toronto area market, including house, condo and regional breakdowns, see all monthly stats in the full report here.
Browse Real-Time Market Trends on Movesmartly.com:
See Market Performance by Neighbourhood Map, All Toronto and the GTA
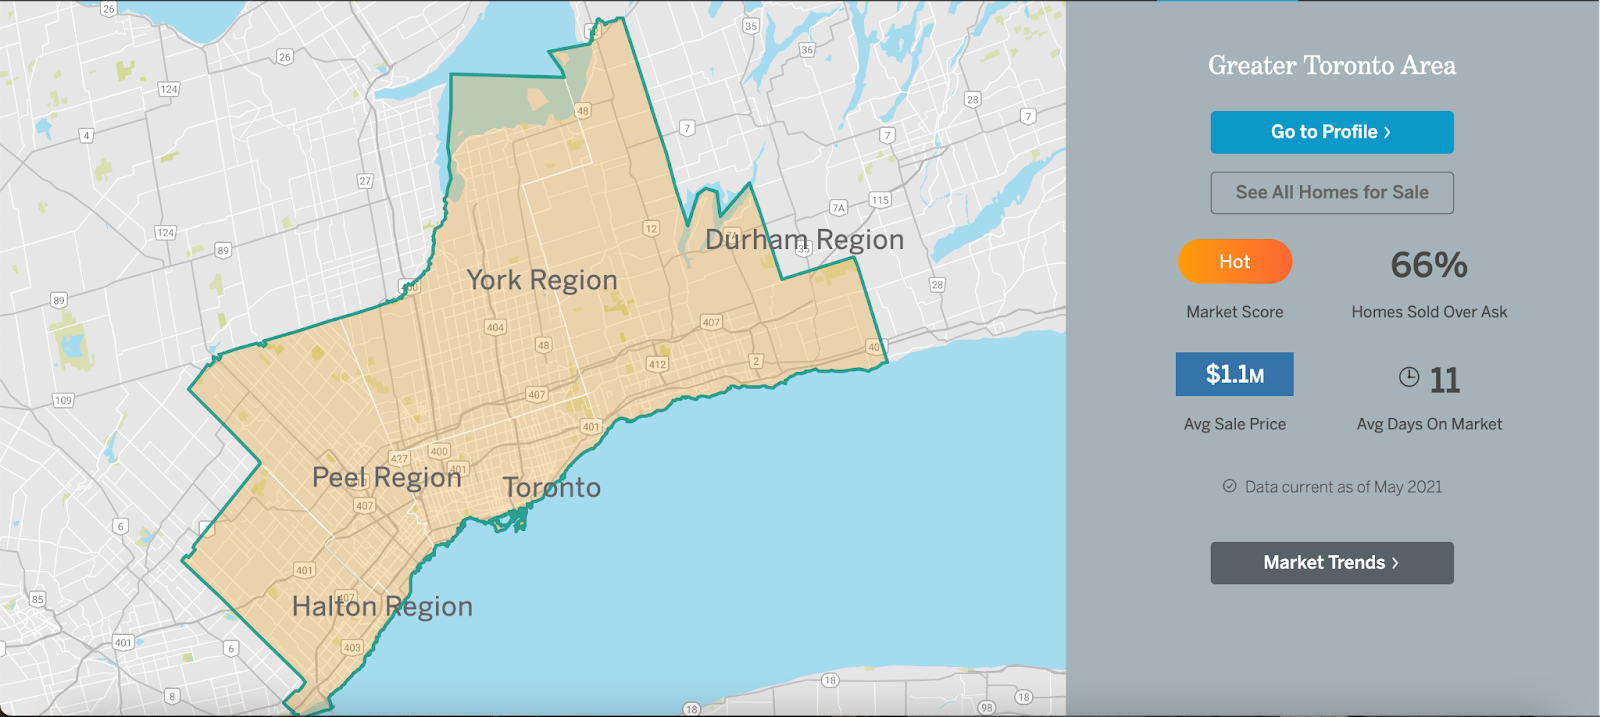
Greater Toronto Area Market Trends
Top Image Credit: Getty/iStock
The Move Smartly monthly report is powered by Realosophy Realty, an innovative residential real estate brokerage in Toronto. A leader in real estate analytics, Realosophy educates consumers at Realosophy.com and MoveSmartly.com and helps clients make better decisions when buying and selling a home.
John Pasalis is President of Realosophy Realty. A specialist in real estate data analysis, John’s research focuses on unlocking micro trends in the Greater Toronto Area real estate market. His research has been utilized by the Bank of Canada, the Canadian Mortgage and Housing Corporation (CMHC) and the International Monetary Fund (IMF).
Published: August 09, 2023


