This month we do a data dive on the City of Toronto’s volatile condo market over the past year.
As Featured in the Move Smartly Report:
Special Client Seminar
Join John as he unpacks this month's report and answers your questions. Exclusive for Realosophy past & present clients.
While the Toronto Area’s hot suburban housing market has received most of the media attention lately, the City of Toronto’s volatile condo market over the past year deserves further discussion.
Toronto’s condo market went on a wild roller coaster ride over the past twelve months. The wild swings in the market have had a lot to do with rapid changes in demand and supply happening at different points over the past twelve month period.
First, it helps to understand the basic storyline before looking at any charts because the charts are difficult to interpret without understanding the general context around the swings in supply and demand throughout the year.
Toronto’s condo market was incredibly competitive leading up to the first quarter of 2020. Inventory levels were gradually declining from two months of inventory at the start of 2019 to one month of inventory in the first quarter of 2020.
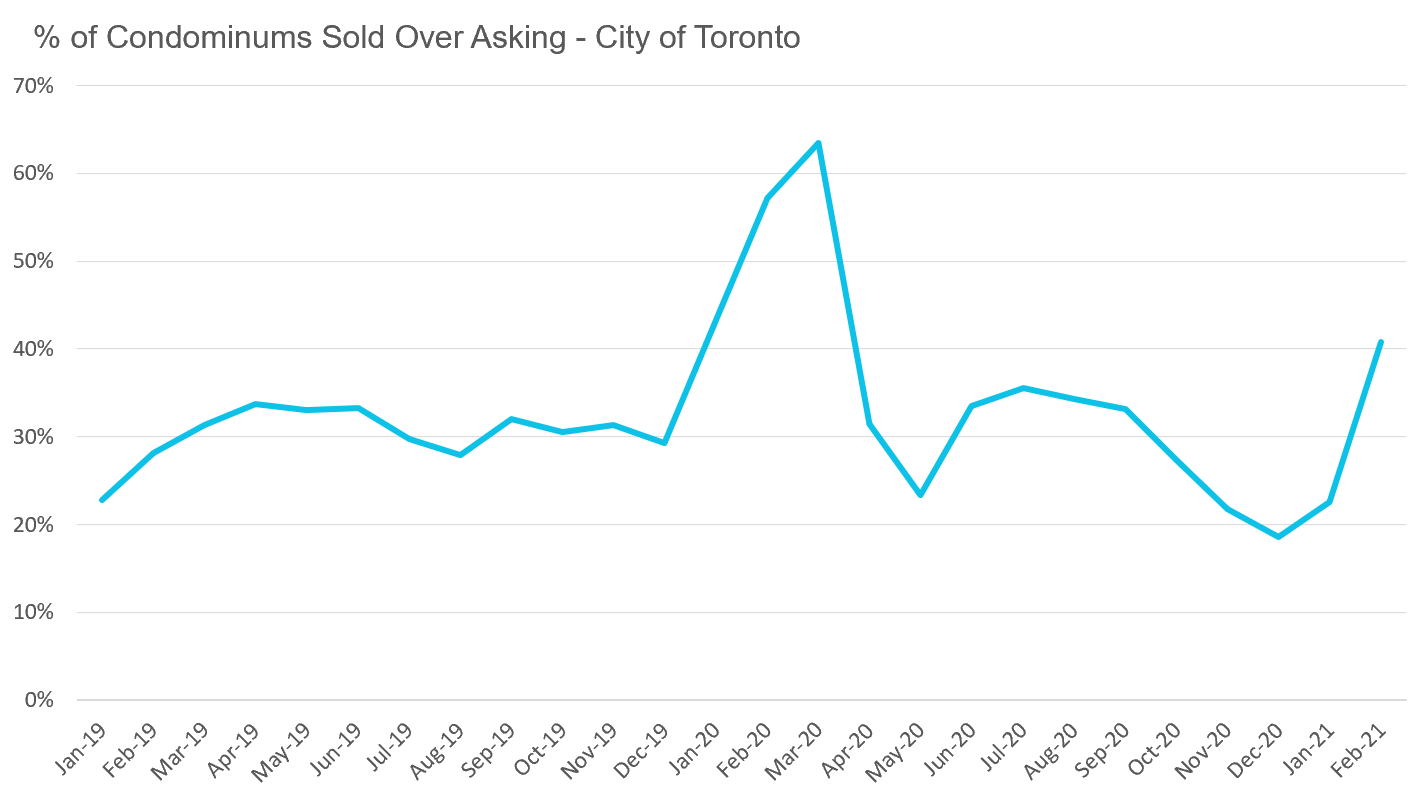
Then in February 2020, something strange happened. The condo market went from being very competitive to a speculative frenzy. All of a sudden there was an incredible urgency on the ground from home buyers and investors wanting to buy a condo. For all of 2019 and the first month of 2020, roughly 30% of condo units were selling for above the seller’s asking price. In February 2020, that ratio went up to 57% and by March it peaked at 64%.
The share of properties selling above the seller’s asking price is a good barometer of frenzy in the market. It serves as a decent proxy for the additional demand — the shadow demand — in a market that is not captured by the number of sold transactions alone. By shadow demand, I mean the thousands of buyers bidding on a property each month who did not successfully make a purchase. The higher the share of sold properties over asking, the higher the shadow demand.
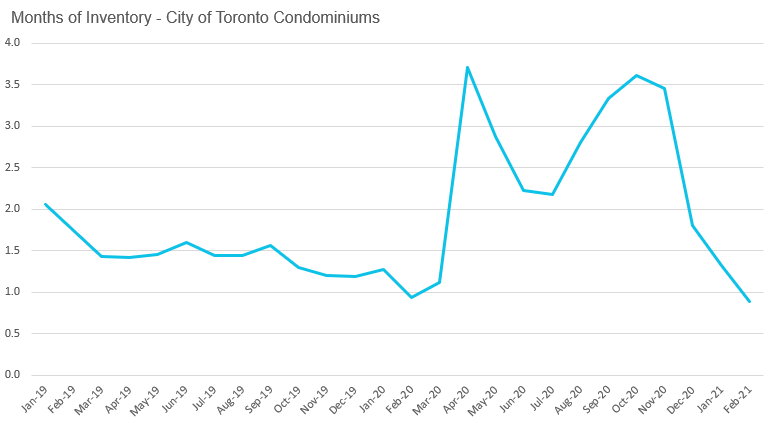
As buyers pulled out of the market in April 2020 due to the first round of the Covid-19 lockdowns, this pushed up the inventory of available condominiums from an MOI of 1 in March to an MOI of 3.7 in April 2020. (As a quick reminder MOI, or Months of Inventory, is the amount of time it would take for every home currently on the market to sell assuming no new homes came on the market for sale).
By June 2020, condo buyers returned to the market and by July the MOI had fallen to just over 2. Even though new listings were also picking up in June and July, demand was strong enough to keep the overall inventory level down.
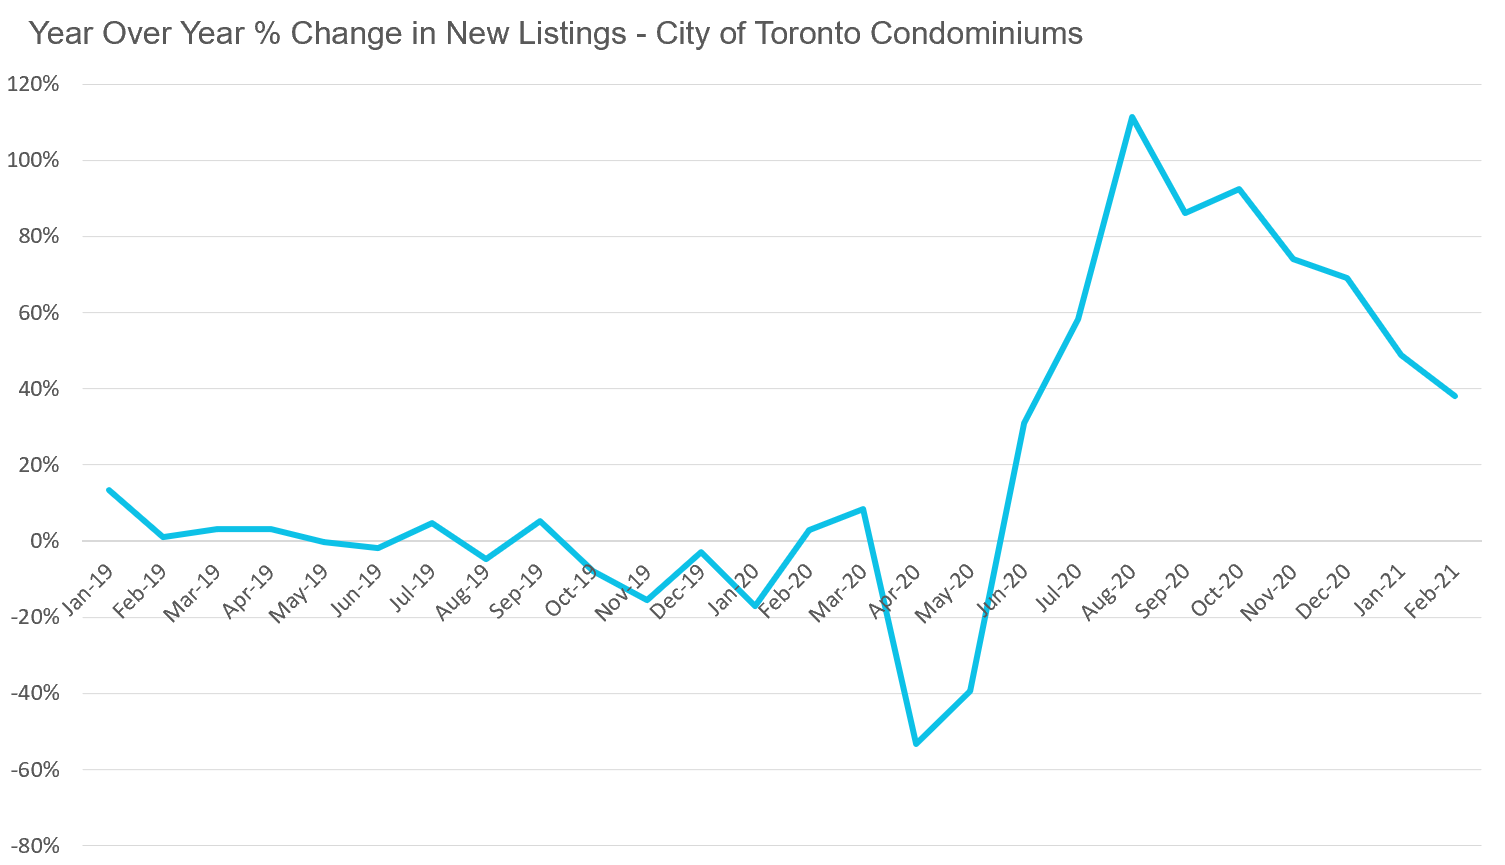
But in August the number of condos listed for sale surged, up by over 100% from the previous year, and were up by over 80% in September and October.
This spike in new listings cooled the condo market and again pushed the MOI back up to 3.
The interesting thing about this period between September and November of 2020 is that the on-the-ground-experience of sellers and their agents was far more bleak than these three months of inventory would suggest.
An MOI of 3 is normally a relatively balanced market with homes selling, but without as many bidding wars.
But in actuality, condos for sale were struggling to even get showings (visits from buyers and their agents) during this period. Agents were lucky if two to three buyers would visit their condo listings in any given week.
Condos that would have received ten offers just six months ago were languishing on the market for months with very few showings.
Why did condo listings spike in the third quarter of 2020? While I have not analyzed the data closely enough to answer this with more certainty, I can suggest some potential reasons.
Firstly, the condo rental market was also struggling during this period, as Covid-19 impacts saw many renters move out of their units to move in with family and friends given the shutdown of many work and education settings, resulting in a surge of rental listings and falling rents. Some investors likely decided to take their money off of the table by selling their units at that time.
Similarly, condo investors who were using their units as Airbnb rentals to generate income likely had their units vacant since the onset of the Covid-19 pandemic and the virtual standstill of travel and tourism.
Combined with the City of Toronto’s new policies limiting Airbnb rentals to one’s principal residence, some of these investors may have also decided to list their units for sale.
Finally, it’s likely that a number of condo owners who lived in their units as a primary residence decided to sell and move to a larger single family house with more outdoor space as a result of the need for entire families to work, study and live from home together due to Covid-19.
While the prospects for the condo market looked bleak as late as November, we once again saw a dramatic shift in the market.
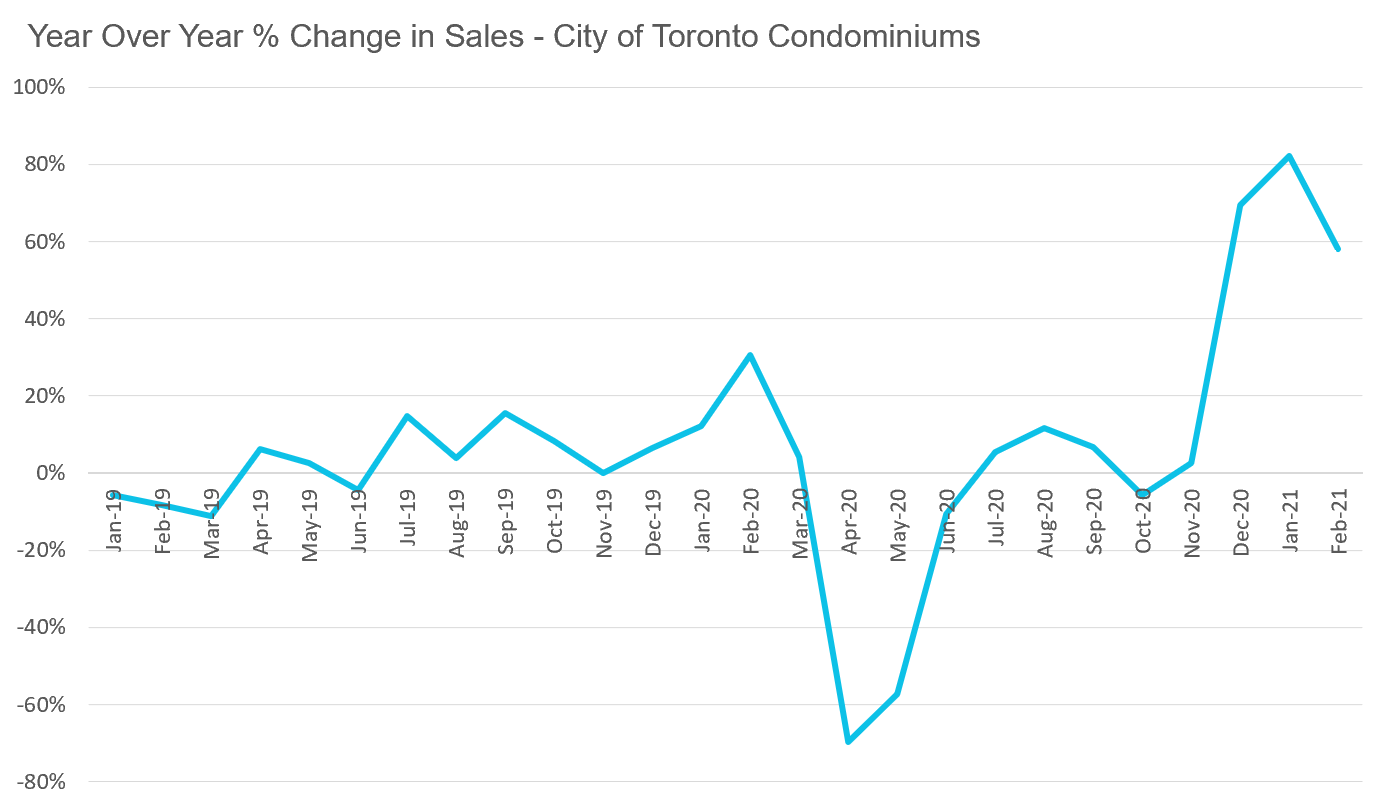
The very next month, condo sales were up 69% over the previous year and this trend continued into the new year. Condo sales in January were up 82% year-over-year and up 58% in February.
This dramatic surge in demand pushed condo inventory levels from an MOI of 3.5 in November to under 1.0 in February.
In February of this year, 41% of condominiums sold for more than the seller’s asking price. Aside from the peak of the market in February and March 2020, this is the highest share of transactions selling for more than the seller’s asking price since 2017.
The next question is what is behind this surge in demand in Toronto’s condo market over the past three months? I’m confident that the biggest driver of this change is renewed demand from condo investors.
When looking at the number of condo sales during this three month condo boom from December 2020 to February 2021 against the same three month period in the previous year by unit size, we can see that the biggest increase in sales was for small condo units under 600 sq. ft. These tend to be the units that investors are most interested in.
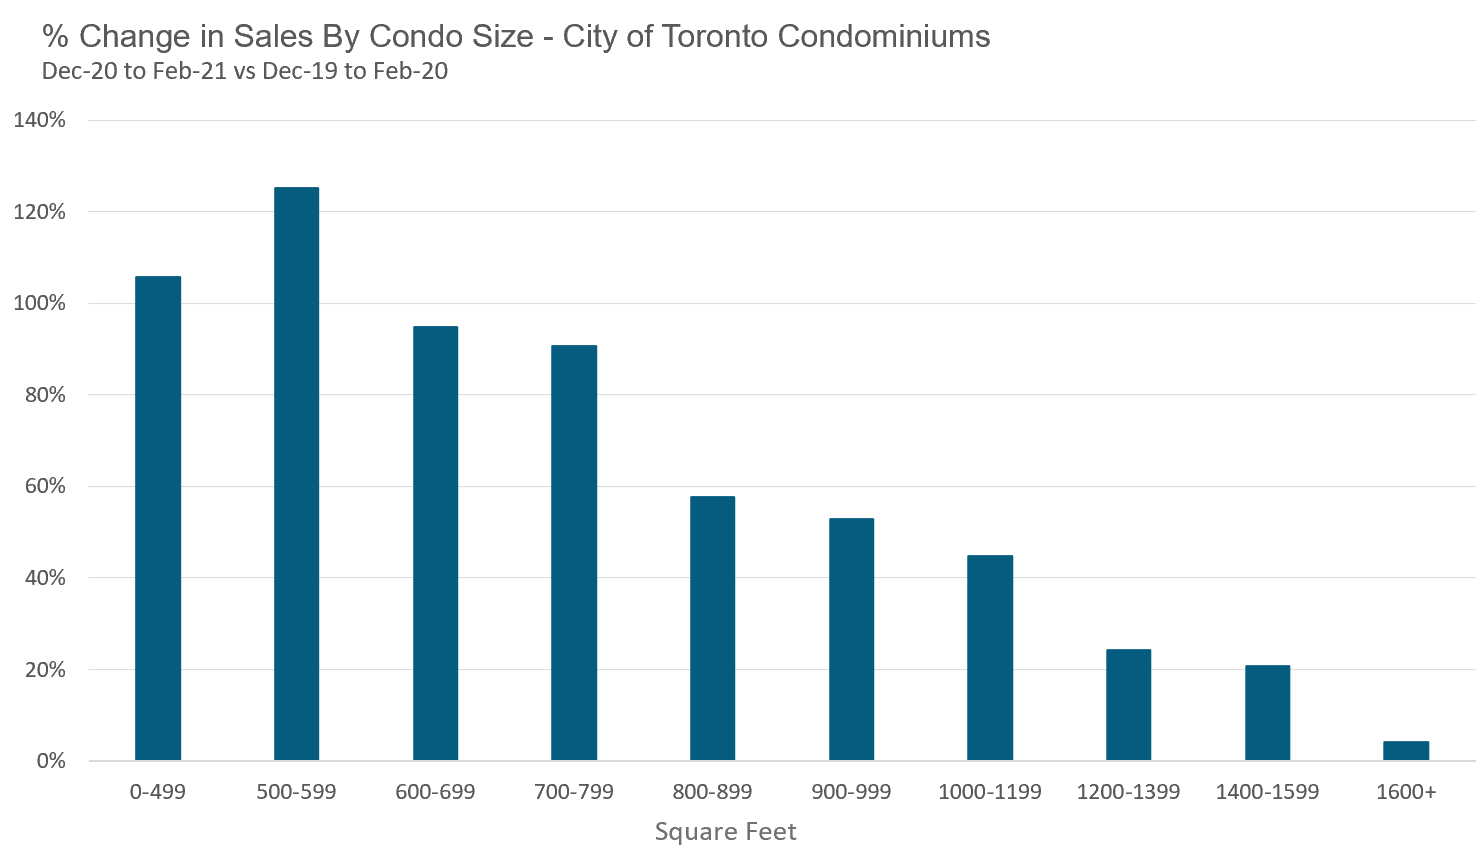
This demand from investors was driven by a number of factors. Firstly, condo prices in Toronto had fallen by roughly 10% from their peak in the first quarter of 2020 so investors jumped in to “buy the dip,” as they sought value.
Secondly, by late November 2020, there was more news and projected timelines for the roll-out of the Covid-19 vaccine with the hope that the majority of Canadians would be vaccinated by September 2021. This left investors feeling confident that demand for condo rentals would return later this year; the surge in house prices in the suburbs also reinforced the perception that it was only a matter of time before condo prices would start to rebound.
What’s next for the condo market?
I suspect this surge in demand from investors will continue and will push prices up with it.
Investors are listening to and will follow the messages they are getting from Ottawa:
Money is cheap, and it’s going to stay that way for a long time.
House prices are not too high – they have room to go higher.
Policy makers have plenty of tools to ensure this housing boom continues.
We’ll see where this all leads us.
Now, we’ll take a look at a few charts highlighting the roller coaster year for condos.
Since MOI is a measure that includes both the supply and demand at any given point in time, it does the best job of capturing the volatility in the condo market over the past twelve months.
The MOI declining right up to the onset of the Covid-19 pandemic in March 2020 was a sign of the market heating up. We then see MOI spike at the start of the pandemic-induced lockdown. MOI started to decline again in June and July, rising in August due to the surge in new listings, then decline rapidly again as sales picked up beginning in December 2020.
Looking at the share of properties that sold over the seller’s asking price captures just how competitive the market was back in February and March 2020, and now again with the sudden rebound over the past few months, which has pushed the % over asking ratio above 40% in February 2021.
When looking at the change in new listings (below) we can see the spike in condos listed for sale during the second half of 2020.
The year-over-year change in sales really captures how aggressive and sudden this turnaround in the condo market was over the past three months.
Keeping an Eye on the Market
Read my full analysis on this and other key trends in the March 2021 Move Smartly Report
Follow John's latest updates on Twitter, YouTube, Facebook or Instagram
John Pasalis is President of Realosophy Realty, a Toronto real estate brokerage which uses data analysis to advise residential real estate buyers, sellers and investors.
A specialist in real estate data analysis, John’s research focuses on unlocking micro trends in the Greater Toronto Area real estate market. His research has been utilized by the Bank of Canada, the Canadian Mortgage and Housing Corporation (CMHC) and the International Monetary Fund (IMF).


