
The most important trend of note now is the start of a gradual cooling down in the market for houses across the Greater Toronto Area.
As Featured in the Move Smartly Report:
 The Market Now
Have questions about this unpredictable market? John Pasalis, President of Realosophy Realty and author of the Move Smartly report is hosting a monthly webinar for past and present clients of Realosophy Realty. Hear key takeaways from this month's report and get answers to your questions.
What a year it’s been — and with Ontario in yet another lockdown, our journey continues.
Year-over-year comparisons of Toronto’s housing market over the next two months (see ‘Monthly Statistics’ section in this report) will not tell us much about what is actually happening on-the-ground in our real estate market because the period we are comparing against a year ago, April 2020, marked the first full month of Ontario’s COVID-19 lockdowns which also resulted in a virtual freezing of the resale housing market. Then, sales plummeted 67% over the previous year and average prices fell 10% over the previous month because the homes that were selling were in a much lower price range.
Instead I’ll share with you the key things you need to know about Toronto’s housing market now based on our interpretation of current data and on-the-ground trends.
The most important trend of note now is the start of a gradual cooling down in the market for houses (detached, semis, rows) across the Greater Toronto Area. The market is still deeply in seller’s market territory but we are seeing the first signs of a market that is starting to decelerate — a welcome sign for buyers engaged in frustrating bidding wars.
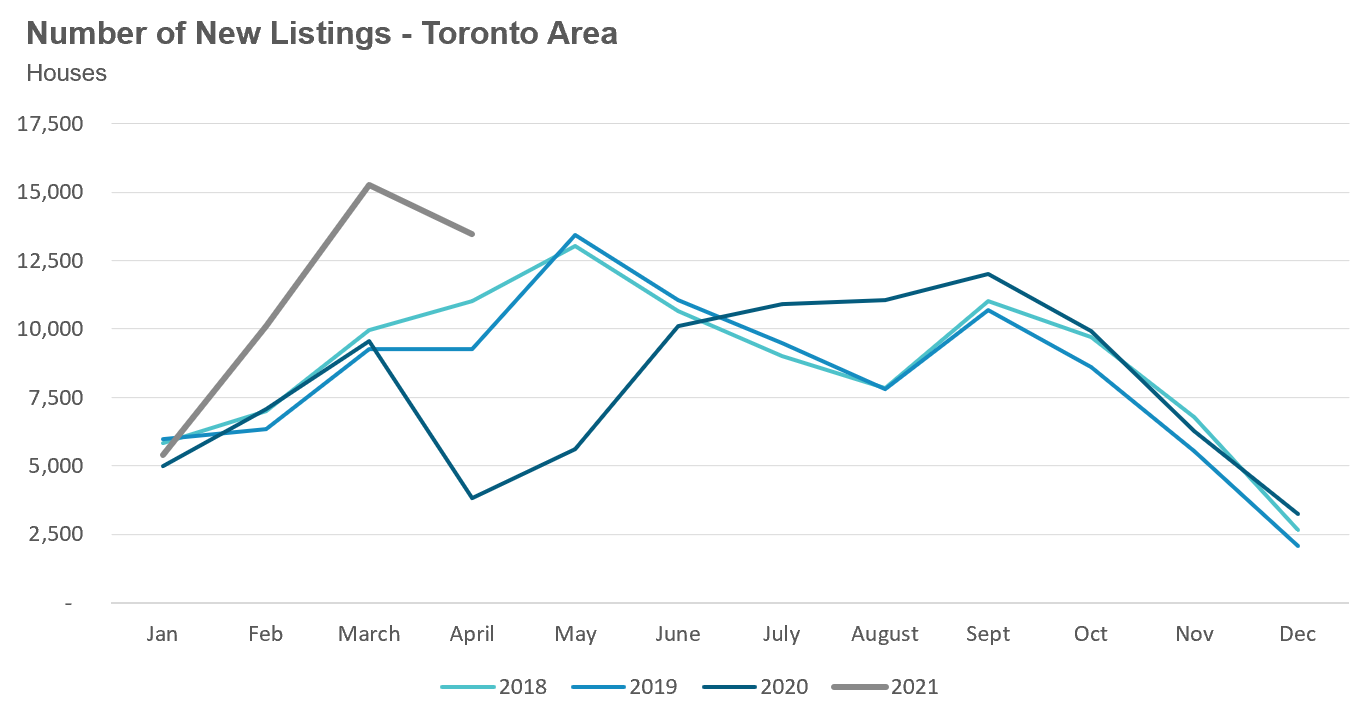
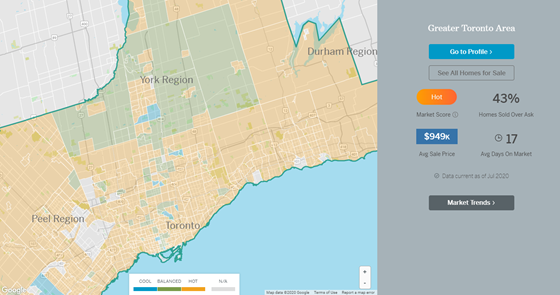
Houses receiving multiple offers continue to be the norm across the Toronto area with 73% of homes selling for more than the owner’s asking price (a slight dip from 79% last month). But sellers are getting fewer offers on their offer night — and in some cases no offers at all. The surge in demand we saw due to Covid-19 induced moves appears to be running its course as sales in April declined 12% over March — of note, as sales don’t typically decline as we head into (what is normally the busiest) spring market. A surge in new listings over the past two months has also helped take some of the heat out of the market.
Most importantly, home prices are no longer accelerating on a month-over-month basis and appear to have plateaued the past few months with average prices around $1.3M.
The condo market on the other hand has been accelerating over the past five months and has shown no signs of slowing down quite yet. While average house prices have been flat since January, condo prices have climbed 14% from $620K in January to $709K in April.
Condo inventory levels remain very tight and 63% of condos are selling for more than the owner’s asking price. But anecdotal accounts suggest that a significant portion of the change in demand for condos over the past five months has come from renewed interest from condo investors — especially in the downtown area (see ‘Data Dive’ section in this report). But with condo prices rising rapidly and interest rates up slightly, we may see the condo market begin to cool in the months ahead.
Monthly Statistics
House Statistics
House sales (detached, semi-detached, townhouse, etc.) in the Toronto area in April 2021 were up 346% over the same month last year, which saw very low sales volumes during the first month of Ontario’s COVID-19 lockdowns. The 8,740 sales in April represents a 13% decrease from the record 10,068 sales achieved in March.

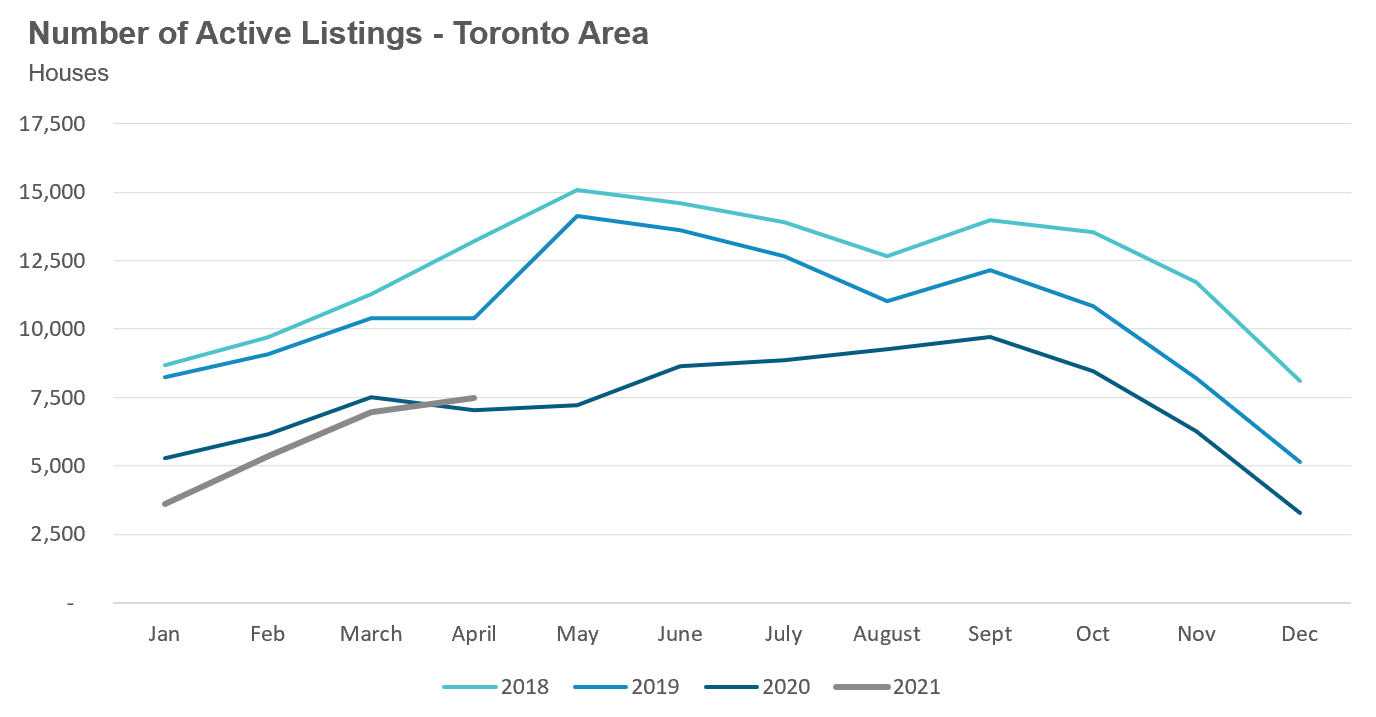
New listings in April were up 253% over last year while the number of houses available for sale (“active listings”) was up 6% when compared to the same month last year.
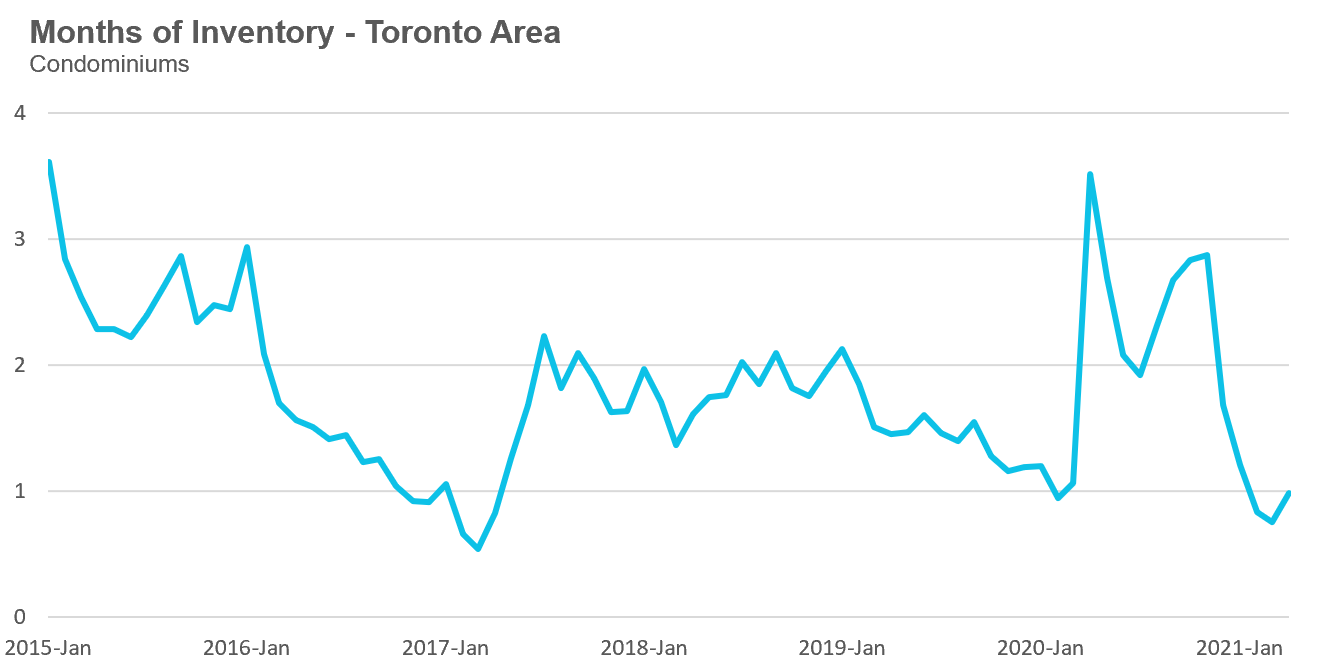
The Months of Inventory ratio (MOI) looks at the number of homes available for sale in a given month divided by the number homes that sold in that month. It answers the following question: If no more homes came on the market for sale, how long would it take for all the existing homes on the market to sell given the current level of demand?
The higher the MOI, the cooler the market is. A balanced market (a market where prices are neither rising nor falling) is one where MOI is between four to six months. The lower the MOI, the more rapidly we would expect prices to rise.
The market remained very competitive in April with an MOI of just 0.9 months.
While the current level of the MOI gives us clues into how competitive the market is on the ground today, the direction it is moving in also gives us some clues into where the market may be heading. The MOI has remained relatively stable at or below 1 MOI for the past five months.

The share of houses selling for more than the owner’s asking price dropped from 79% to 73% in April. While this figure still suggests a very hot and competitive market, we are finding at our brokerage that the number of offers that houses are receiving on their offer nights has declined significantly and in many cases houses may only get one offer. In cases like these, a house priced lower to encourage multiple offers will still likely sell for more than the owner’s asking price because the buyer knows the asking price does not reflect the actual market value of the house.

The average house price in April was $1,303,075 while the median was $1,1395,000 which were both up 38% over last year.
While prices are up significantly over last year — in part due to a big drop in prices last year as fewer high-end houses sold during the first lockdown — the key trend right now is that prices appear to have plateaued.
After prices increased by $200,000 between the last quarter of 2020 and the first quarter of 2021, it wasn’t clear if the rapid acceleration in house prices would continue or level off. The surge in new listings over the past few months has cooled house price appreciation.

Condo Statistics
Condominium (condo) sales (condo apartments, condo townhouses, etc.) in April were up by 362% over last year due in part to depressed sales last year during the first month of Ontario’s COVID-19 lockdowns.

New condo listings were up by 198% in April 2021 over last year while active listings were also up 29% over last year.


But the strong sales resulted in a very competitive condo market with the MOI at 1 for the month of April.
The competition for condos has picked up considerably since December when 23% of condos were selling for more than the owner’s asking price. In April, 63% of condos sold for more than the owner’s asking price.

Toronto area average condo prices are up 21% over last year while the median was up 18%. While this big increase is partly due to the sharp decline in average price last year during the first month of the lock down, it’s worth noting that on a month-over-month basis condo prices are accelerating.
Average condo prices were in the low $600K range during the fourth quarter of 2020 and have now surpassed $700K in April.

Regional Trends
Houses
Sales across all five regions in the GTA were up significantly in April as were average prices. Despite the increase in new listings inventory levels are at or below 1 month across the entire GTA.

Condos
The surge in condominium sales continued in April across the entire GTA. Average prices were up across the suburban regions with the City of Toronto. Inventory levels are below last year’s levels for all five regions.

Browse All Regional Market Trends for April 2021 on Movesmartly.com:
Greater Toronto Area Market Trends
Market Performance by Neighbourhood Map, All Toronto and the GTA
More Data for Realosophy Clients
Realosophy clients can access the same information above plus additional information on every home for sale, including building permit history, environmental alerts and more. Visit Realosophy.com/buy or contact your Realosophy agent for more details.
Top Image Credit: Getty/iStock
The Move Smartly monthly report is powered Realosophy Realty Inc. Brokerage, an innovative residential real estate brokerage in Toronto. A leader in real estate analytics, Realosophy educates consumers at Realosophy.com and MoveSmartly.com and helps clients make better decisions when buying and selling a home.
Published: May 13, 2021


