
'Excessive exuberance' on display in the Toronto area real estate market right now.
As Featured in the Move Smartly Report:

The Market This Month
The Toronto Area housing market continues to boom, with the market for houses particularly showing signs of ‘excessive exuberance’ amongst buyers.
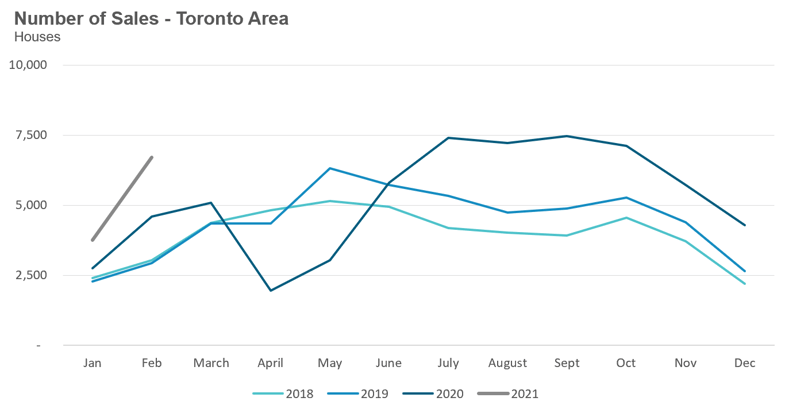
In February, house (detached, semi-detached, townhouse) sales were up 46% over last year (2020), and have doubled when compared against 2018 and 2019 sales volumes. Months of Inventory (MOI) remains low at 0.8 (a seller’s market) and 79% of houses sold for more than the seller’s asking price.
On a more positive note for buyers, house price increases are moderating slightly with a 21% increase over last year (compared to the 29% year-over-year increase seen last month). House prices in the City of Toronto were up by just 12% which helped pull down the overall average. We also saw little to no change in average suburban house prices from January to February.
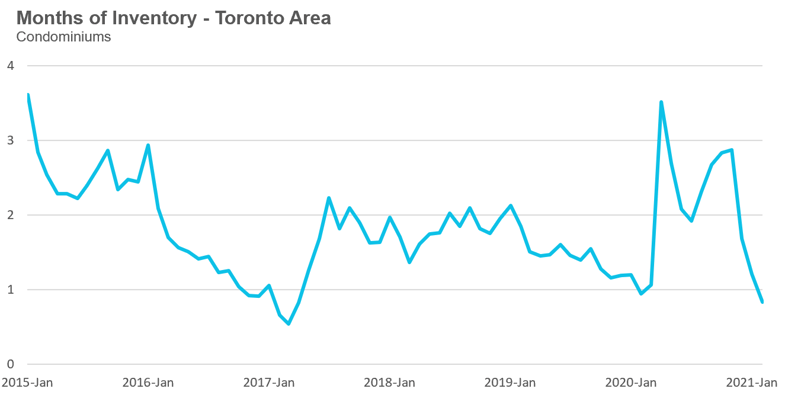
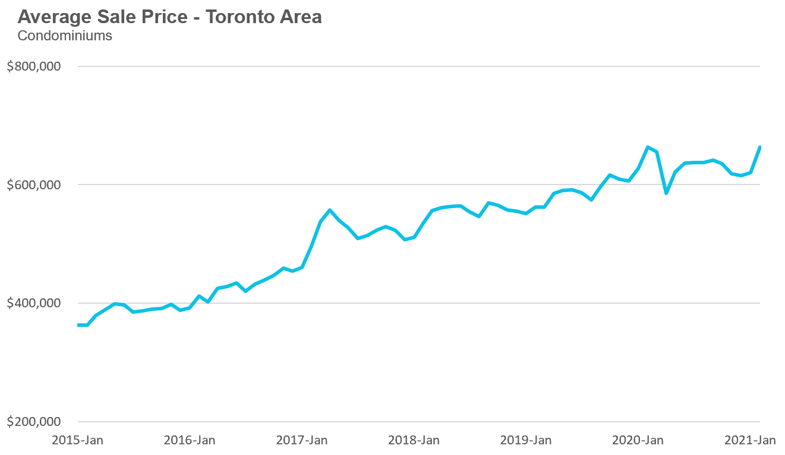
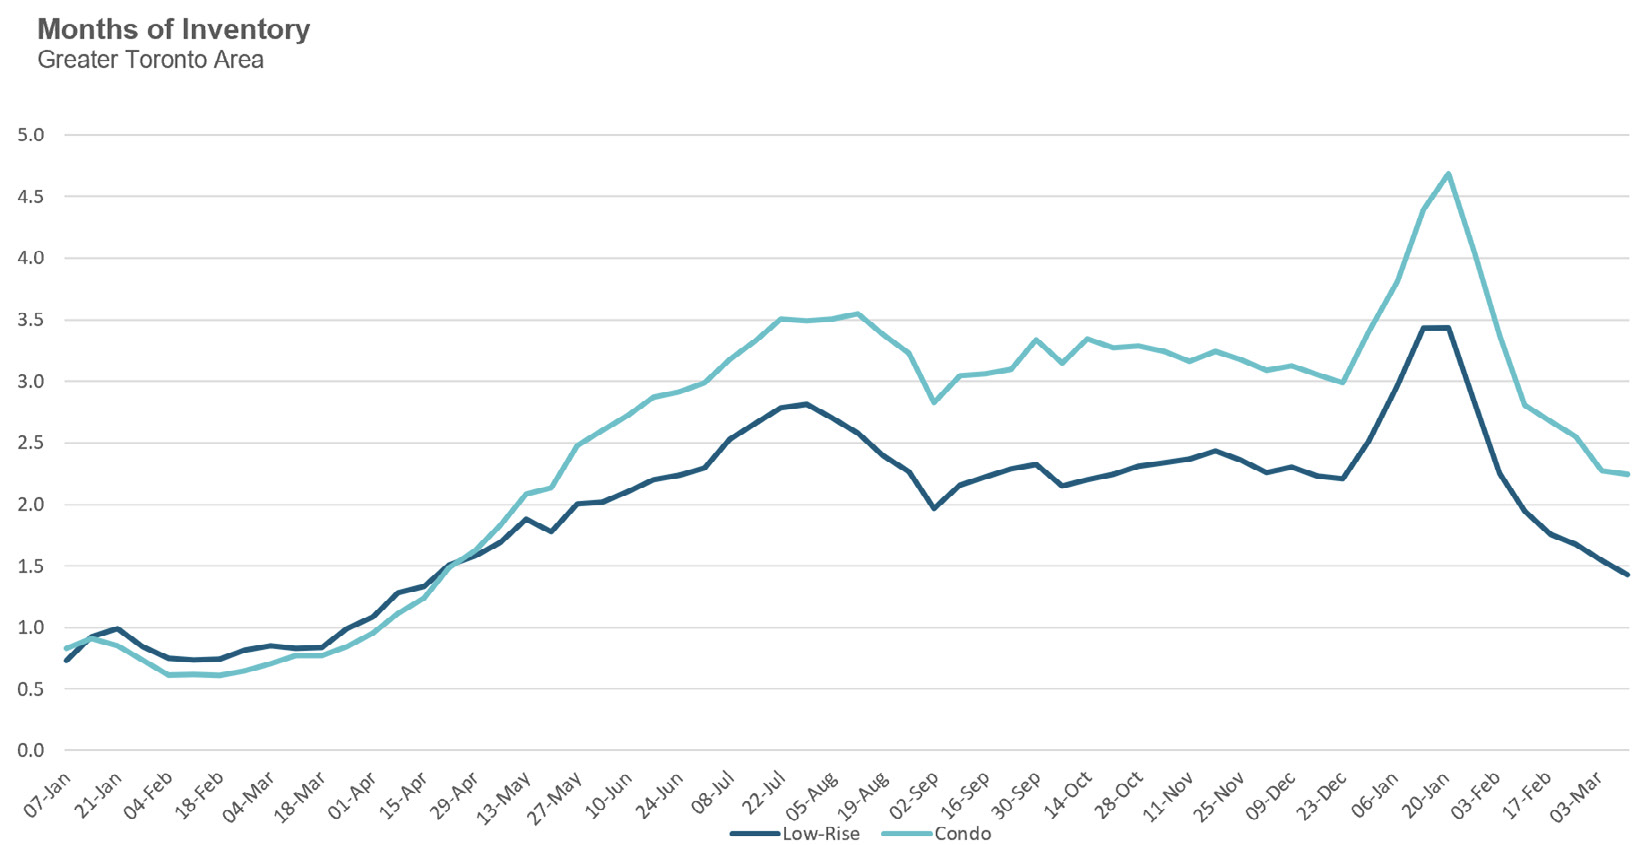
Turning to the Toronto area condominium (condo) market, sales for condos were up 52% over last year continuing a rebounding trend that began in December (see ‘The Data Dive’ in this report). 48% of Toronto area condos sold for more than the seller’s asking price. Year-over-year average condo prices fell in 2020, but since then have recovered with the average condo price last month now the same year-over-year. The MOI for condos is perhaps most indicative of this turnaround, having decreased from 3.5 in November (a balanced market) to 0.8 in February (a seller’s market).
Special Client Seminar
Join John as he unpacks this month's report and answers your questions. Exclusive for Realosophy past & present clients. Sign up here
Monthly Statistics
House Statistics
House sales (detached, semi-detached, townhouse, etc.) in the Toronto area in February 2021 were up 46% over the same month last year and more than double the sales volume in 2018 and 2019.
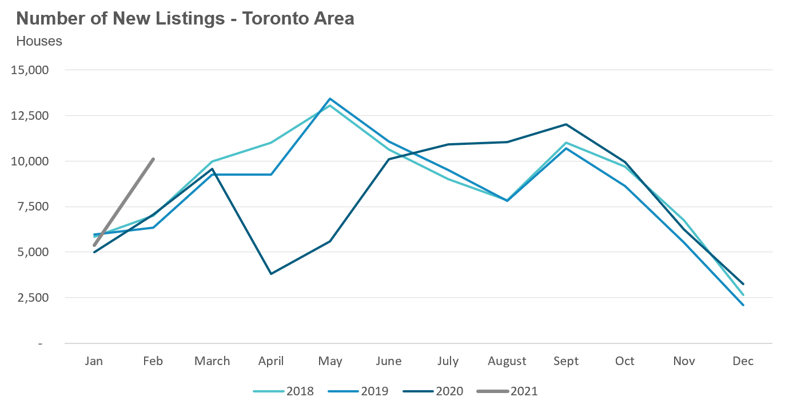
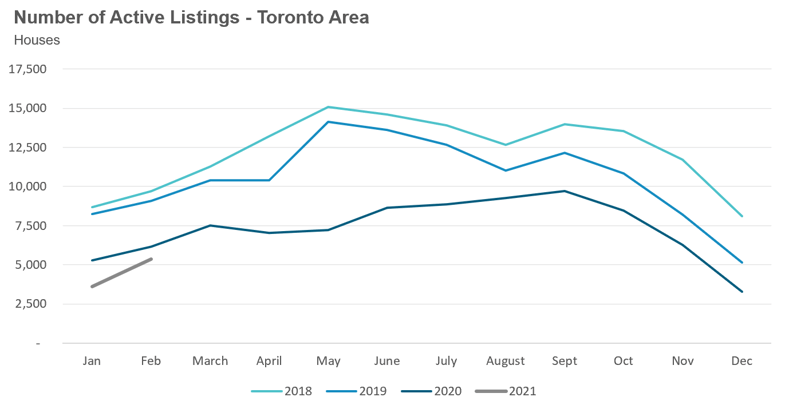
New listings in February were up 43% over last year while the number of homes available for sale (“active listings”) was down 13% when compared to the same month last year.
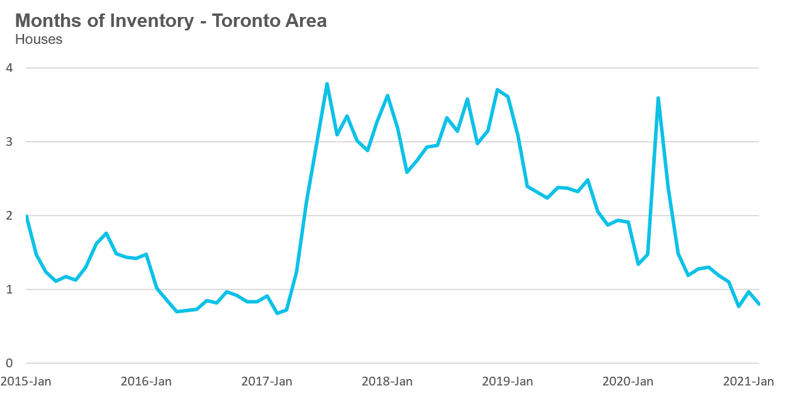
The Months of Inventory ratio (MOI) looks at the number of homes available for sale in a given month divided by the number homes that sold in that month. It answers the following question: If no more homes came on the market for sale, how long would it take for all the existing homes on the market to sell given the current level of demand?
The higher the MOI, the cooler the market is. A balanced market (a market where prices are neither rising nor falling) is one where MOI is between four to six months. The lower the MOI, the more rapidly we would expect prices to rise.
The market remained very competitive in February with an MOI of just 0.8 months.
While the current level of the MOI gives us clues into how competitive the market is on the ground today, the direction it is moving in also gives us some clues into where the market may be heading. The MOI has remained relatively stable at or below 1 MOI for the past three months.
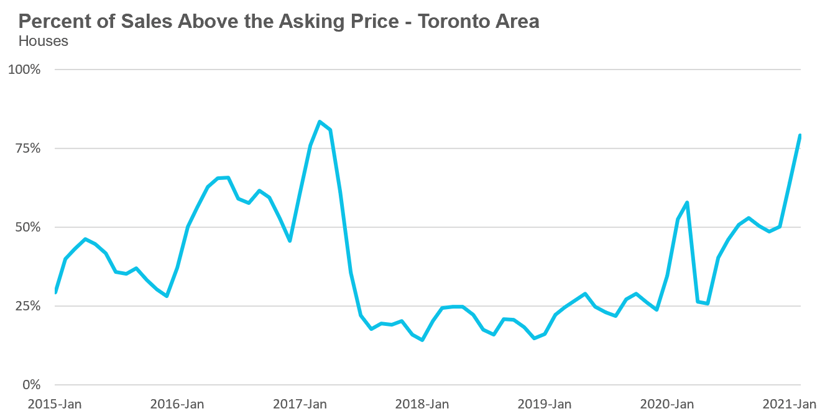
The competition for houses has picked up considerably since December when 50% of houses were selling for more than the owner’s asking price. In February, 79% of houses sold for more than the owner’s asking price.
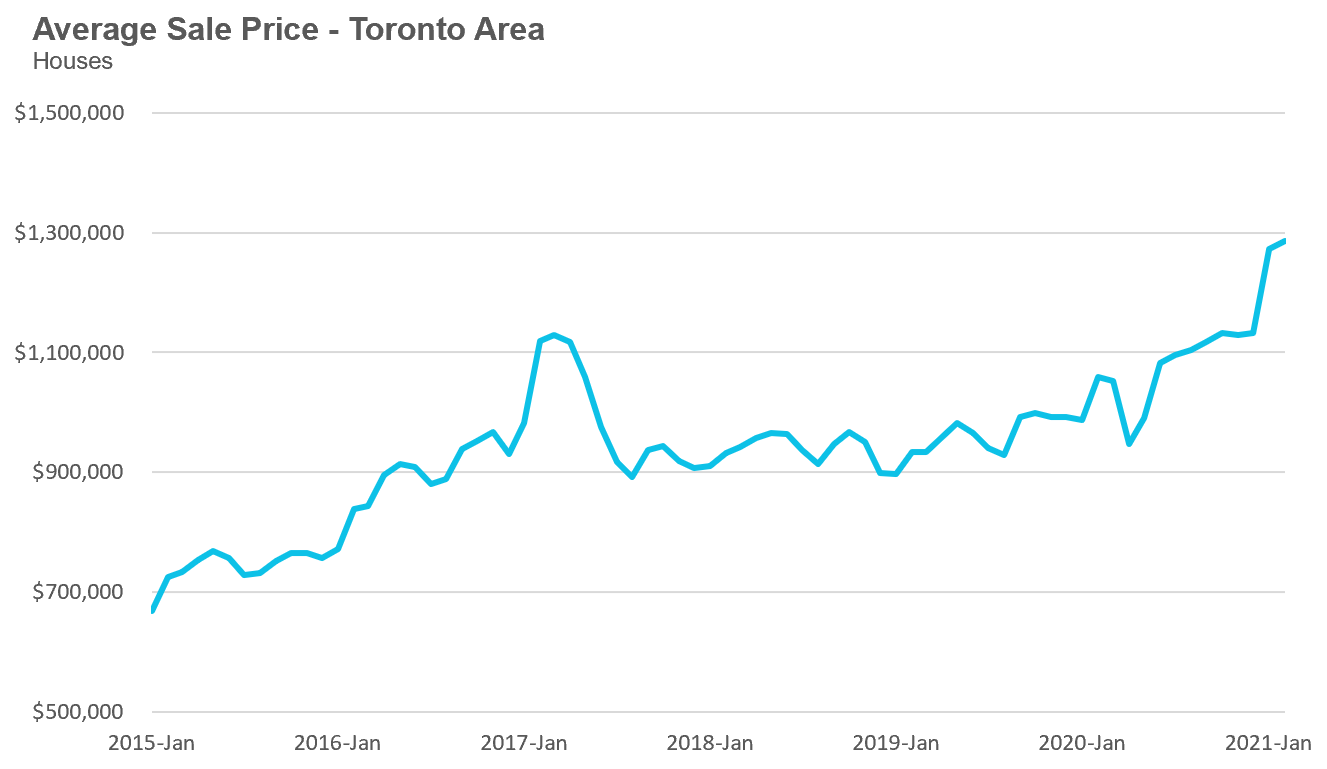
Strong demand coupled with very low inventory levels helped push average house prices up to another record high of $1.285M, up 21% over last year.
Median house prices are up by 25% over last year.
Condo Statistics
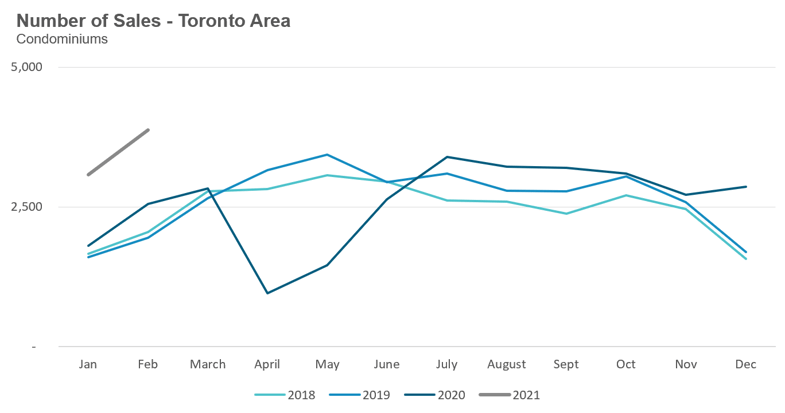
Condominium (condo) sales (condo apartments, condo townhouses, etc.) in February were up by 52% over last year.
New condo listings were up by 34% in February 2021 over last year while active listings were also up 34% over last year.
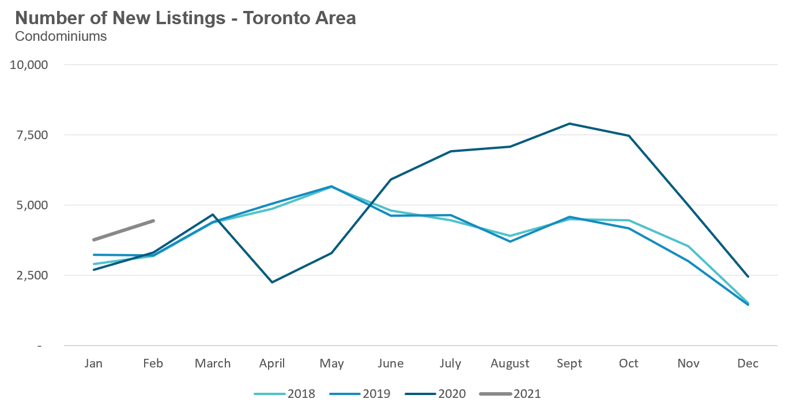
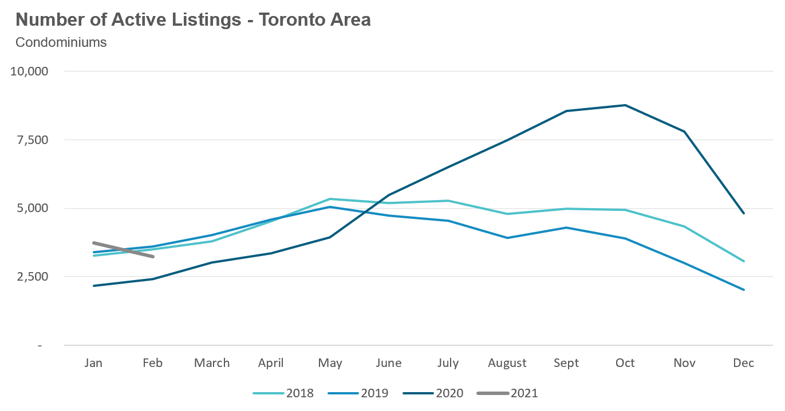
While active listings are still up over last year, the available inventory has been trending down since October when active condo listings peaked at 8,772.
This decline in active listings is leading to a more competitive condo market with the MOI decreasing from just under 2.9 months in November to 0.8 in February.
Toronto area condo prices are down 1% over last year. The decline in prices was due to the City of Toronto where prices were down 5%, while suburban condo prices were up over last year.
See all real time stats on movesmartly.com:
The Move Smartly monthly report is powered Realosophy Realty Inc. Brokerage, an innovative residential real estate brokerage in Toronto. A leader in real estate analytics, Realosophy educates consumers at Realosophy.com and MoveSmartly.com and helps clients make better decisions when buying and selling a home.
Published: March 12, 2021


