


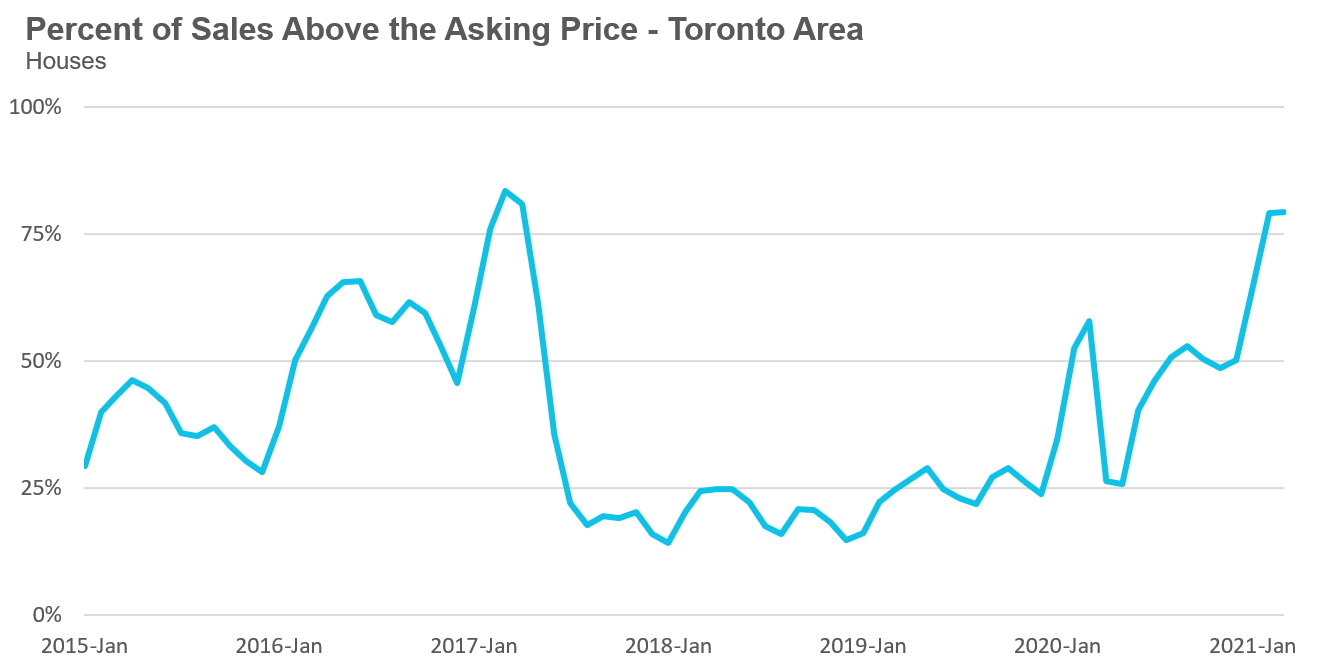
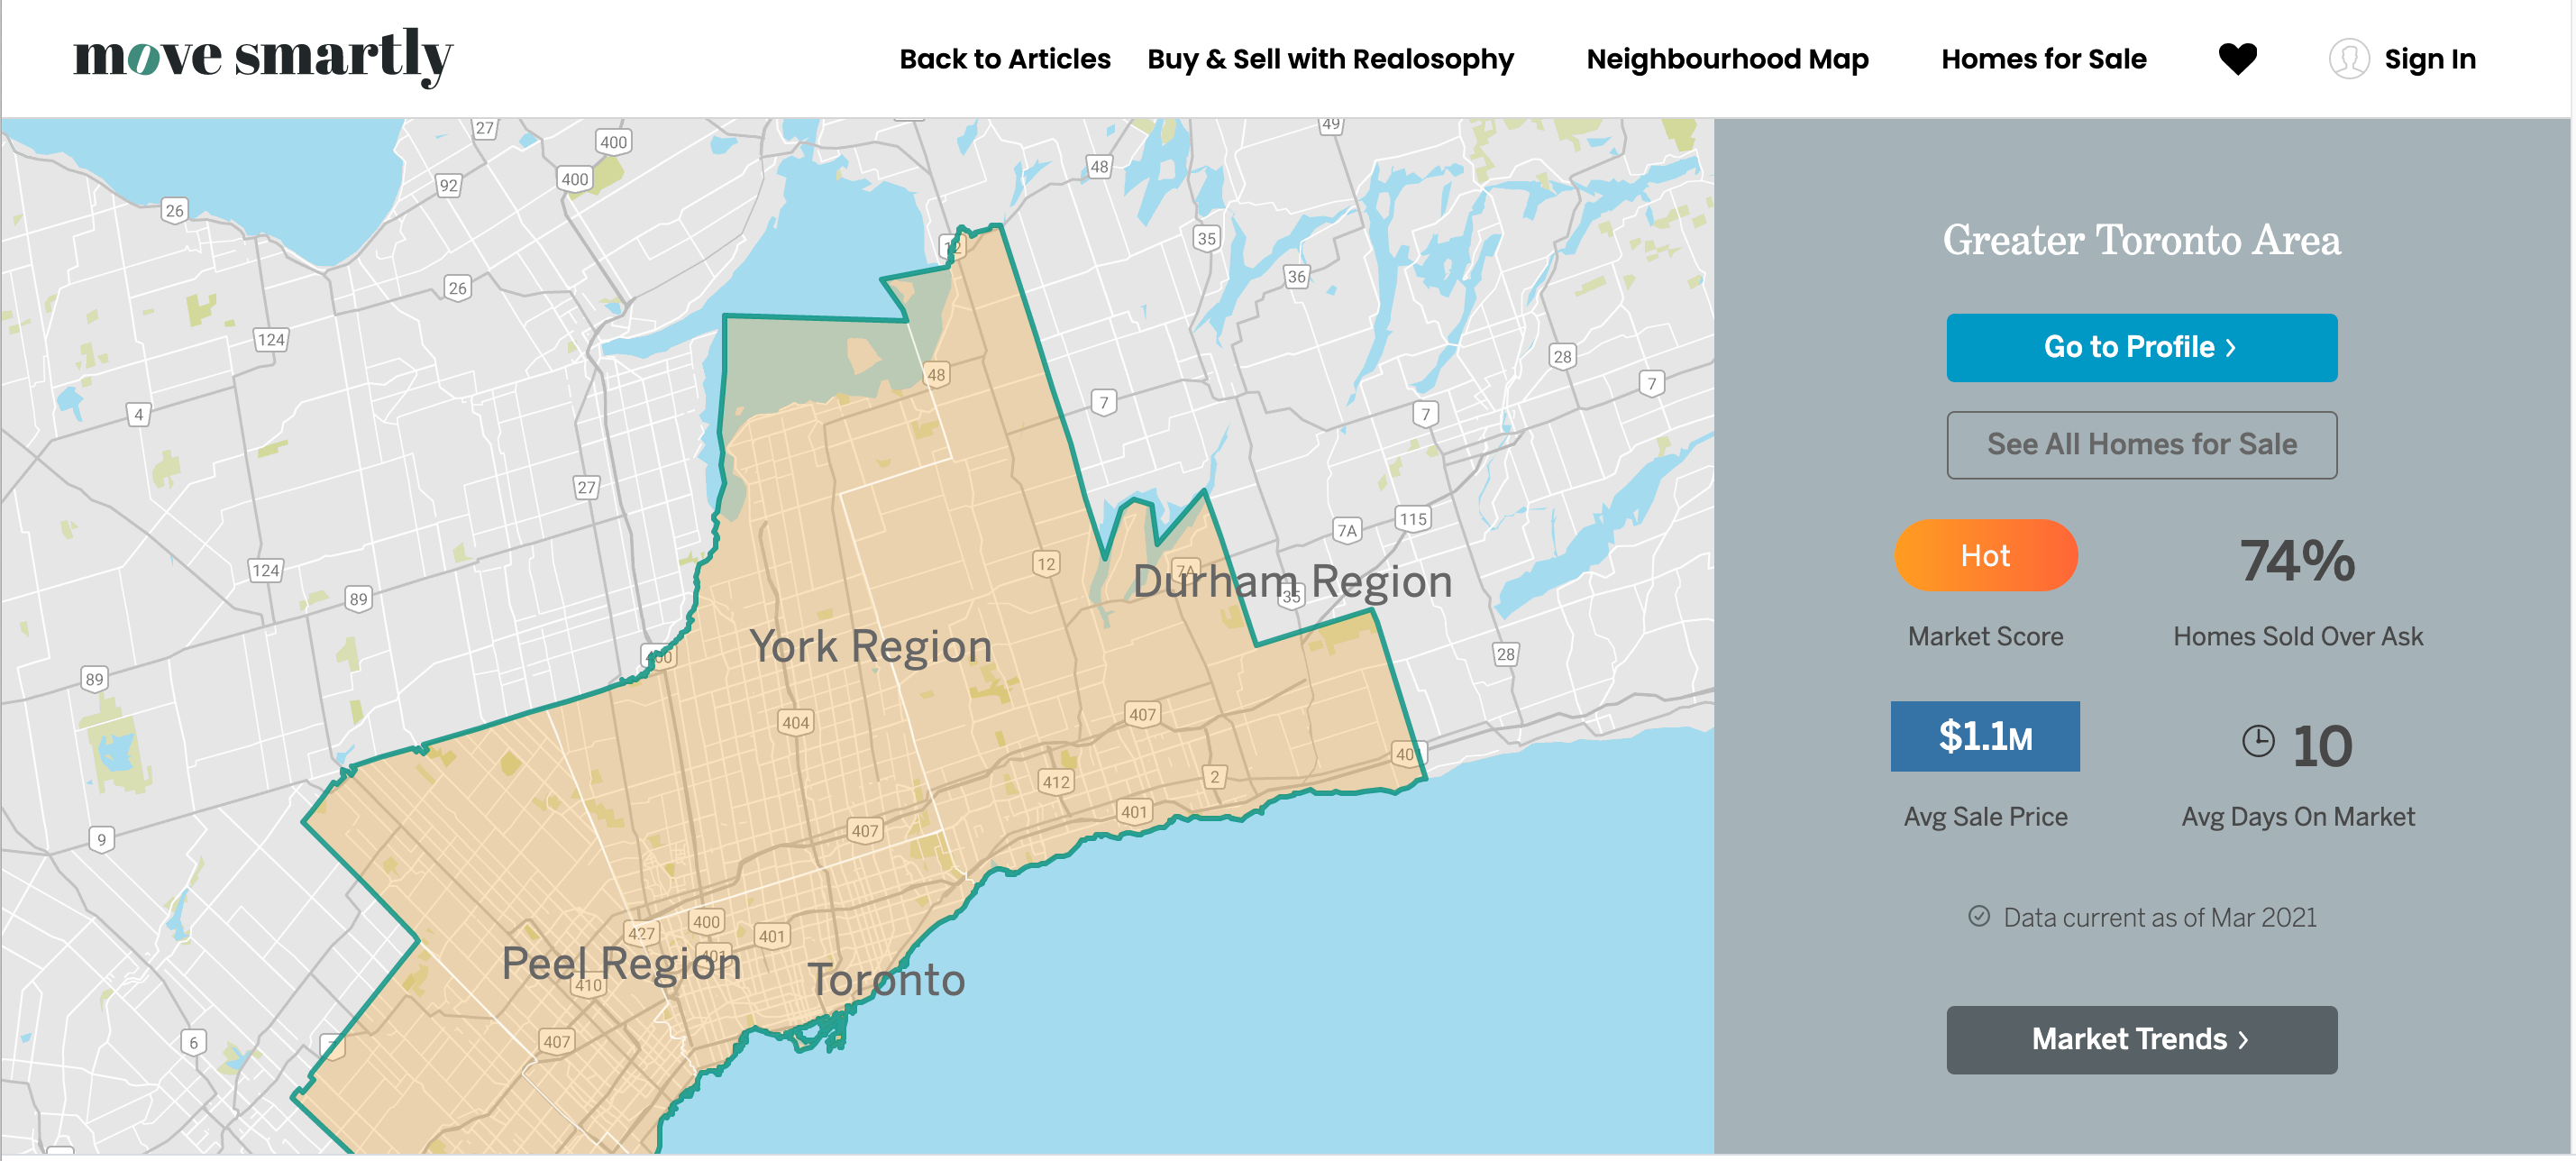
With 79% of houses and 63% of condos selling over the asking price in a pandemic no less, average home buyers are stressed - and confused.
As Featured in the Move Smartly Report:
 The Market Now
Have questions about this unpredictable market? John Pasalis, President of Realosophy Realty and author of the Move Smartly report is hosting a monthly webinar for past and present clients of Realosophy Realty. Hear key takeaways from this month's report and get answers to your questions.
Every month that passes we seem to be breaking yet another record in Toronto’s real estate market and March 2021 was no exception.
March saw the highest number of home sales in a single month ever — a total of 15,262 sold last month, a 90% increase over last year.
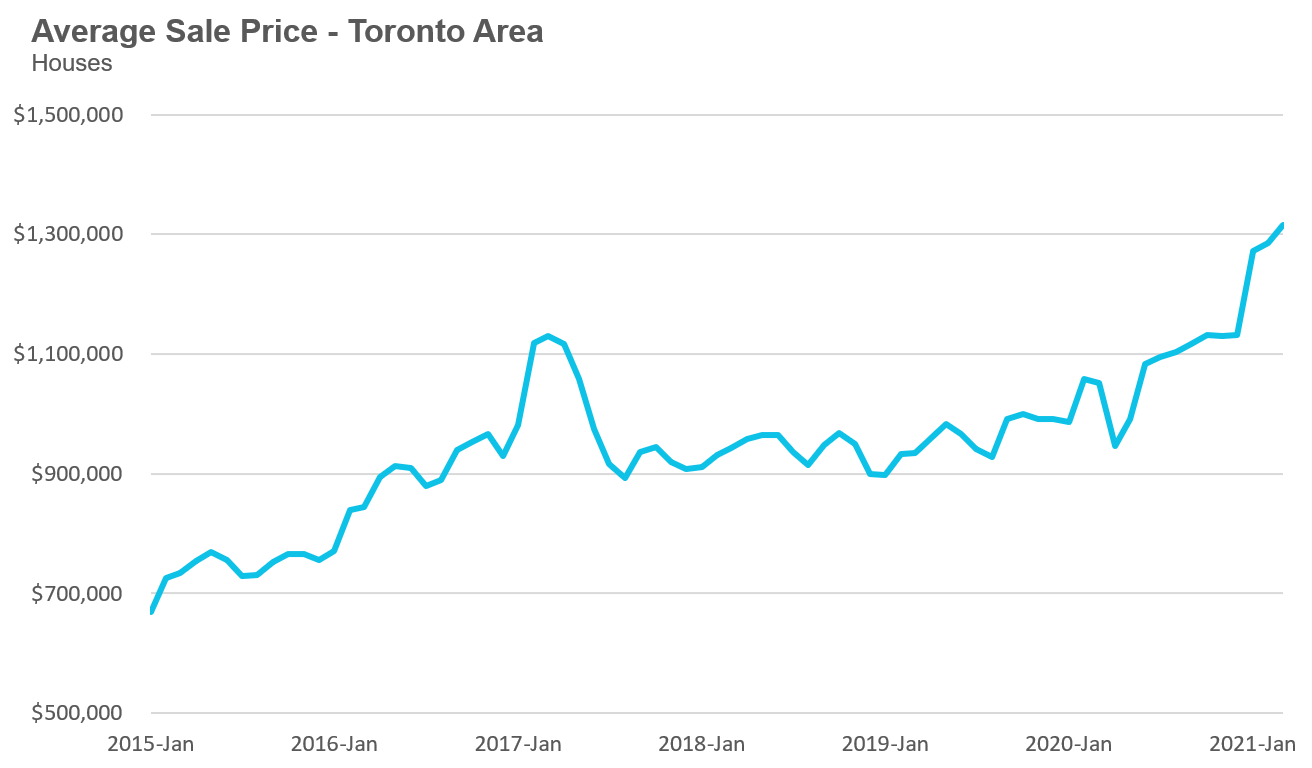
Home prices also hit a record at $1,107,942 up 22% over last year.
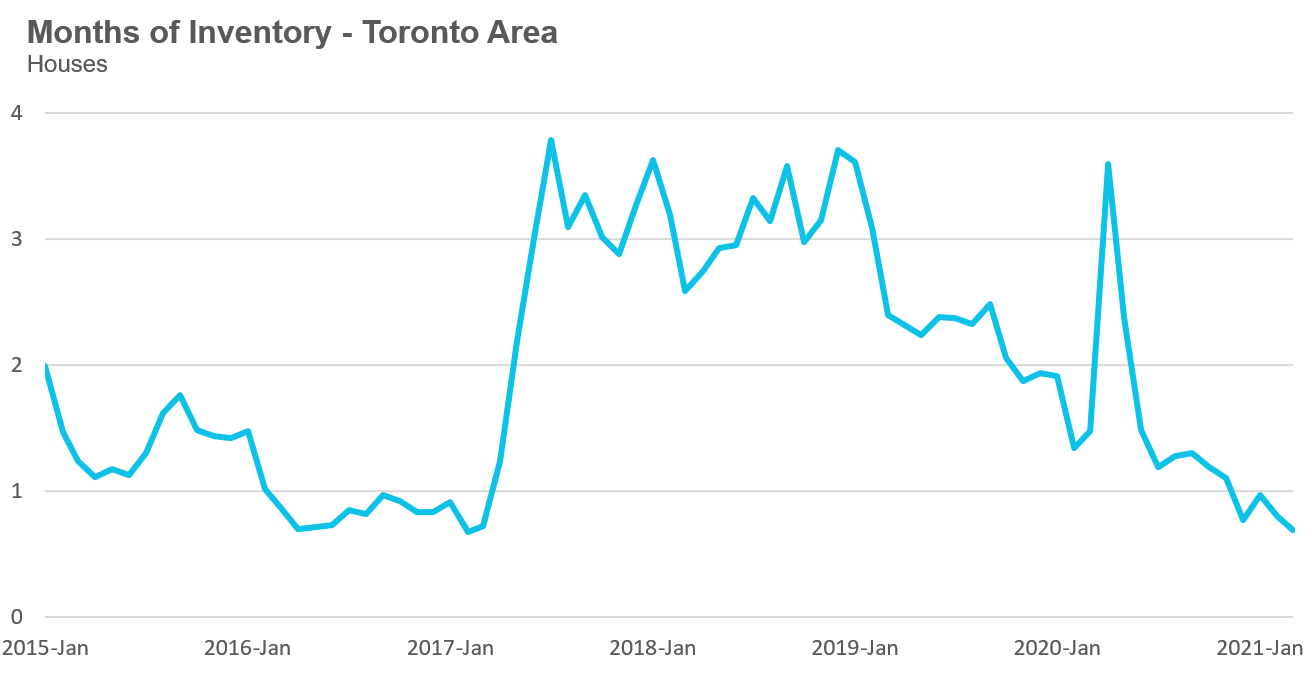
Inventory levels are down to just 0.7 Months of Inventory (MOI) for houses and 0.8 for condos. As a reminder, this means that if no other new homes or condos were listed for sale in just three weeks there would be no homes left for sale in the entire Toronto area.
Many real estate agents and brokers have been reporting some early signs of cooling, but we still need to take these with a grain of salt — at this point, the “cooling market” means homes that were getting 25 offers two months ago are only getting 8-10 offers today.
By the end of March, 79% of all houses are still selling for over the asking price (the same as last month). In the condo market 63% of condos are selling for more than the owner’s asking price, up from 23% in December.
To all of our everyday Toronto area home and condo buying and selling clients at Realosophy Realty and my readers at Move Smartly and my various social platforms who are feeling confused about this current state of affairs, I can only say that I am with you — you are not wrong to be confused.
Given this, there are still many things you can do as a home or condo buyer or seller in an uncertain market to ensure that you and your family benefit from any potential upside while being as protected against any downside as best as possible. That is what my research and my practice as a real estate practitioner, and that of my team at Realosophy Realty, has always been about — and you will find more information in this report speaking to this aim.
And while I, and all of my colleagues, will always be bullish on Canada, and more particularly the Toronto & Greater Toronto Area, as being one of the most diverse and dynamic social and economic regions in the world on the strength of its residents — I do have some strong concerns about what our policymakers are doing to keep this strength strong. More on that too, in this report.
Monthly Statistics
House Statistics
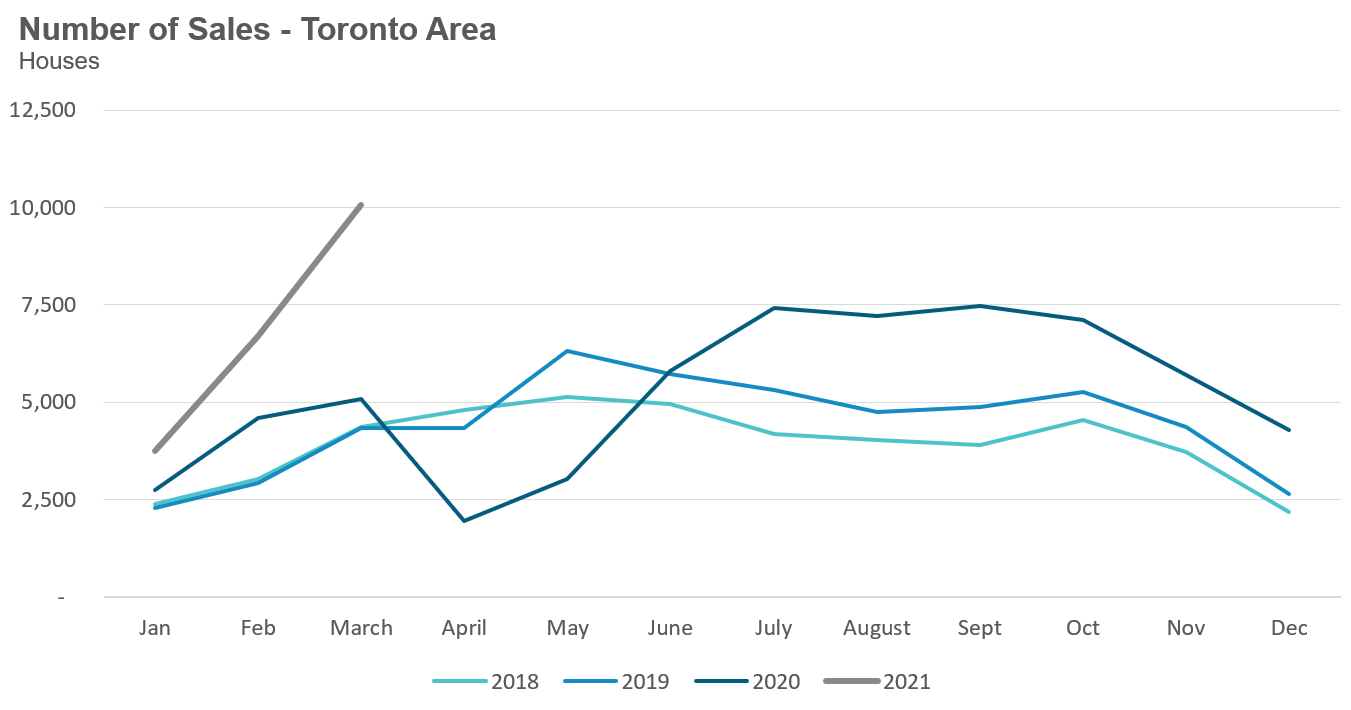
House sales (detached, semi-detached, townhouse, etc.) in the Toronto area in March 2021 were up 98% over the same month last year. The 10,068 sales last month was the highest number of sales ever for Toronto’s housing market.
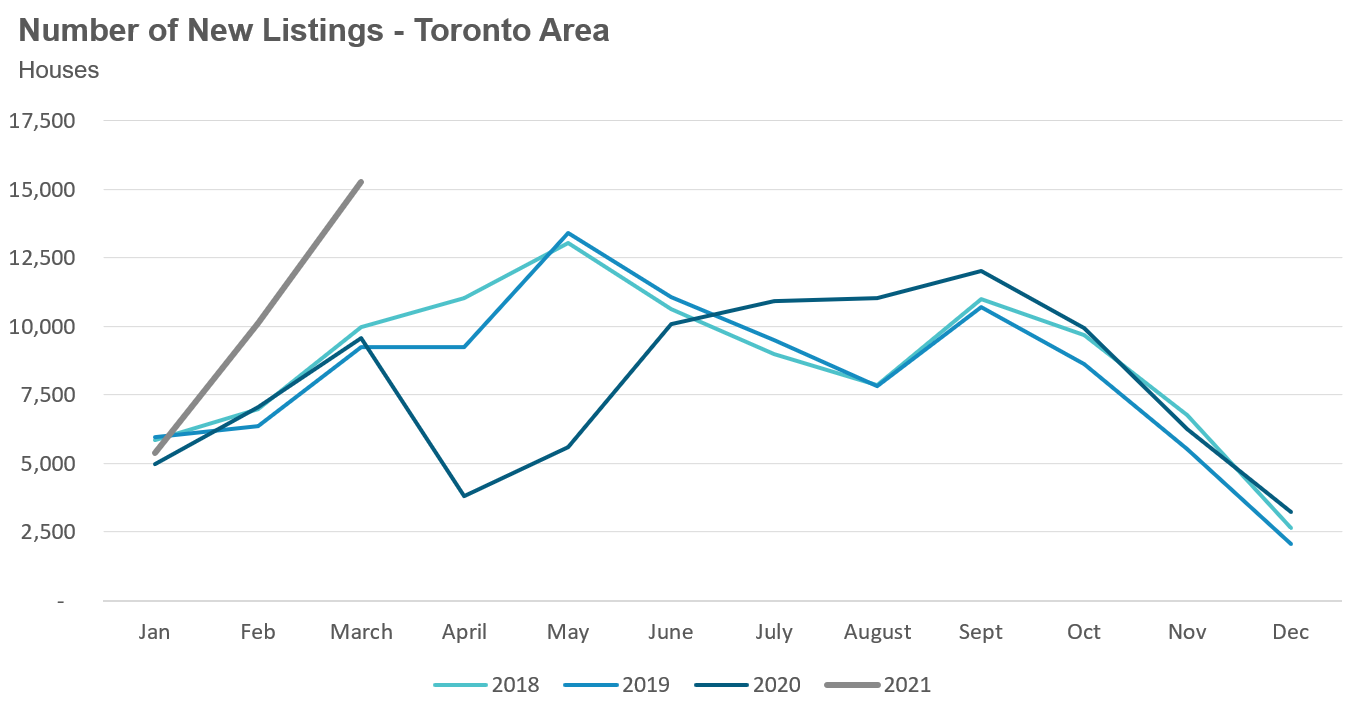
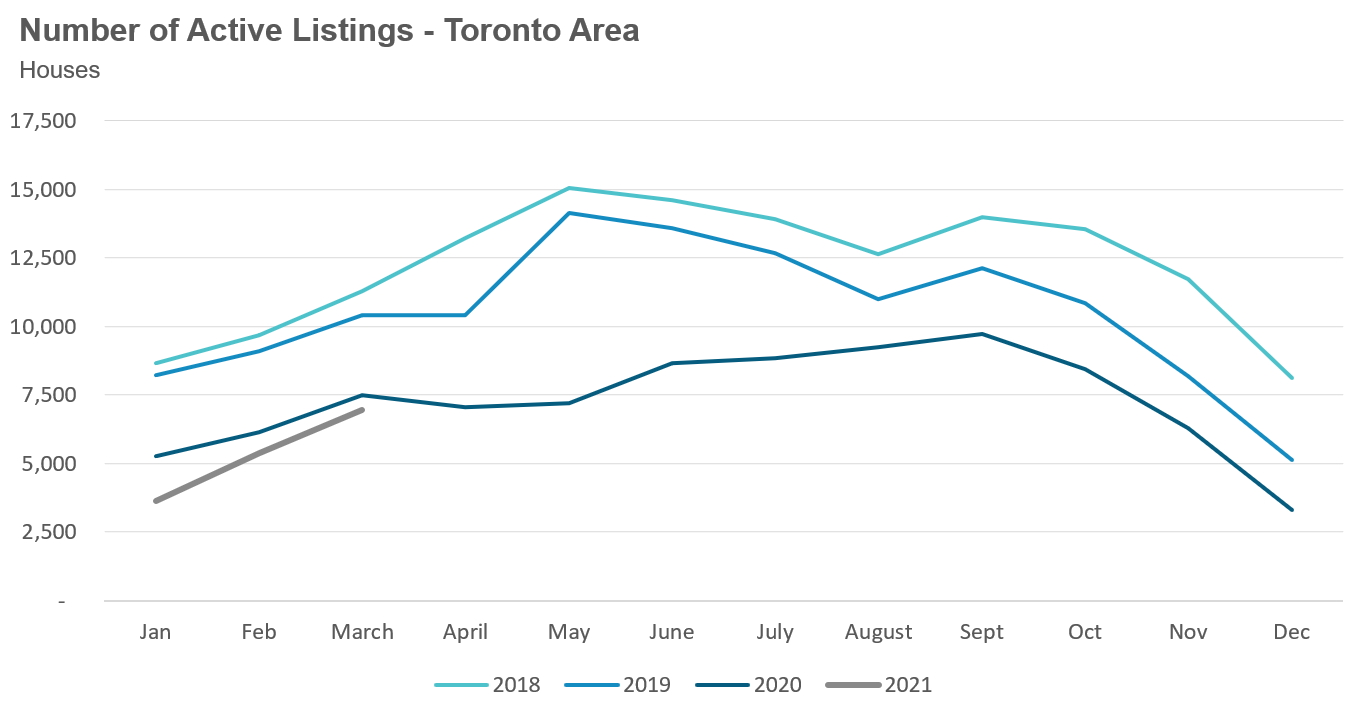
New listings in March were up 59% over last year while the number of homes available for sale (“active listings”) was down 7% when compared to the same month last year.
The Months of Inventory ratio (MOI) looks at the number of homes available for sale in a given month divided by the number homes that sold in that month. It answers the following question: If no more homes came on the market for sale, how long would it take for all the existing homes on the market to sell given the current level of demand?
The higher the MOI, the cooler the market is. A balanced market (a market where prices are neither rising nor falling) is one where MOI is between four to six months. The lower the MOI, the more rapidly we would expect prices to rise.
The market remained very competitive in March with an MOI of just 0.7 months.
While the current level of the MOI gives us clues into how competitive the market is on the ground today, the direction it is moving in also gives us some clues into where the market may be heading. The MOI has remained relatively stable at or below 1 MOI for the past four months.
The competition for houses has picked up considerably since December when 50% of houses were selling for more than the owner’s asking price. For the second month in a row, 79% of houses sold for more than the owner’s asking price.
Strong demand coupled with very low inventory levels helped push average house prices up to another record high of $1.316M and up 25% over last year.
Median house prices are up by 28% over last year.
Condo Statistics
Condominium (condo) sales (condo apartments, condo townhouses, etc.) in March were up by 75% over last year.
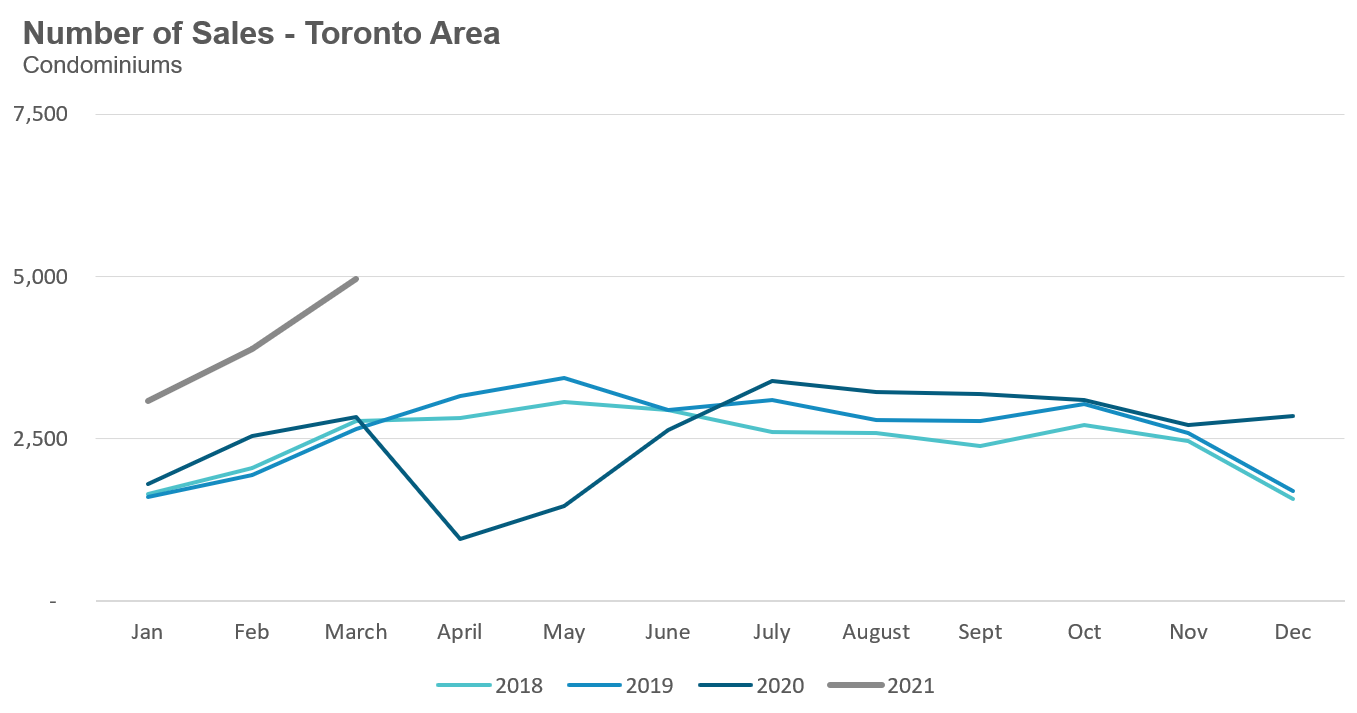
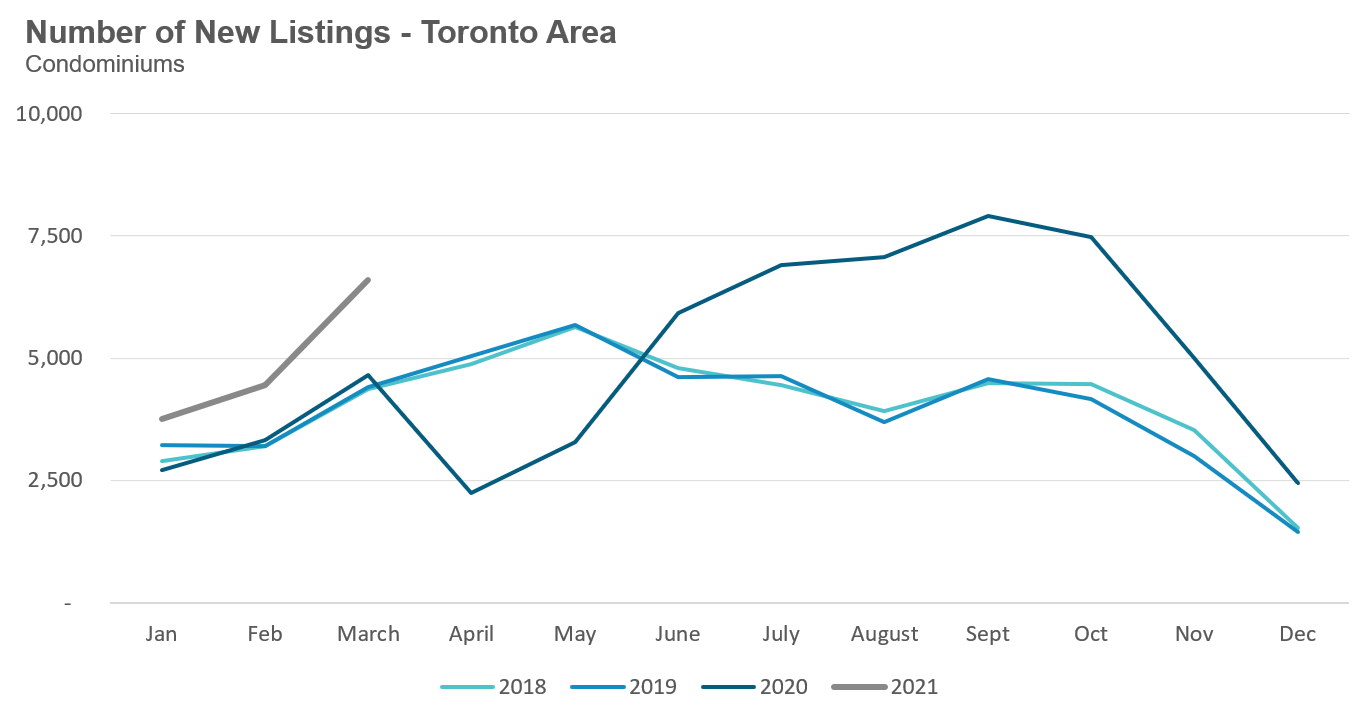
New condo listings were up by 42% in March 2021 over last year while active listings were also up 24% over last year.
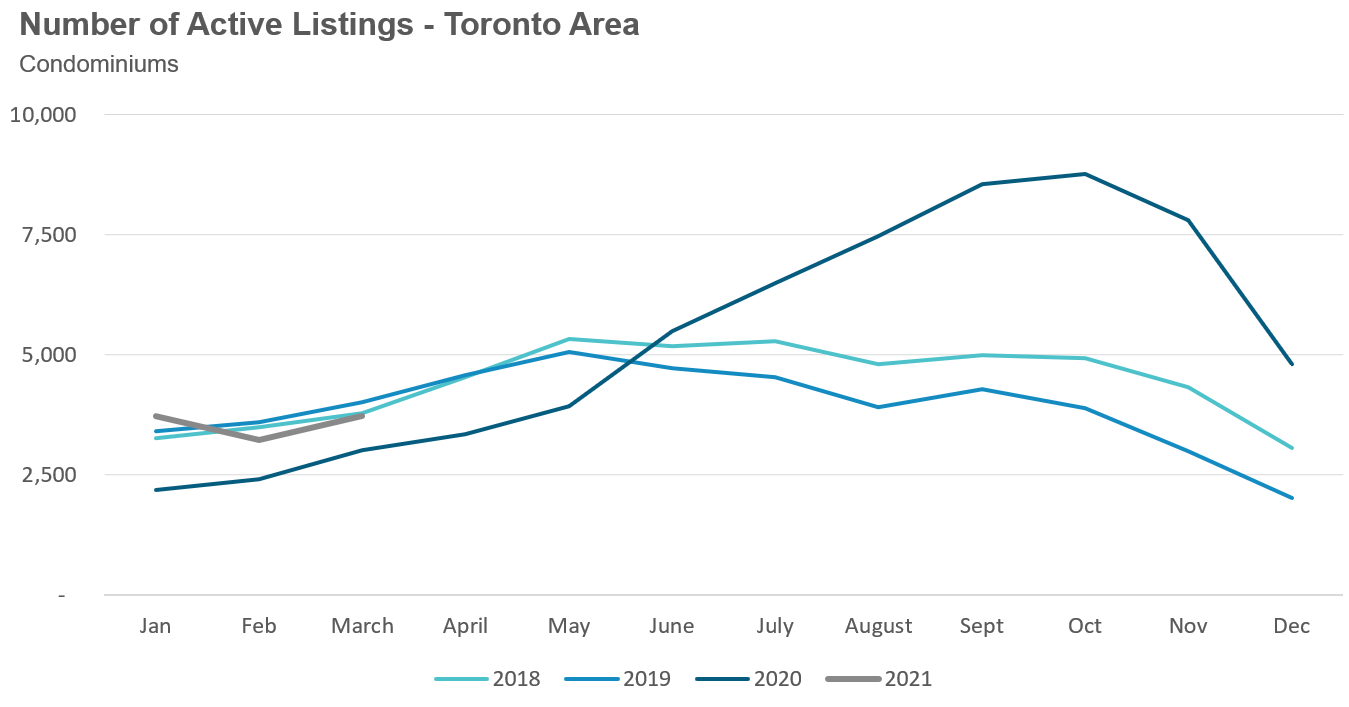
Active listings were up on a month over month basis for the first time since October when active condo listings peaked at 8,772.
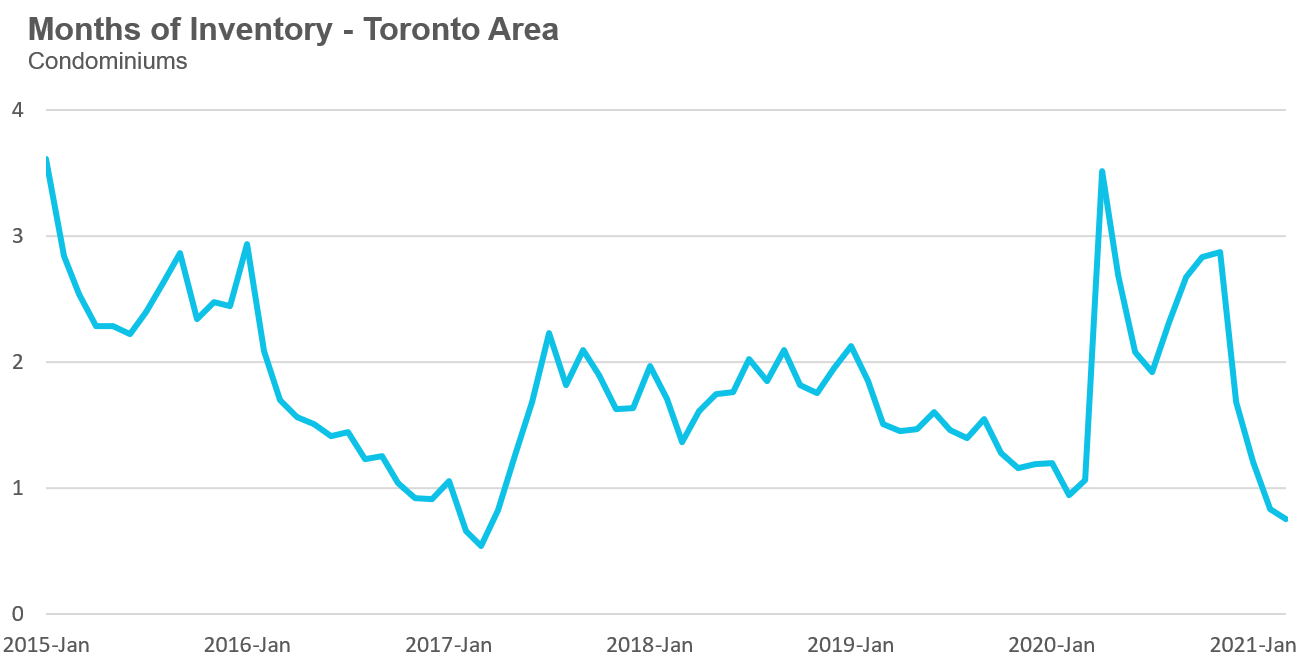
But the strong growth in sales is leading to a more competitive condo market with the MOI decreasing from just under 2.9 months in November to 0.8 in March.
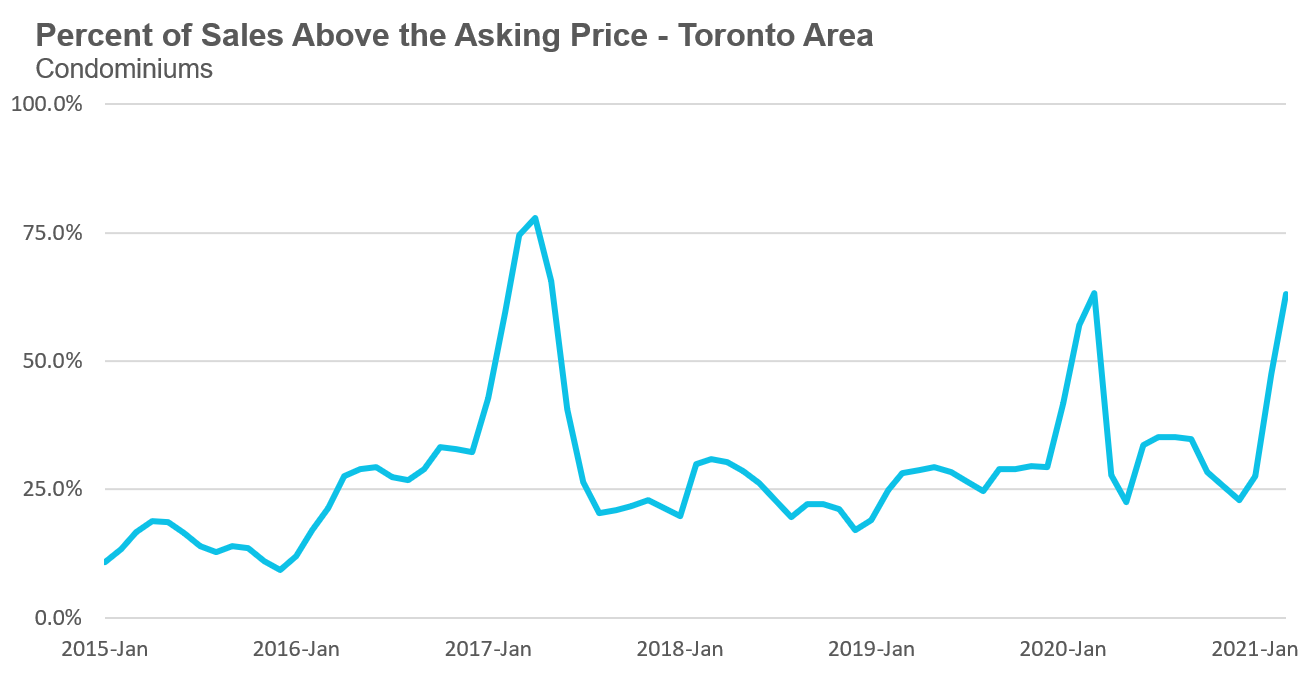
The competition for condos has picked up considerably since December when 23% of condos were selling for more than the owner’s asking price. In March 2021 63% of condos sold for more than the owner’s asking price.
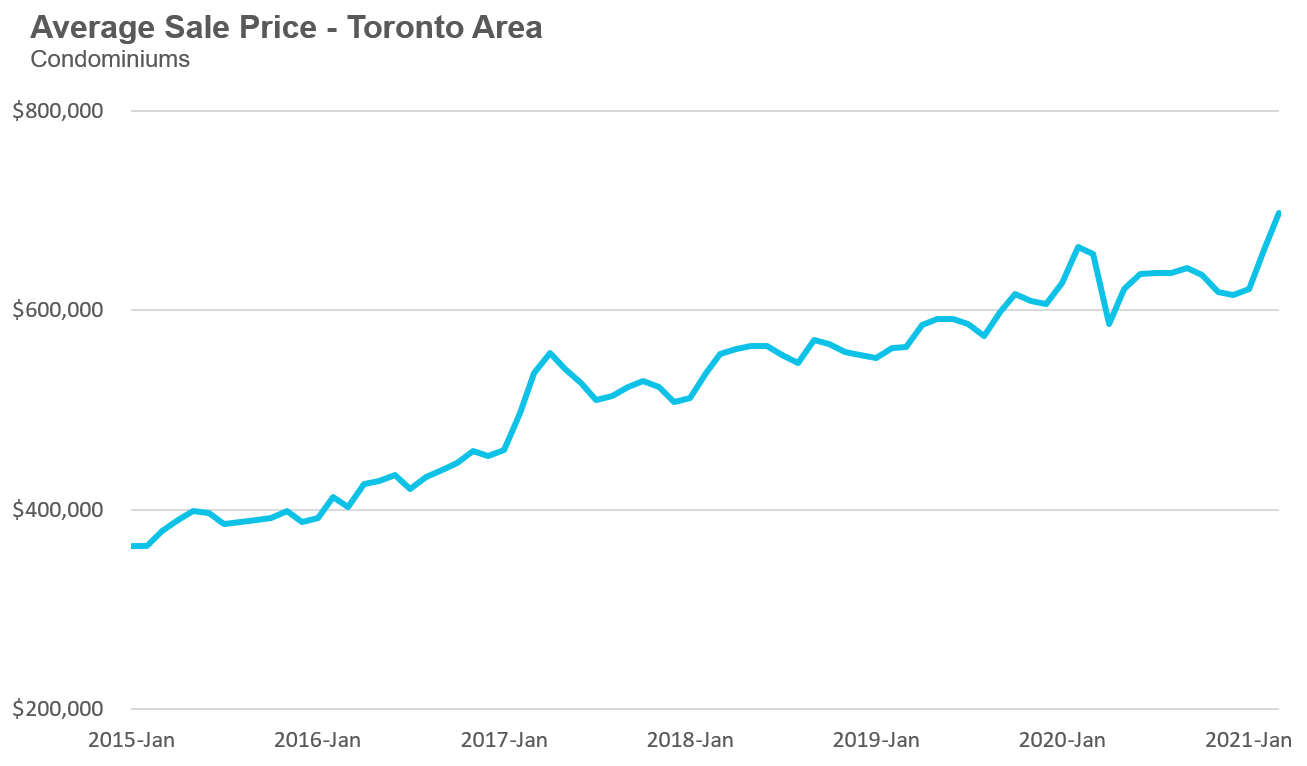
Toronto area condo prices are up 6% over last year. The increase was led by the suburbs where condo prices are up by more than 10% while prices in the City of Toronto are up just 1% over last year.
Regional Trends
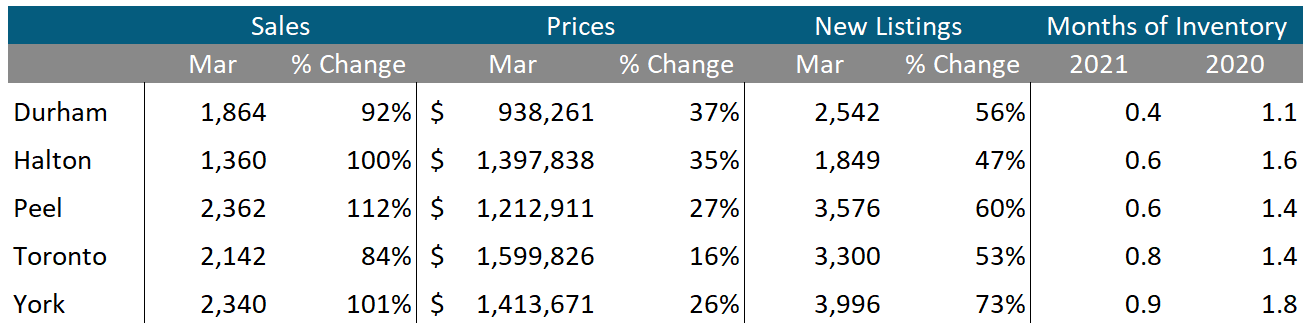
Houses
Sales across all five regions in the GTA were up significantly in March. Average prices were up 26%-37% in the suburbs while prices in the City of Toronto were up 16%. Despite the increase in new listings inventory levels are at or below 1 month across the entire GTA.
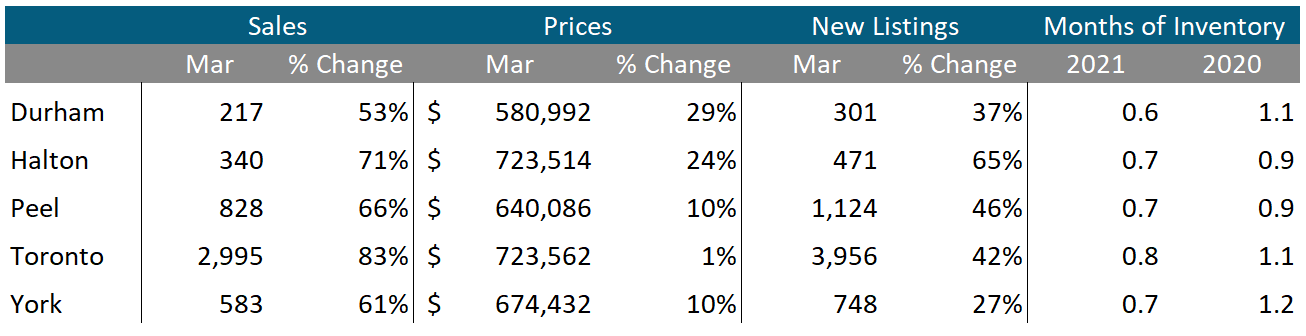
Condos
The surge in condominium sales continued in March across the entire GTA. Average prices were up across the suburban regions with the City of Toronto recording a slight increase over last year.
Inventory levels are below last year’s levels for all five regions.
Browse All Regional Market Trends for March 2021 on Movesmartly.com:
Greater Toronto Area Market Trends
Market Performance by Neighbourhood Map, Toronto and the GTA
More Data for Realosophy Clients
Realosophy clients can access the same information above plus additional information on every home for sale, including building permit history, environmental alerts and more. Visit Realosophy.com/buy or contact your Realosophy agent for more details.
Top Image Credit: Getty/iStock
The Move Smartly monthly report is powered Realosophy Realty Inc. Brokerage, an innovative residential real estate brokerage in Toronto. A leader in real estate analytics, Realosophy educates consumers at Realosophy.com and MoveSmartly.com and helps clients make better decisions when buying and selling a home.
Email report author John Pasalis, Realosophy President
