The slowdown we were first seeing on the ground over the past two months is now showing in the numbers.
As Featured in the monthly Move Smartly Report - watch story video above, read story below and go to report to read all stories for the month
FREE PUBLIC WEBINAR: The Market Now with John Pasalis
Join John Pasalis, report author, leading market analyst and Move Smartly contributor, and President of Realosophy Realty, and in a free monthly webinar as he discusses key highlights from this report, with added timely observations about new emerging issues, and answers your questions. A must see for well-informed Toronto area real estate consumers.
In my past two monthly reports, I have discussed early signs that Toronto’s housing market is beginning to cool. This is the first month we are seeing this cooldown reflected in the monthly statistics.
And the changes are significant.
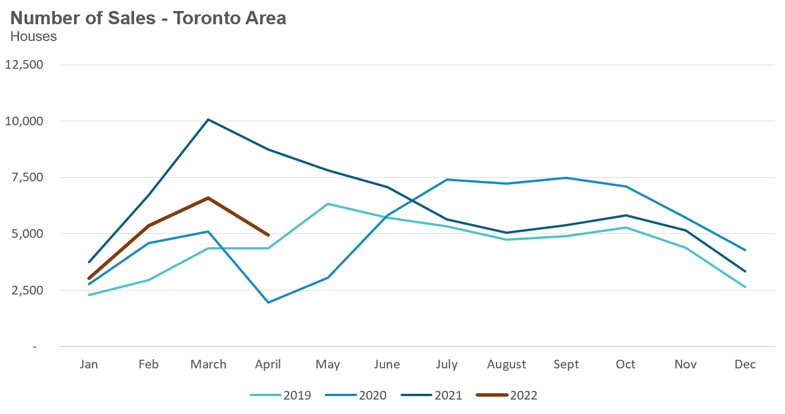
House sales in April are down 26% over March, a period in which sales are usually trending up, and average prices for low-rise suburban houses have been declining over the past two months. House sales were down 44% on a year-over-year basis.
The average price for a house in April was $1,527,743 down from $1,679,429 in February, but up 17% over last year; the median house price in April was $1,348,94, down from $1,485,000 in February, but up 18% over last year.
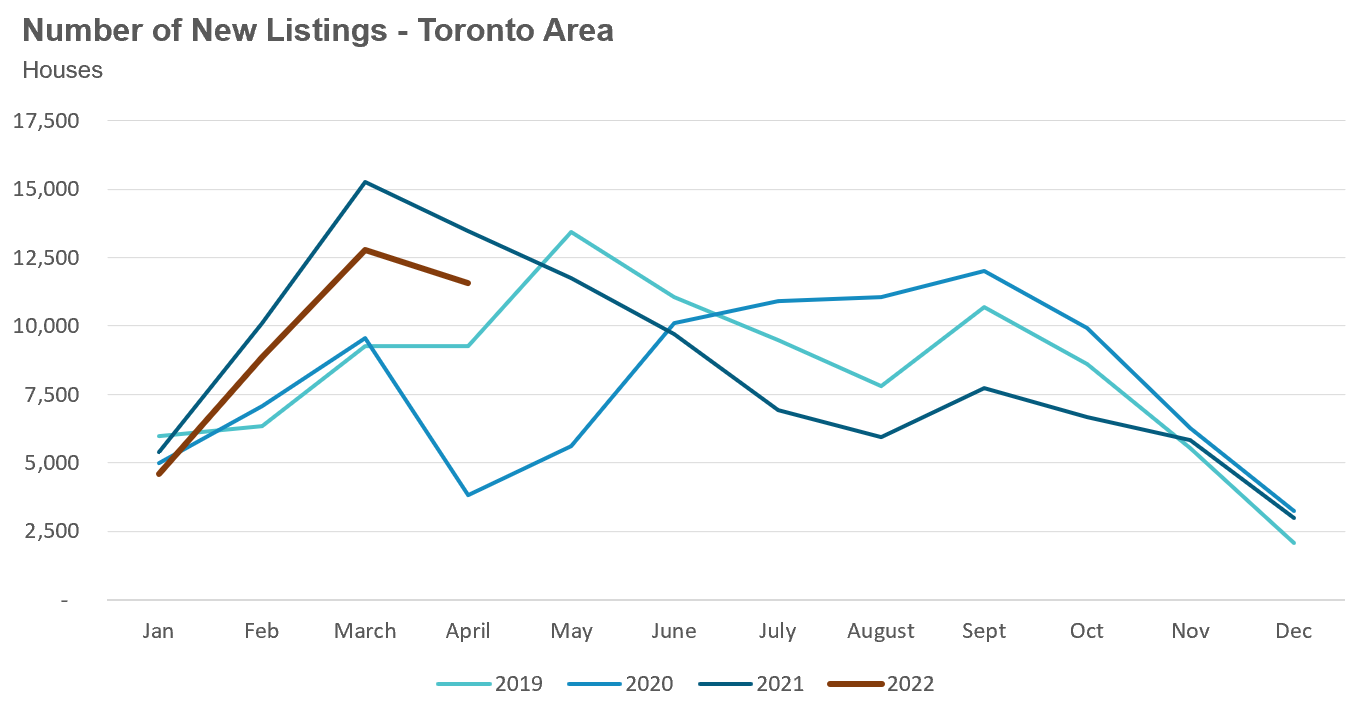
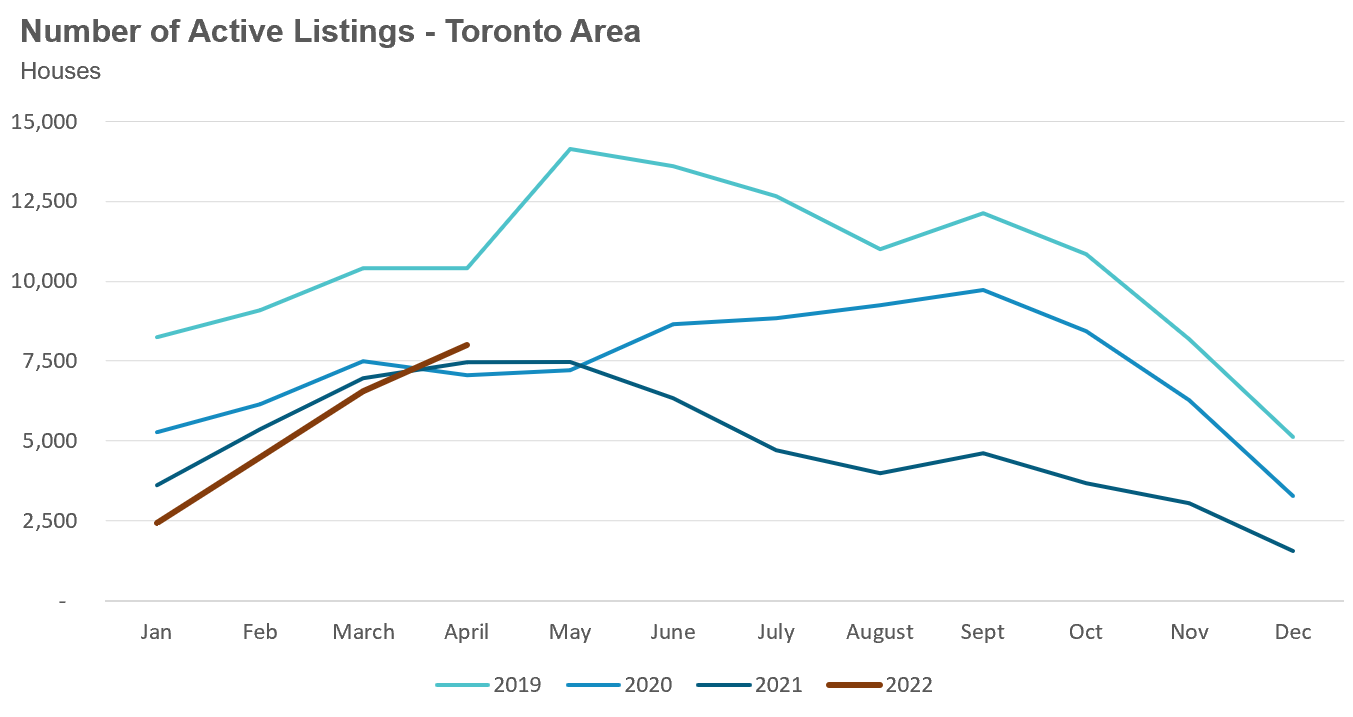
New house listings in April were down 14% over last year, but still very strong compared to previous years while the number of houses available for sale at the end of the month, or active listings, at the end of April was up 7% over last year.
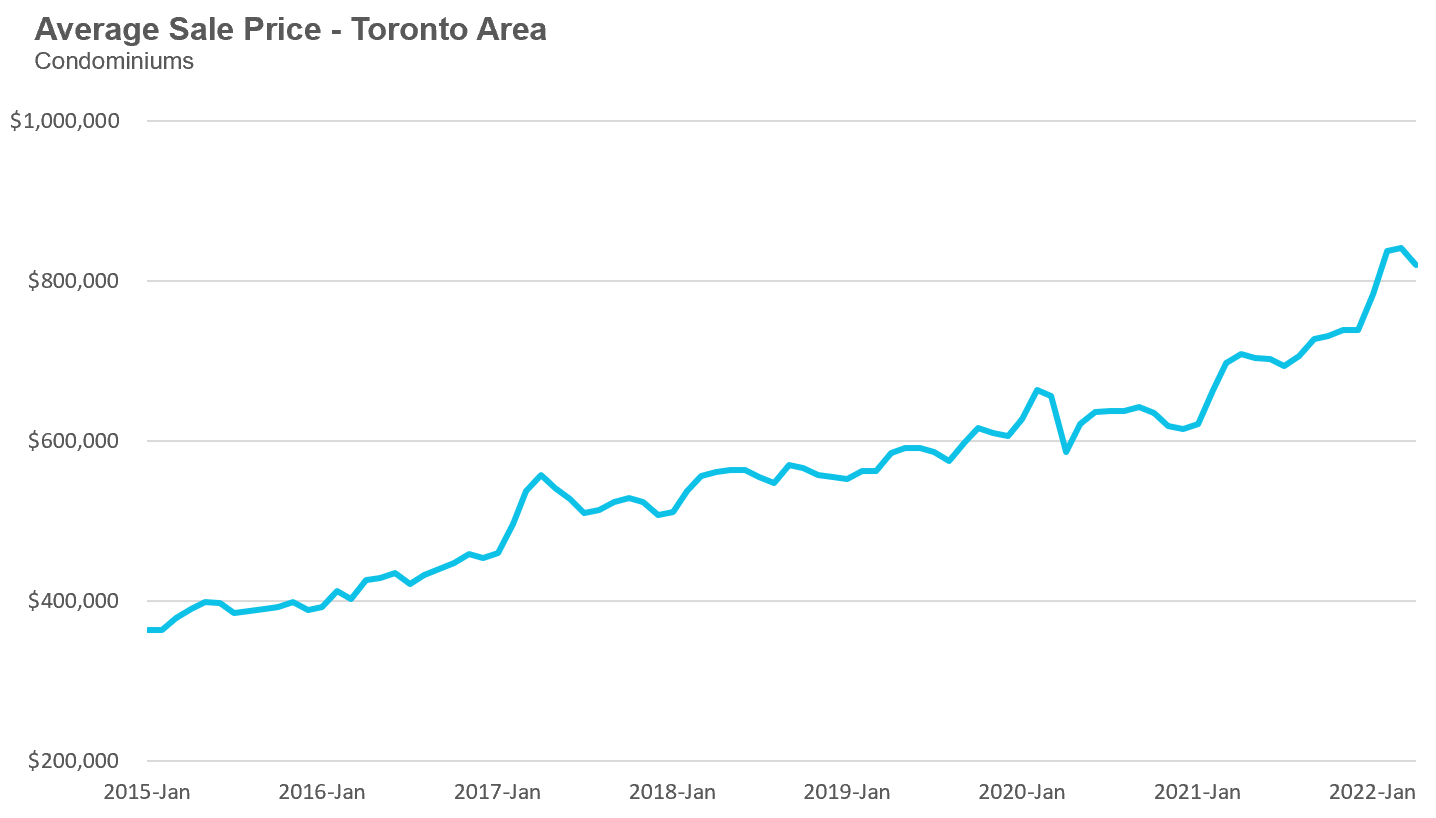
The average price for a condo in April fell to $819,698, down from $840,444 in March. The average price is up 16% over last year. The median price for a condo in April was $750,000, up 16% over last year, but down from $777,000 over last month.
Condo sales were down 35% in April over last year and below pre-Covid sales volumes in 2019.
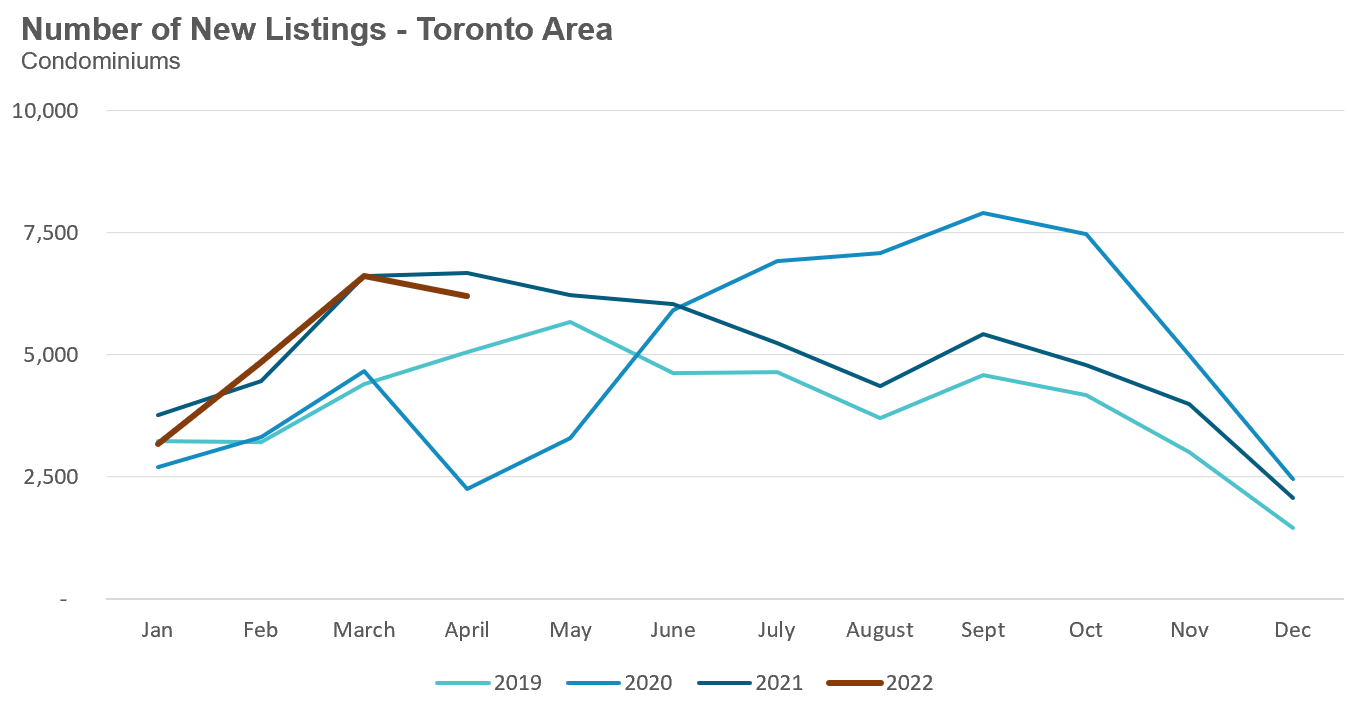
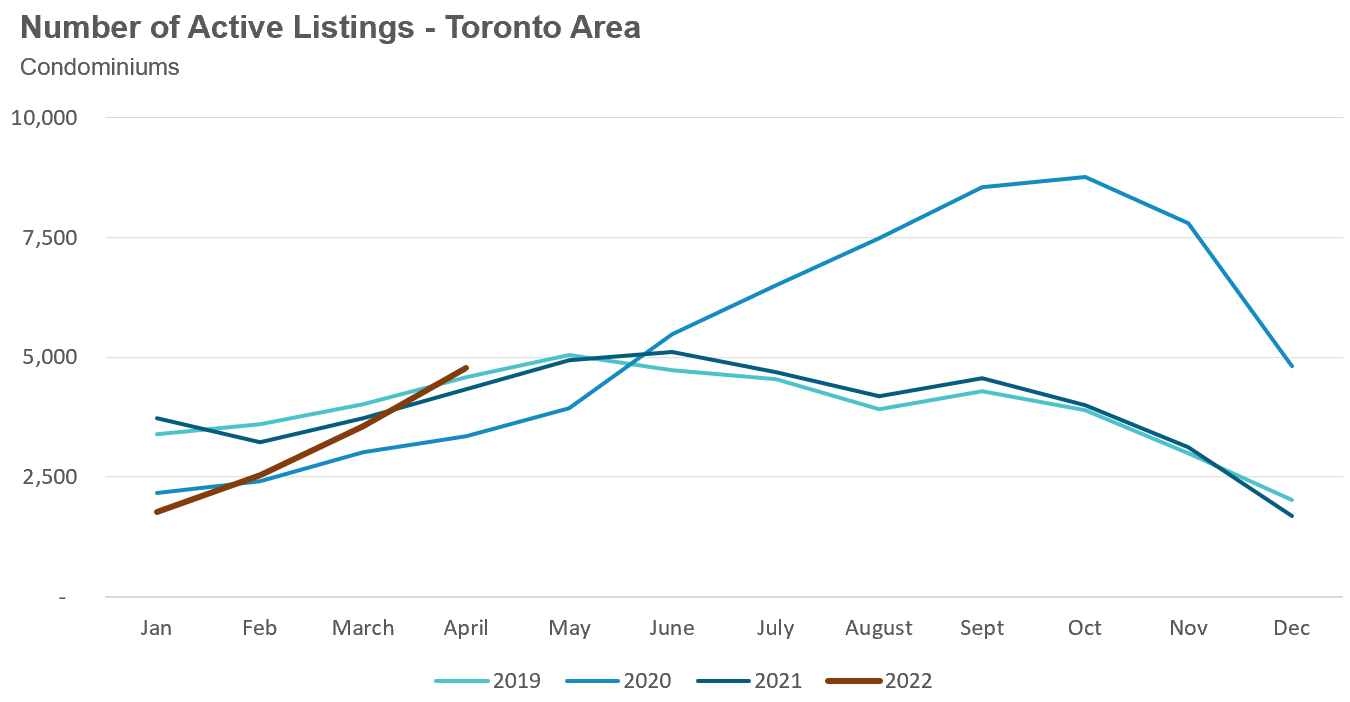
New condo listings were down 7% over last year, but well ahead of the new listing volume in 2019 and 2020. The number of active listings for condos was up 10% over last year.
Here are the monthly statistics for the Toronto Area, including house, condo and regional breakdowns, see the final section of this report.
Monthly Statistics
House Statistics
House sales (low-rise detached, semi-detached, townhouse, etc.) in the Toronto area (GTA) in April 2022 were down 44% over the same month last year, but slightly above levels for the same month in pre-Covid 2019. However, the more important trend is that house sales are trending down during a period when they should be trending up. The downward trend in sales in 2020 was due to initial lockdowns in Ontario due to the Covid-19 pandemic.
New house listings in April were down 14% over last year, but well above the volume seen in 2019 and 2020.
The number of houses available for sale (“active listings”) was up 7% when compared to the same month last year but still 23% below pre-Covid levels in 2019.
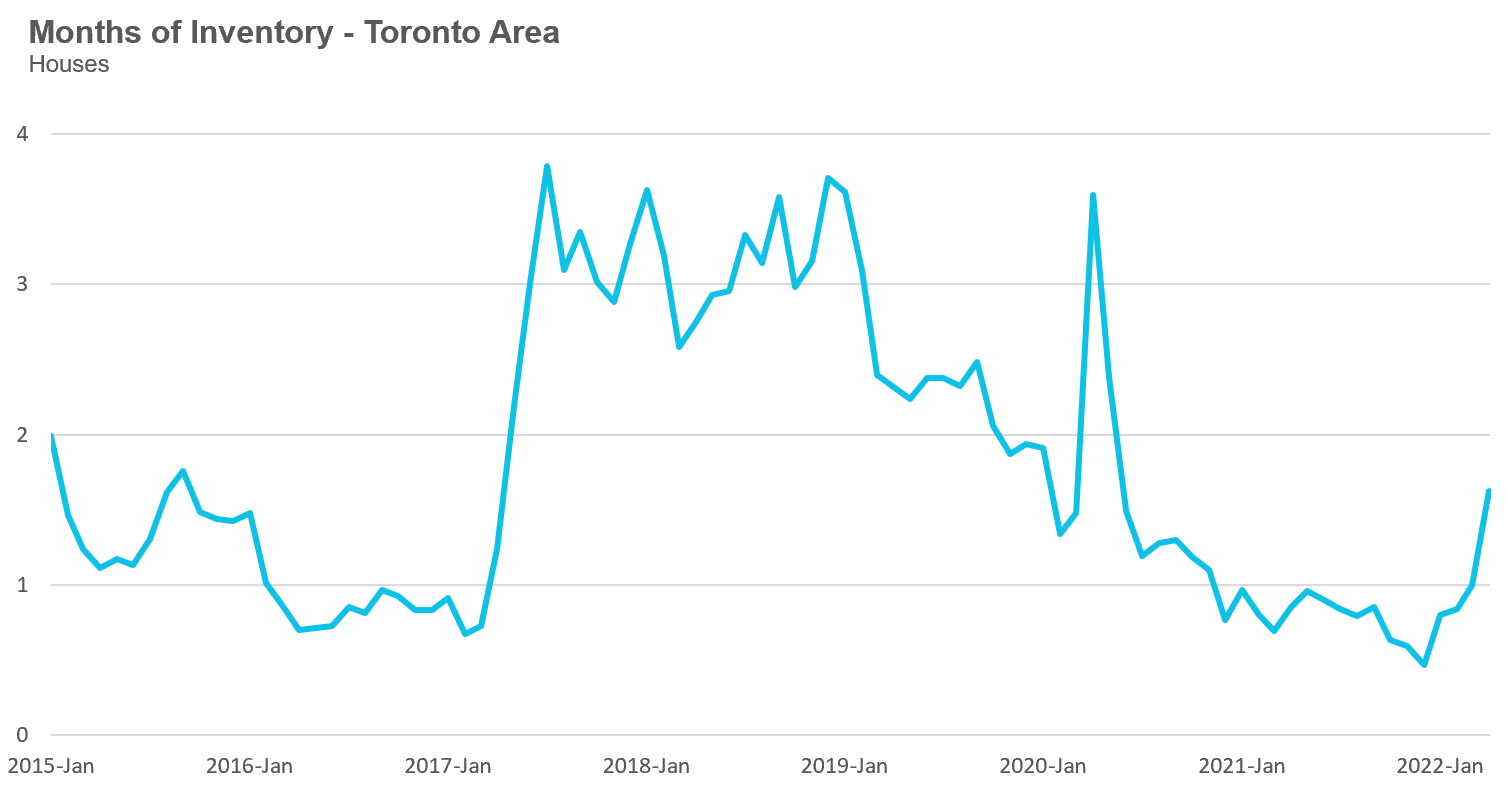
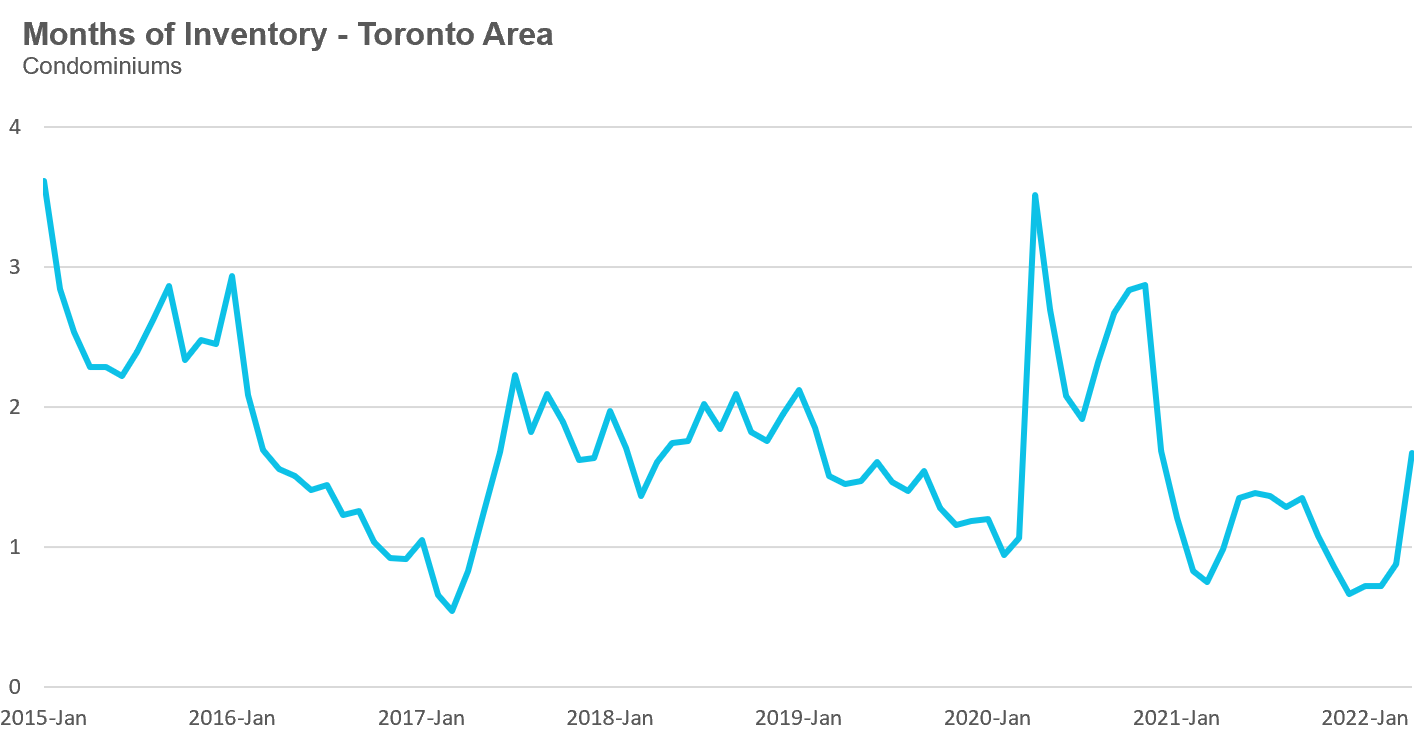
The Months of Inventory ratio (MOI) looks at the number of homes available for sale in a given month divided by the number of homes that sold in that month. It answers the following question: If no more homes came on the market for sale, how long would it take for all the existing homes on the market to sell given the current level of demand?
The higher the MOI, the cooler the market is. A balanced market (a market where prices are neither rising nor falling) is one where MOI is between four to six months. The lower the MOI, the more rapidly we would expect prices to rise.
While the current level of MOI gives us clues into how competitive the market is on-the-ground today, the direction it is moving in also gives us some clues into where the market may be heading.
While below a very competitive 1 MOI since last year, house inventory in the Toronto area increased to 1.6 MOI in April.
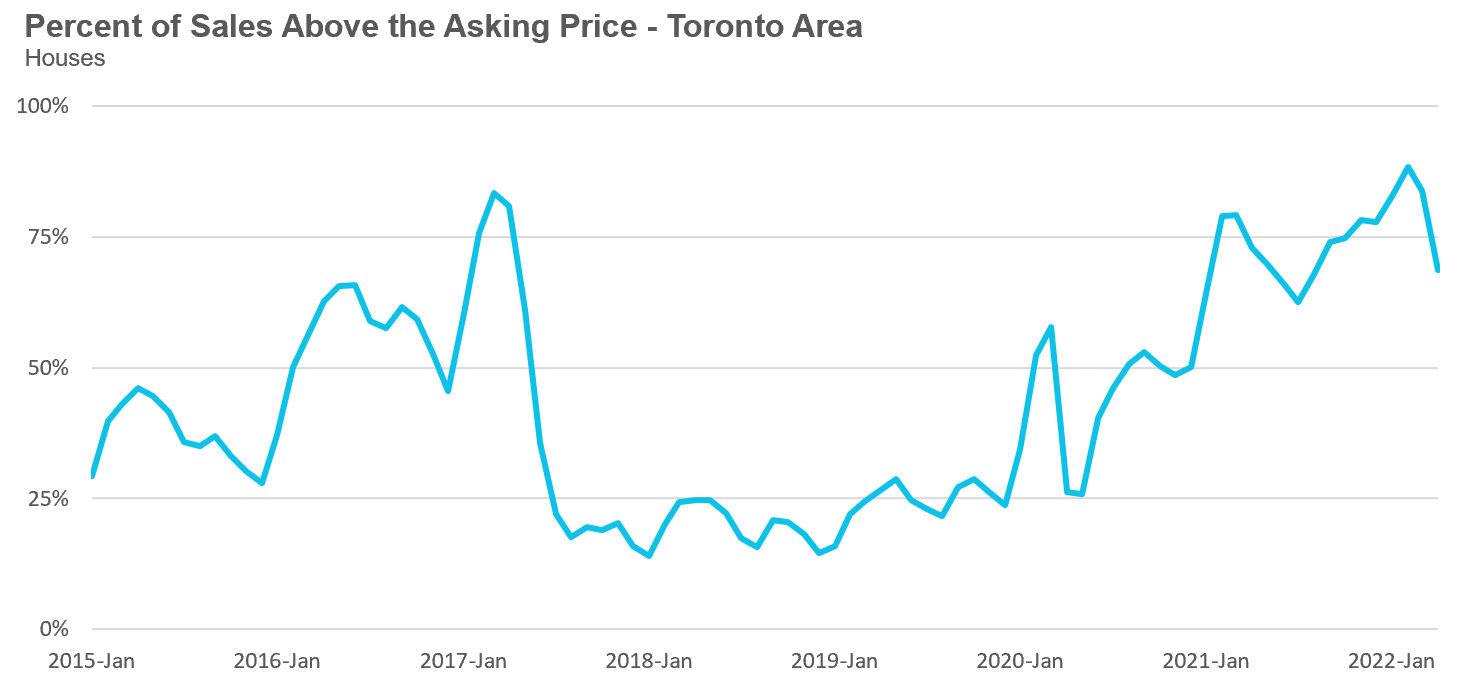
The share of houses selling for more than the owner’s asking price declined to 69% in April.
The average price for a house declined month-over-month to $1,527,743 in April 2022 and is well below the peak of $1,679,429 reached in February. Compared to last year, the average price in April is up 17%.
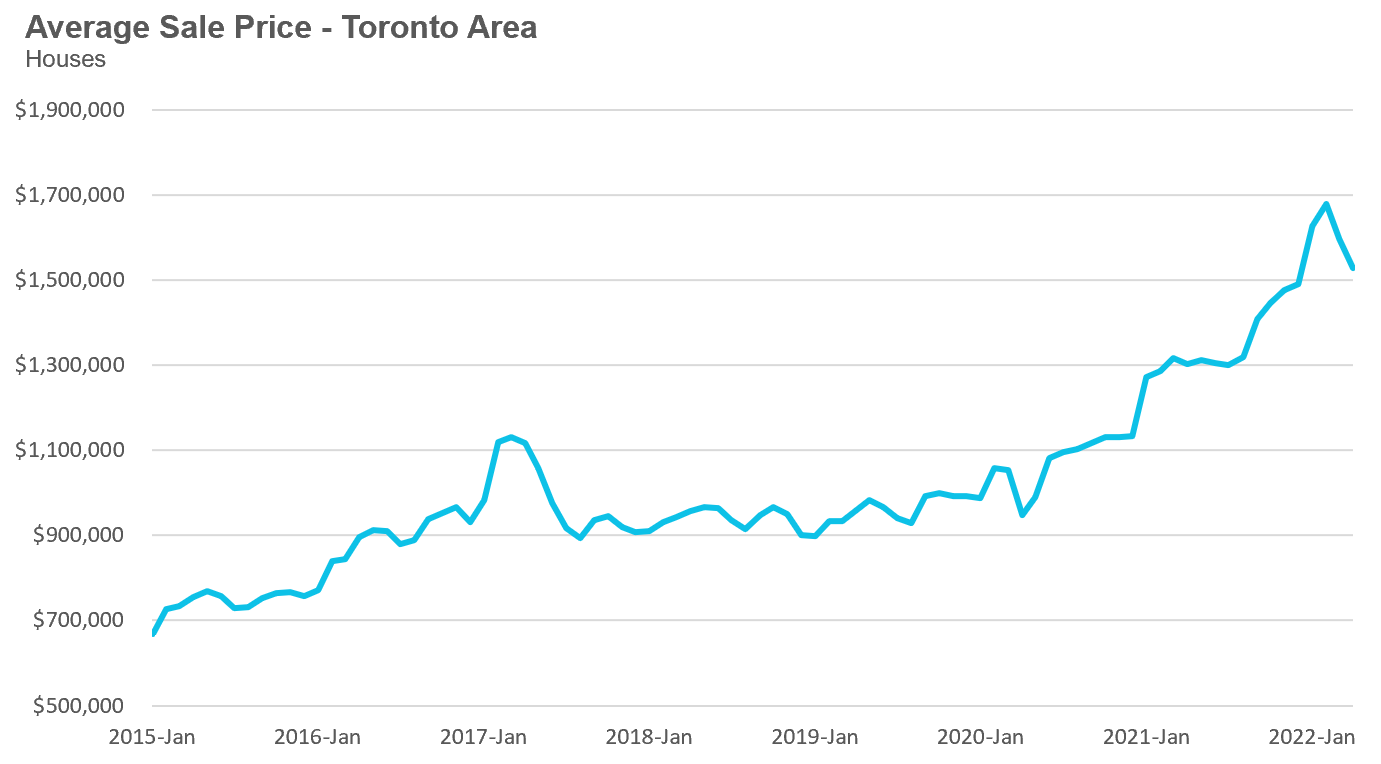
The median house price in April was $1,348,940, up 18% over last year, but below the peak of $1,485,000 reached in February.
The median is calculated by ordering all the sale prices in a given month and then selecting the price that is in the midpoint of that list such that half of all home sales were above that price and half are below that price. Economists often prefer the median price over the average because it is less sensitive to big increases in the sale of high-end or low-end homes in a given month which can skew the average price.
Condo Statistics
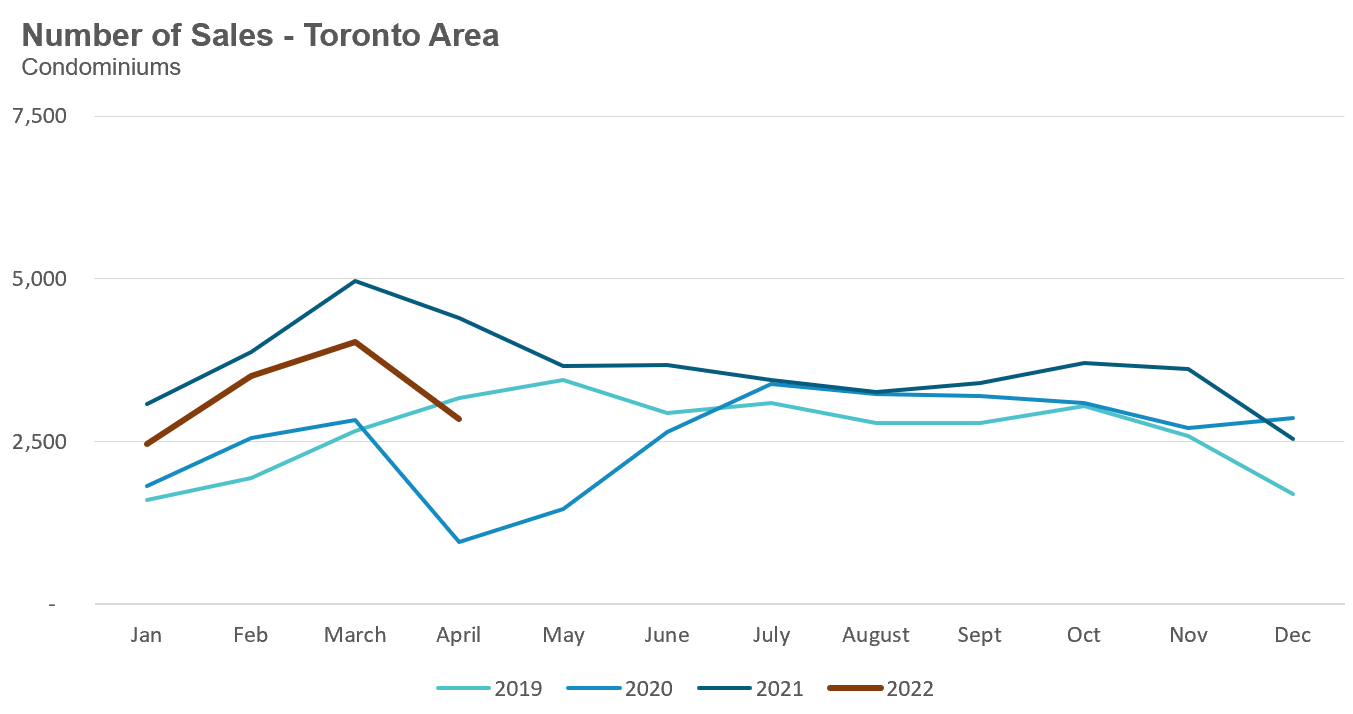
Condo (condominiums, including condo apartments, condo townhouses, etc.) sales in the Toronto area in April 2022 were down 35% over last year and below pre-Covid sales volumes in 2019.
New condo listings were down 7% April over last year and well ahead of the listing volume in 2019 and 2020.
The number of condos available for sale at the end of the month, or active listings, was up 10% over last year.
The MOI increased to 1.7 in the month of April.
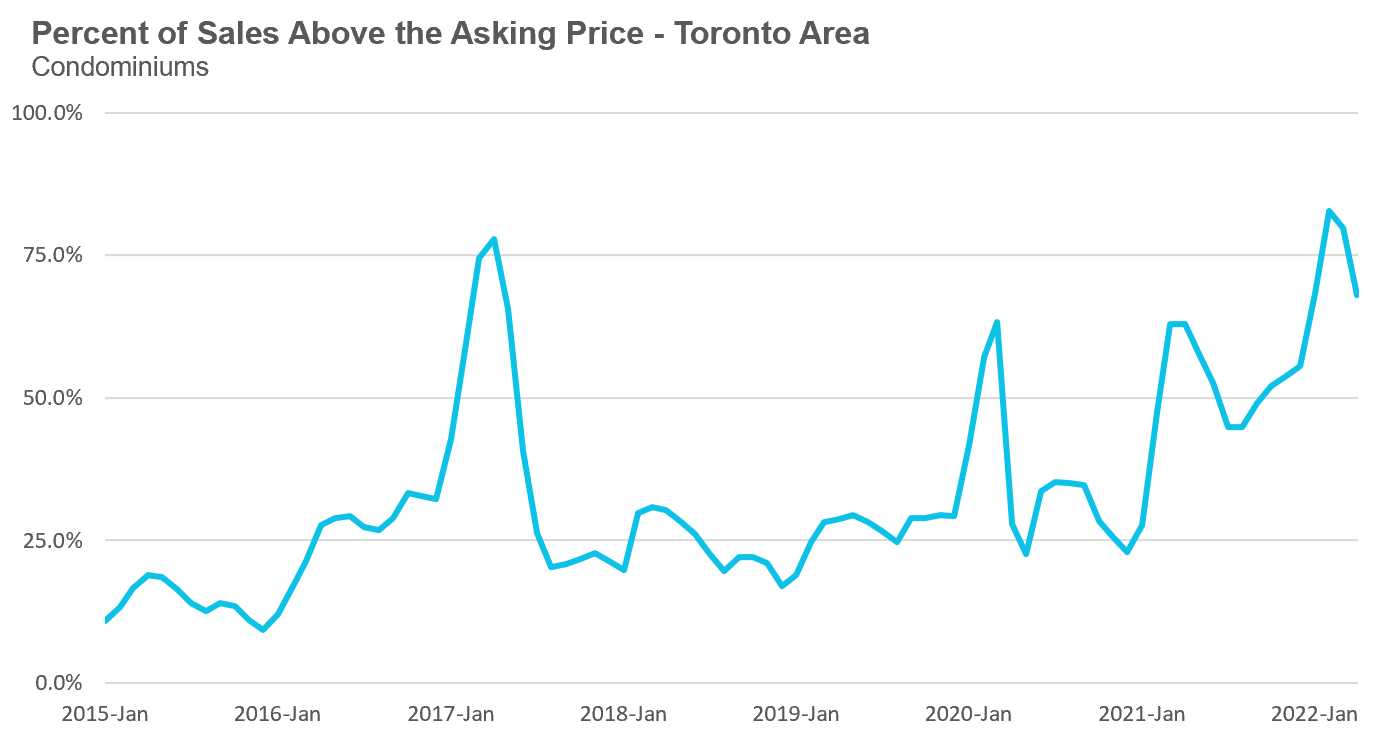
The share of condos selling for over the asking price declined to 68% in April.
The average price for a condo in April fell to $819,698, down from $840,444 in March. The average price is up 16% over last year. The median price for a condo in April was $750,000, up 16% over last year, but down from $777,000 over last month.
Regional Trends
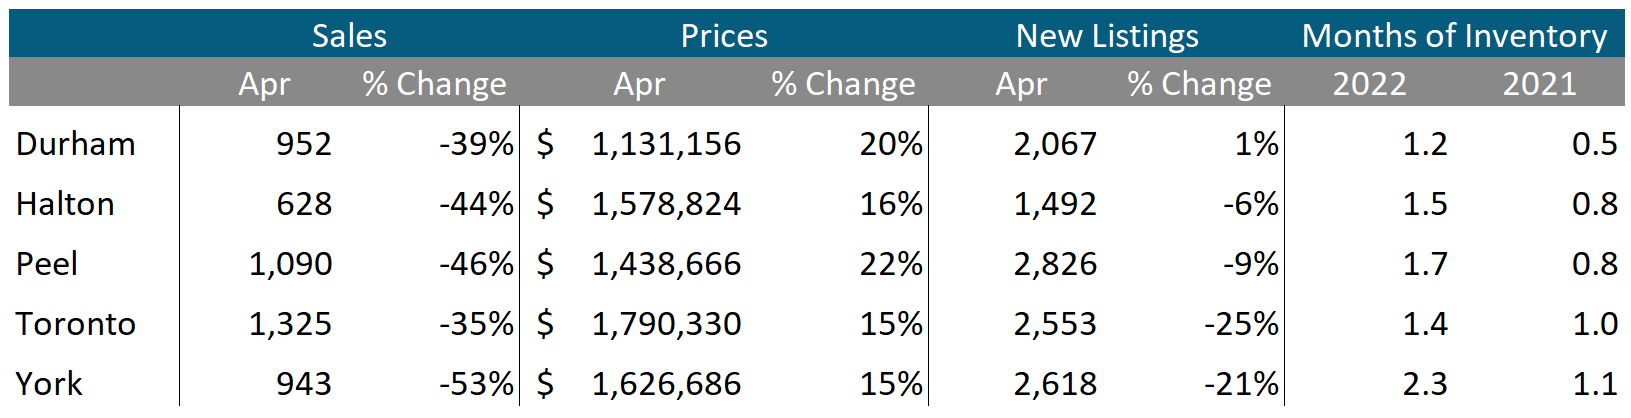
Houses
While average prices were up on a year-over-year (YOY) basis across all five regions in the GTA, sales were down significantly and inventory levels were well ahead of last year’s level, indicating some market slowing.
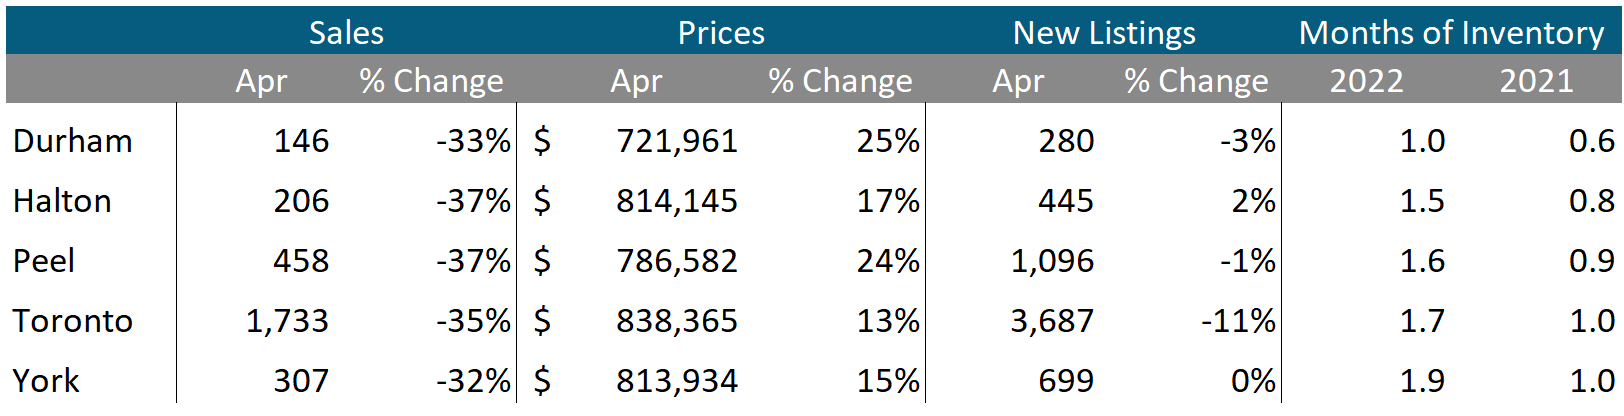
Condos
While condo sales were down across the GTA, average prices continue to be up double digits in all five regions. Current MOI levels are at or above 1 across the GTA signalling a slowing market.
Browse All Real-Time Toronto Area Market Trends on Movesmartly.com:

The Move Smartly monthly report is powered Realosophy Realty Inc. Brokerage, an innovative residential real estate brokerage in Toronto. A leader in real estate analytics, Realosophy educates consumers at Realosophy.com and MoveSmartly.com and helps clients make better decisions when buying and selling a home.
Published: May 09, 2022