
As the Bank of Canada makes a crucial rate announcement, let's review just how we got to this point.
As Featured in the monthly Move Smartly Report:

FREE MONTHLY WEBINAR: The Market Now with John Pasalis
Join John Pasalis, report author, leading market analyst and Move Smartly contributor, and President of Realosophy Realty, and in a free monthly webinar as he discusses key highlights this month's report and answers your questions. A must see for well-informed Toronto area real estate consumers.
Register now to get recording of latest session and access to future sessions.
I like to start the new year by reviewing the past year in Toronto’s housing market and to identify the key trends that I believe ended up mattering the most.
In addition to data on average prices, sales and listing inventory, I take note of what was sentiment on the ground and how did it evolve over time?
Since trends in the first quarter of a year are a continuation of the quarter preceding it, I start by looking back to the end of 2021. The following two charts show the average price, first for low-rise houses and then for condominium buildings and townhouses (condos) in 2021 and 2022, with a vertical line marking the start of 2022.
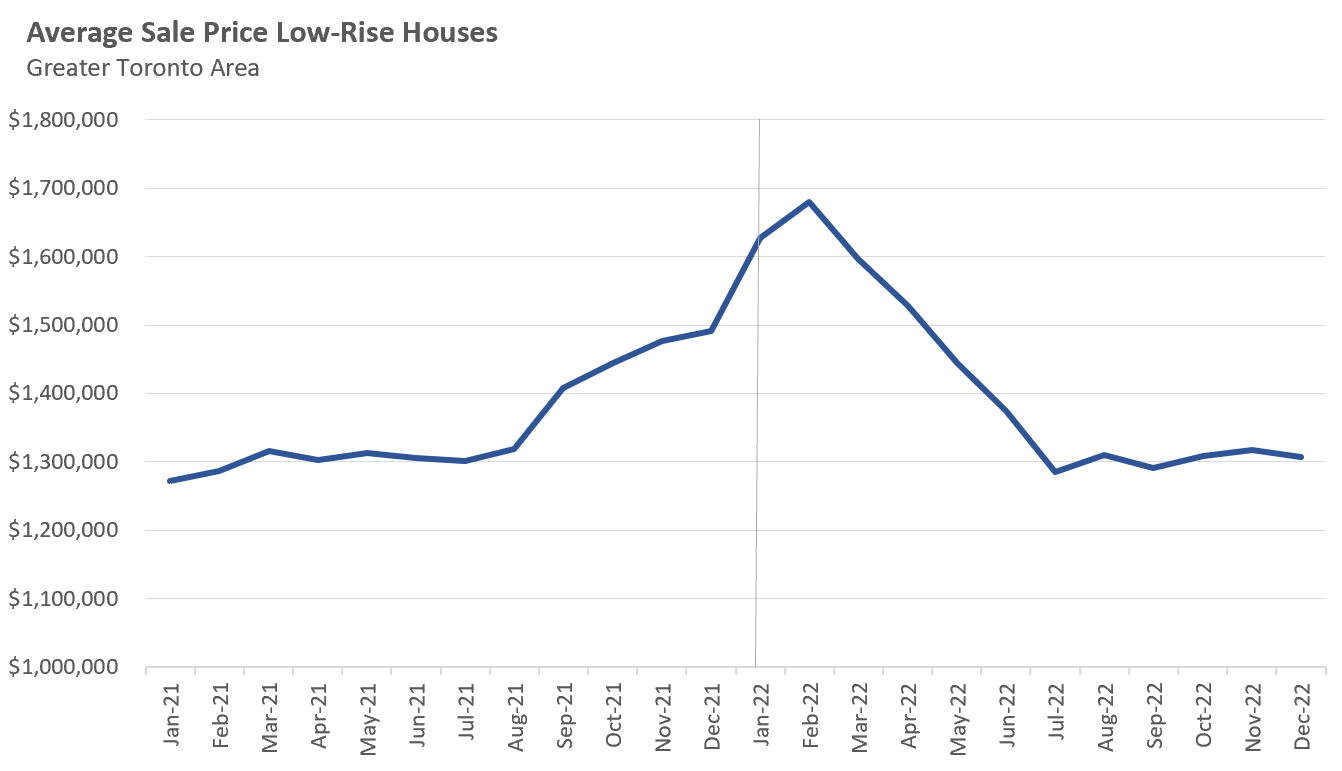
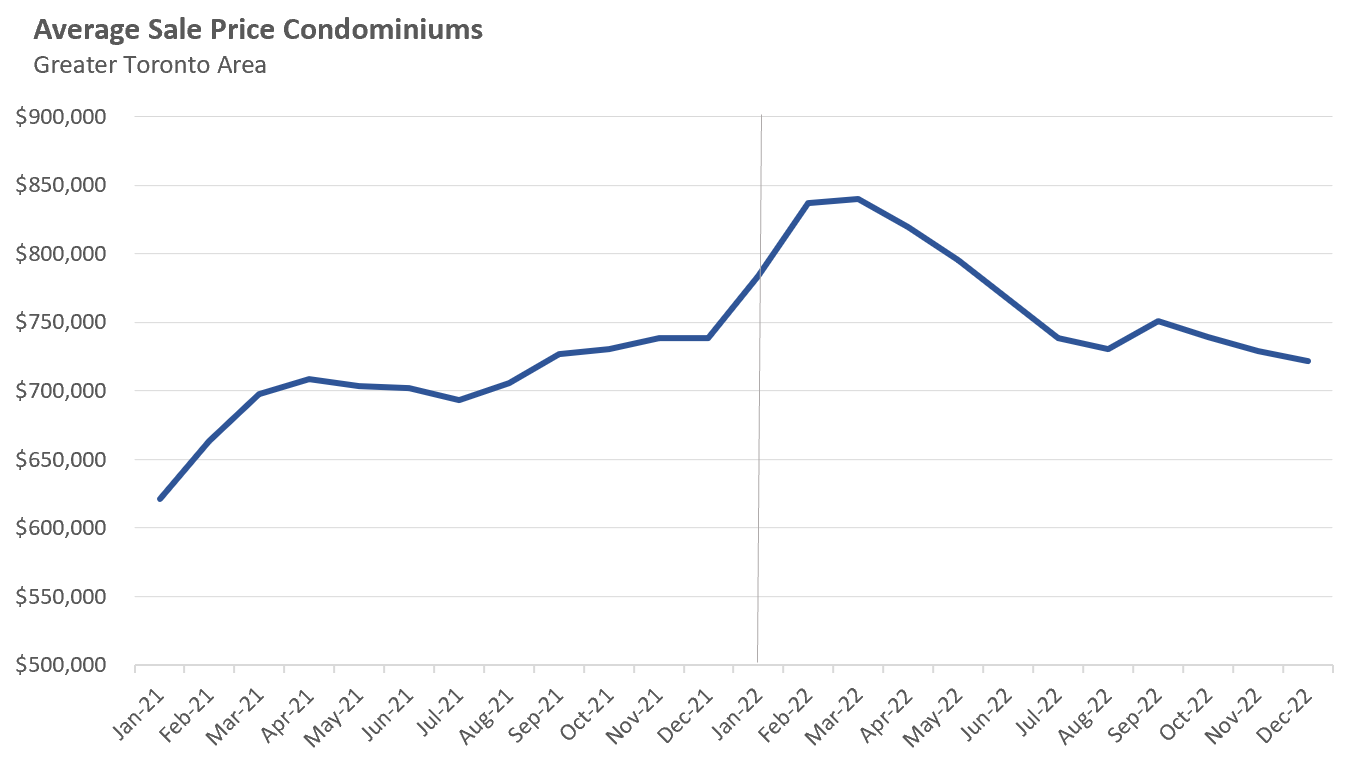
From these charts, we can see that both low-rise houses and condos saw prices begin to accelerate in 2021.
The low-rise market in particular was quite interesting because from January to August of 2021, prices were flat and the market was very balanced, before average prices took off, climbing from $1.32M in August 2021 to a peak of at $1.68M in February 2022, a 27% increase in just 6 months.
Condo prices accelerated 19% over that same period.
There’s no concrete explanation for why the market went from being relatively calm during the first half of 2021 to a frenzied one, other than an irrational exuberance leading to bubble conditions that peaked in early 2022.
In the first two months of 2022, the market was unbelievably competitive with 9 in 10 low-rise houses (and 8 in 10 condos) receiving multiple offers and selling for more than the property’s list (or asking) price. In many cases, low-rise houses were receiving upwards of 50 offers on their offer nights from desperate buyers eager to buy a home.
While sellers and their agents often list homes with artificially low asking prices to generate more buyer interest and multiple offers, this strategy rarely works on almost every home listed for sale. For example, for most of 2018 and 2019, fewer than 25% of homes received multiple offers and sold for more than the seller’s asking price. During the first quarter of 2022, 9 in 10 homes were receiving multiple offers because buyers were buying anything, they were desperate.
But towards the end of February 2022, I started to notice some early signs of the housing market cooling, which I wrote about in my March 2022 report here. The earliest signs were homes receiving fewer showings, getting fewer offers on offer nights and in some cases not even selling on their offer night because it didn’t attract a price the seller was happy with.
So why this sudden decline in demand?
This again is very hard to say with any certainty, but I think there were two primary reasons.
Firstly, after such a frenzied market, buyers who kept losing out on multiple offers week after week gave up and moved to the sidelines as buyer fatigue set in. The other big factor was that the media headlines turned more pessimistic, with the message that the Bank of Canada was likely going to raise rates aggressively to cool Canada’s high inflation rate which would likely result in a chill in house prices. No buyer wants to be caught out buying at the peak of a market.
Many of the sellers who had bought homes in January or February 2022 and still needed to sell their current home started to panic when they found that demand had cooled and they were getting far fewer showings than they expected. Every week that passed, more sellers were willing to sell for less than what their neighbours sold for the week earlier for the security of having a firm sale agreement in place in order to get a mortgage on the home they had purchased.
After average low-rise home prices peaked at $1.68M in February, they fell to $1.29M by July, a $394K or 23% decrease in just five months. I discuss the dynamics during this period in more detail in my September 2022 report.
As we moved towards the summer months of 2022, the volume of monthly sales hit 20-year lows, a decline that was largely driven by the surge in interest rates which made it harder for buyers to qualify for a mortgage. By July, the Bank of Canada had increased rates from 0.25% to 2.5% and most analysts were expecting more hikes in the future.
But in spite of sales hitting these 20-year lows, something unexpected happened — rather than home prices falling further as would be expected, prices stayed flat or plateaued from July till the end of 2022.
One of the primary reasons that prices plateaued is because the decline in sales was accompanied by a decline in the number of new homes coming onto the market as sellers were becoming more stubborn and unwilling to reduce their price and sell in a slower market. In my September 2022 report, I showed that there was a big increase in the number of homes that were simply being taken off the market by sellers or were being rented after the owner was unsuccessful at selling for their desired price.
And this is how 2022 ended with six consecutive months of low sales, low listings and relatively flat prices.
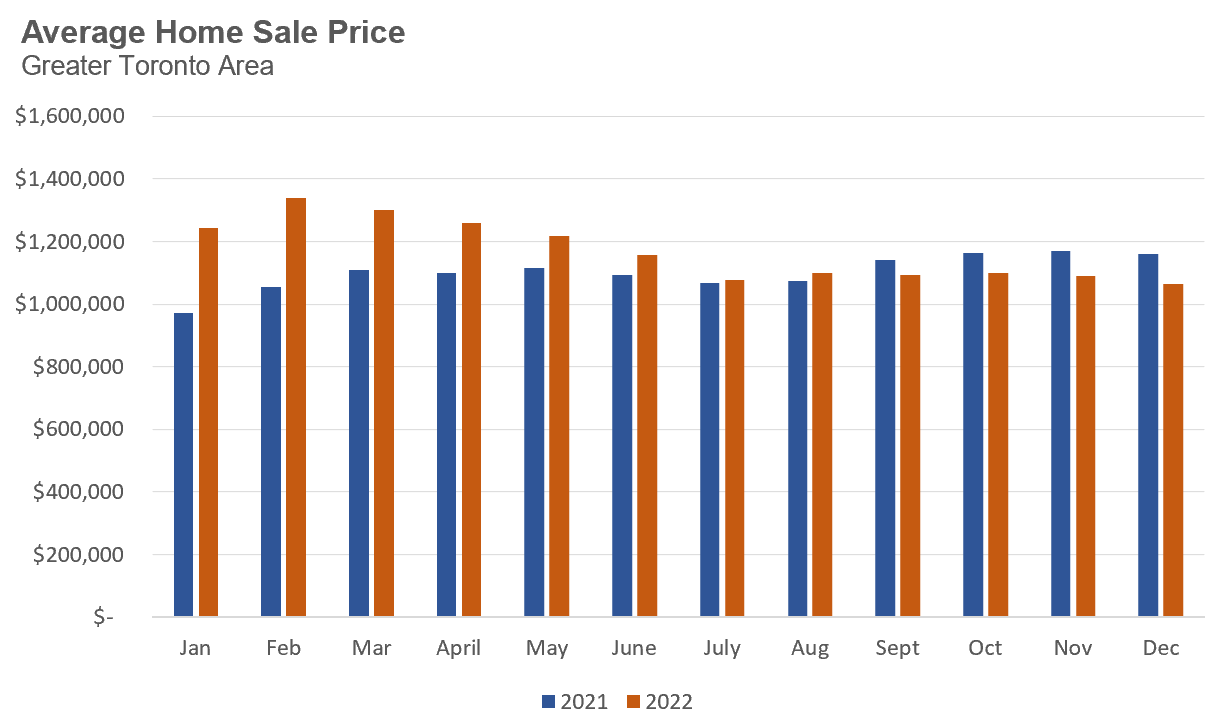
Before wrapping up my year in review, it’s worth highlighting one odd statistic that some might stumble across when looking at annual statistics comparing 2022 and 2021. Even though total sales transactions were down 38% when compared to 2021, the average price for all homes was up 8.6% in 2022 over the previous year.
Just how can annual prices be up given the dramatic decline in sales caused by one of the fastest rate hiking cycles ever?
Firstly, if we compare sale prices by month in 2021 and 2022 we see that even though average prices today are well below the peak reached in February 2022, average prices were up from January to August 2022 when compared year-over-year to corresponding months in 2021.
Furthermore, a disproportionate number of sales in 2022 occurred during the first quarter, when prices were at their highest, and before sales fell dramatically.
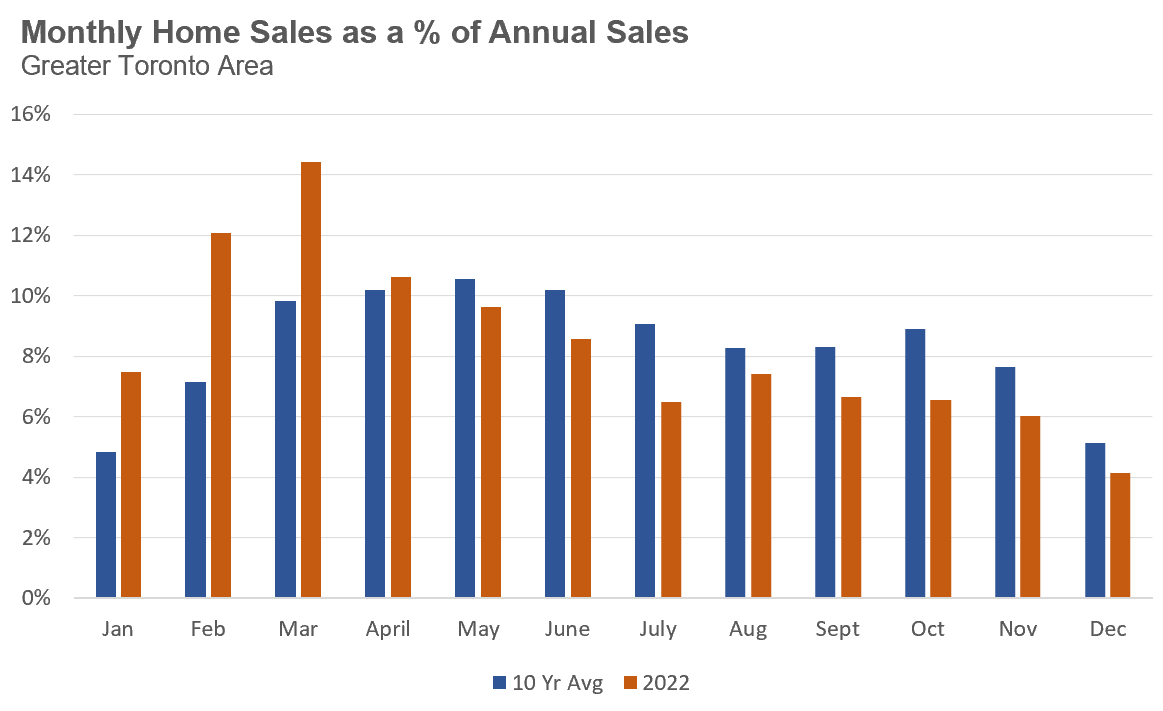
Looking at sales each month as a % of annual sales for 2022 over the previous 10 years in the above chart, we can see that a far greater share of sales in 2022 occurred during the first quarter, which is helping to skew the annual average price for homes in 2022 up.
While the average sales price in 2022 is technically up for the year, it’s the notable downward trend that marked the last six months of 2022 that has mattered most as we enter 2023.
Read More: Trends to Look for in Toronto's Housing Market in 2023
Top Image Credit: Getty/iStock
The Move Smartly monthly report is powered by Realosophy Realty, an innovative residential real estate brokerage in Toronto. A leader in real estate analytics, Realosophy educates consumers at Realosophy.com and MoveSmartly.com and helps clients make better decisions when buying and selling a home.
John Pasalis is President of Realosophy Realty. A specialist in real estate data analysis, John’s research focuses on unlocking micro trends in the Greater Toronto Area real estate market. His research has been utilized by the Bank of Canada, the Canadian Mortgage and Housing Corporation (CMHC) and the International Monetary Fund (IMF).
Published: January 24, 2023


