With demand for real estate falling off dramatically, why aren't we seeing the build-up of homes on the market we'd expect?
As Featured in the monthly Move Smartly Report for September 2022 - watch video above or on our Move Smartly YouTube channel here; read story below and go to report to read all stories for the month.
FREE PUBLIC WEBINAR: The Market Now with John Pasalis
Join John Pasalis, report author, leading market analyst and Move Smartly contributor, and President of Realosophy Realty, and in a free monthly webinar as he discusses key highlights this month's report and answers your questions. A must see for well-informed Toronto area real estate consumers.
Register now to get recording of latest session and access to future sessions.
Home sales in the Toronto area have been at a 20-year low since May, a trend that usually leads to a surge in the number of homes available for sale, or active listings.
While the number of active listings did increase in May and June, we’ve seen this trend reverse course over the past two months with active listings trending down in July and August.
It’s worth noting that inventory levels declining from June to August is a typical seasonal trend, but with sales at such historically low levels, I was not expecting inventory levels to decline as we moved into the fall market.
So why did inventory levels fall?
The answer to this question depends on two things:
- How many homes are being listed for sale?
- Of the homes that were listed for sale but are no longer active listings, how many sold and how many were simply cancelled and taken off the market without selling?
These questions cannot be answered by simply looking at aggregate MLS new listings and sales statistics due to the way the number of new listings are reported by the Toronto Regional Real Estate Board (TRREB). Because an agent can cancel and re-list the same home multiple times and each time they re-list that same home it counts in TTREB as a “new listing”, this data is skewed as a single property would be showing up multiple times, overstating the number of new listings.
Here’s how we can get to the root of what has really been happening.
I’m going to be analyzing all the homes that were listed for sale between May and July 2022 by eliminating duplicate listings for the same house or condo so we can zero in on the number of distinct (or unique) homes listed for sale over that three month period.
Of all of the distinct homes that were listed for sale during that three month period, we are only going to analyze the homes that were no longer available for sale at the end of August. I have this condition because I am primarily interested in developing a better understanding of what is happening to the homes that are no longer available for sale — are they selling or are sellers simply taking their homes off the market?
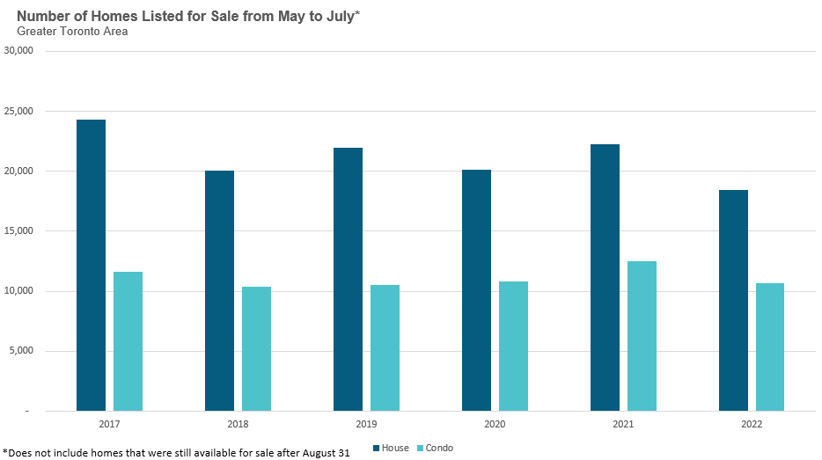
The chart below shows the number of homes that were listed for sale between May and July that were also no longer available for sale at the end of August. We can see that the number of houses listed for sale is below previous years while the number of condo listings is more inline with numbers between 2018 to 2020.
For each of the homes included in our sample above, there are only two possible outcomes: 1) the house sold or 2) the listing was cancelled. The table below shows the share of house and condo listings that were cancelled.
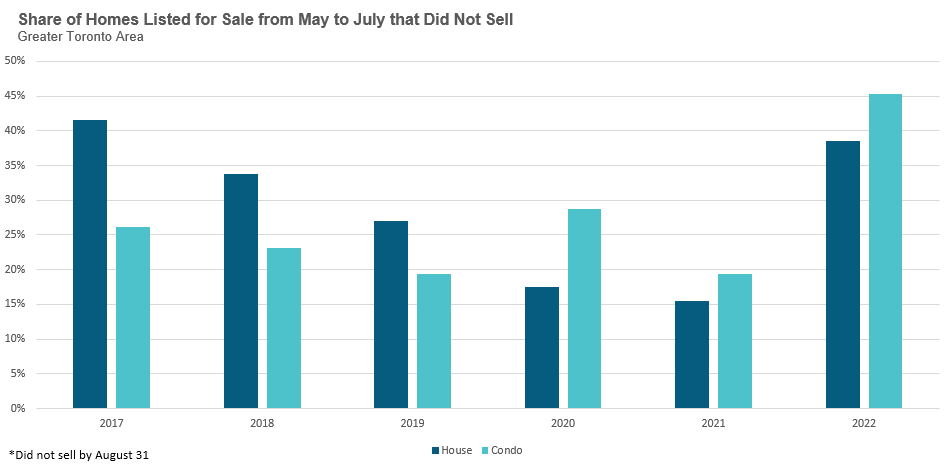
Out of all the houses that were listed for sale, 39% of them did not sell and were simply taken off the market. This is well above levels over the previous four years, and just below 2017.
Toronto’s housing market experienced a rapid increase in low-rise house prices in 2016 and the first quarter of 2017 with prices falling sharply just after the province of Ontario introduced a non-resident speculation tax in April 2017. You can read more about the 2017 house price bubble and correction in my report, A Sticky End: Lessons Learned From Toronto's 2017 Real Estate Bubble. These price dynamics in 2017 are similar to the price dynamics we are seeing in today’s market.
Turning to the condo market, 45% of condo listings in 2022 did not end up selling, well above levels seen in previous years. (It’s worth noting that the condo market was far more balanced in 2017 and did not see the same type of sharp decline in prices we saw in the low-rise house market as seen by the numbers of cancelled listings for each segment in the chart above).
Finally, when looking at all of the houses and condos that did not sell, another question arises — what share of those cancelled listings ended up being rented out instead? There is no precise way of measuring this because there is no way of tracking private rentals or rentals posted on third party websites other than the MLS. But if we base our analysis on the subset of houses and condos that are listed for rent on the MLS system, we can see the share they represent in the chart below.
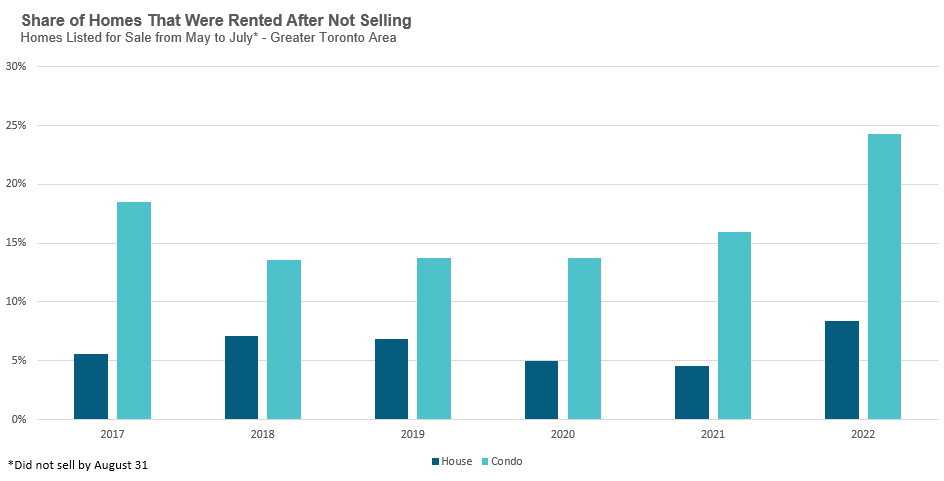
The share of houses and condos being rented after not selling in 2022 was well above previous years.
These trends suggest that homeowners are becoming more patient and are less willing to take a dramatic reduction in the sale price of their home relative to recent comparable sales, with some taking their home off the market and others renting them out instead. If this trend continues, we are likely to continue to see some stability in house prices in the months ahead.
.jpg?width=600&name=Public%20Webinar%20Social%20%E2%80%93%20Sept%202022_MoveSmartly_%20600x300%20(1).jpg)
Top Image Credit: Getty/iStock
The Move Smartly monthly report is powered by Realosophy Realty Inc. Brokerage, an innovative residential real estate brokerage in Toronto. A leader in real estate analytics, Realosophy educates consumers at Realosophy.com and MoveSmartly.com and helps clients make better decisions when buying and selling a home.
John Pasalis is President of Realosophy Realty. A specialist in real estate data analysis, John’s research focuses on unlocking micro trends in the Greater Toronto Area real estate market. His research has been utilized by the Bank of Canada, the Canadian Mortgage and Housing Corporation (CMHC) and the International Monetary Fund (IMF).
Published: September 20, 2022